I don't know what to call it.
The leviathan of lows? The Whale Storm? The Colossus of the eastern Pacific?
Whatever you call it, the largest midlatitude cyclone I can ever remember is about the form over the eastern Pacific. Guinness record keepers should pay attention.
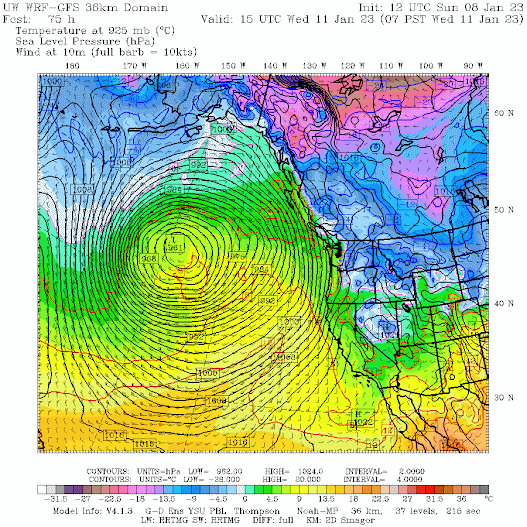
Below is the predicted sea level pressure map for Wednesday at 7 AM from the UW modeling system.
Just wow. A deep low-pressure system of enormous dimensions, extending from Alaska to the latitude of Hawaii. Roughly 2500 miles in diameter.
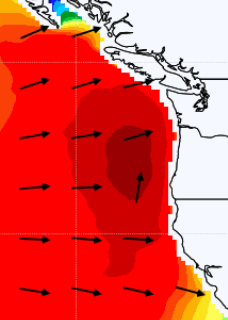
Consider the significant wave height prediction by the NOAA WaveWatch3 model. The forecast for Tuesday evening predicts waves reaching 45 to 50 feet. Extreme waves.
By Wednesday, the area of large waves greater than 25 ft expands and moves eastward, with some large swell reaching the West Coast.
And early Thursday, the Northwest will experience large waves breaking on our coastline (see below),
While all this is going on, California is in the midst of a once-in-a-decade wet/windy weather event. I will talk about this more in future blogs, but the precipitation totals that are forecast for the next ten days are stunning (see below).
Flooding from LA to northern California. Off-the-charts snowfall.
And some of the smaller dams will soon have to release large amounts of water to prevent them from being overtopped,


Any idea what that means for flight turbulence over the pacific on Wednesday?
ReplyDeleteDuring the previous "mega-storm" a couple weeks ago, my son and family's flight from SEA to Lihue, HI was diverted to SFO prior to resuming to HI. Given this newest more southernly monster storm forecast, and assuming the FAA computers and its antiquated computer systems are back on line, good luck.
DeleteHi Cliff, I've appreciated your discussion of California water picture. Would love it if you could talk about the Colorado River at some point given the dire situation with Lake Mead and Lake Powell. Is this wet pattern helping that basin at all? If not, what conditions are favorable for precip and snowpack there? Thanks!
ReplyDeleteThe 100-year trend for Colorado River flows has been consistently downward. I doubt a super wet year would reverse this trend. http://www.riversimulator.org/Resources/AquiferRecharge/TrendFlow100year.pdf
DeleteI suspect the downward trend is due to a combination of watershed development (e.g. agricultural land use expanding) that captures runoff before it reaches the river and less precipitation due to global warming. If your interested in sure there's plenty of articles on the subject.
"less precipitation due to global warming".
DeletePlease explain how global warming decreases precipitation, seriously, please.
DeleteGlobal warming, also called climate change, shifts weather patterns so some areas get more rain and some get less. The current peer reviewed literature indicates the SW US will receive less annual precipitation as the earth warms and this may have already begun. If your really interested there's lots of peer reviewed articles in the journal Nature on this.
DeleteDidn't I see a sub-950 low in the Atlantic last week? That one looked perhaps even more impressive!
ReplyDeleteIt's very interesting to look at satellite loops for 4-5 days or more.Its been one giant gyre in the eastern Pacific.All the surface lows are rotating around the parent upper level trough.Very odd to see the remnant lows of the once powerful California storms end up moving west-northwest through the northern Gulf of Alaska into the Bering Sea.Very unsual to see this kind of circulation pattern.It's like a gigantic cut off low; this new development will just enhance the pattern.
ReplyDeleteI haven't been watching the satellite loops, but this upcoming storm doesn't seem to be coming from California.
DeleteLooking at the UW GFS 36 km forecast maps, I think I see the pattern you're talking about. A series of lows in the 980 mb range work their way up the coast.
Meanwhile, a 960 mb low shows up on the edge of the map out near the end of the Aleutians this afternoon. It heads due east and outright swallows these lesser lows as it approaches. By Wednesday morning, the entire map is one gigantic cyclone.
The wind speeds don't look too crazy, and it starts to weaken as it approaches the coast, but this storm will have a huge distance over which to build-up those waves.
Thursday morning it turns north and fairly rapidly falls apart, but drops a huge amount of precipitation on California.
I was curious who is going to get the most unexpected rain based on those maps. I think Ventura is going to be the winner. There are places that will get more rain, but the Euro forecast that Cliff showed puts a little wet spot near Ventura that is probably the most out of line with what any area normally expects:
Average annual precipitation - 16 inches
Current 10 day total forecast - 10 inches!
They're actually already dealing with flooding from the last storm to hit the coast, and it's going to just keep coming. I hope it's spread out enough to not do much damage.
Would you say Cliff, that this is the second offshore low we have seen in a weeks time that is outside normal variance?
ReplyDeleteAnother massive storm? With record rainfall? Can this one be considered a weather bomb?
ReplyDeleteMassive yes. Bomb, no.
DeleteWill be interesting to see what happens. I have 2 friends that have cabins on the Washington Coast, just south of what used to be the Sandpiper resort (now owned by Seabeck) come Thursday when the huge waves reach our shores.
ReplyDeleteWow, I wish I could go to Cape Disappointment to watch those waves crash on the rocks.
ReplyDeleteIt is the night of Jan 9th here in the LA Hollywood Hills and my weather station is showing 3.3 inches of rain so far for today. That is about 25% of the annual rainfall in ONE day...this is a monster rain event for California.
ReplyDeleteCrazy! Is much soaking into the ground or is it all runoff at this point?
DeleteShasta and Oroville reservoirs can use a fill-up. https://cdec.water.ca.gov/resapp/RescondMain
ReplyDeleteIt gets complicated between what releases are required by law and what's needed for hydro power to fulfill the grid. Surely the switch to electrification in California isn't going to make the storage situation any better. But what do you think the MSM will point to? That's right - if the current weather is dry they'll point to AGW. If the current weather is wet they'll point to long term drought and AGW.
DeleteTide levels in Seattle appear to be running about 1.5 ft above prediction the past couple of days. In earlier posts about the December flooding events you highlighted the apparent effect of low atmospheric pressure on tide levels. Local pressure levels are not particularly low right now - could the conditions off the coast be causing the higher tides?
ReplyDeleteThe fact that many reservoirs will be forced to release the massive inflows coming over the next week demonstrates the utter insanity of CA's water management over the past five decades. They could be banking much of this for the inevitable drought years to follow, if only they had built the additional dams when warned. All this damage to property and lives yet the upside is marginal, at best.
ReplyDeleteOne suggestion to save water is to breach the levys and let the water flood the fields where it will be absorbed and recharge the groundwater. Tucson diverts monsoon floods into holding ponds for the same reason.
DeleteThe Thing From My Nightmares
ReplyDeleteThere is another Low 3,000 km to the west. On Nullschool it looks
ReplyDeletelike two large eyes on Earth's face.