October 31, 2024

Global Warming Failure

Albert Einstein supposed wrote:

"The definition of insanity is doing the same thing over and over and expecting different results"


Considering the issue of global warming, much of the developed world, and states like Washington and California, are acting kind of insane.

Western nations and the U.S. have spent trillions of dollars on reducing greenhouse gas emissions.  Washington State has spent billions through the controversial CCA (Climate Commitment Act) pushed by Governor Inslee and friends.     Solar arrays and wind turbines have been distributed across the nation.

Did all this effort and loss of treasure accomplish anything significant?

Hard evidence suggests the answer is definitively no.

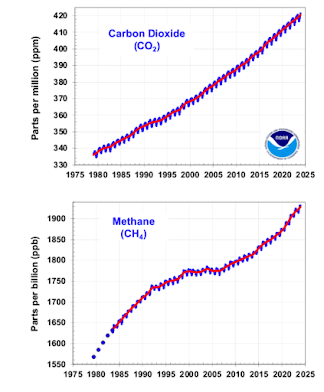
Consider the trends of the two main greenhouse gases, CO2 and methane (see below).  (Remember, that a greenhouse gas warms the planet by absorbing and emitting infrared radiation.)

CO2 concentrations (and emissions) are going up steeply, with no reduction of the upward climb.  Methane gas is going up faster than ever.     

We are making no progress in reducing the upward climb of these two gases.

None. Zero.  Zippo.


NOAA has a nice website that describes this lack of progress (here).  On that website they show the net rise of all greenhouse gases (black line) and the total radiative influence of these gases (red line, shown below).   Going up very fast with no lessening of the rate.

Mankind has made no progress at all. 


The reason for the unabridged continued rise in greenhouse gases is clear: while the Western nations are spending lots of cash attempting to reduce emissions, many second and third-world countries are rapidly increasing their use of fossil fuels to facilitate modernization and the improvement of the lives of their citizens.

Here in the U.S., many folks who think they are following the low-carbon lifestyle, by driving electric cars and using heat pumps, have huge carbon footprints due to all the flying they do and all the stuff they buy.    Electric cars require large amounts of fossil fuels to create and often the electricity is from fossil fuel sources.  Electric bicycles have the same problem.
Heavy, big tires, big battery.  Not good for the environment

Furthermore, many of the attempts to reduce emissions in places such as Washington State have been wasteful and ineffective.

The poster child of such ineffective waste is Washington's CCA (which is being voted on next week).   Billions are spent on a range of projects, without any requirement for reducing emissions or demonstration of reduced emissions.  Most of the projects will have no impact on CO2 emissions.  This waste is one reason I am voting for Initiative 2117 and so should you.   The CCA is also profoundly regressive, hurting low-income people the most.


So What Do We Do?

In some places, solar energy and wind can be useful, but they are too intermittent and limited to solve the problem.

Want proof?  During the past two days, solar and wind (green line), have produced less than our one nuclear plant (red line), and MUCH, MUCH less than hydro (blue line).


Only nuclear power is viable for a massive replacement of fossil fuels.   Fission is available now and is not being applied sufficiently.   Fusion power will be available within a decade or two.
MIT Fusion Project

Once we have fusion power, virtually limitless amounts of clean energy will be available.  Such energy can be used to remove CO2 from the atmosphere.

Problem solved.  

_________________

NOTE:  I will hold a special online zoom session at 10 AM on Saturday for Patreon supporters.  I will discuss the forecast for the upcoming winter and answer your questions.

October 29, 2024

The Dangers of Heavy Precipitation over Local Roadways

On Sunday, the substantial dangers of localized heavy precipitation for highway travel were made clear.  In this blog, I will describe what happened and suggest steps you can take to stay safe.

The first situation occurred Sunday morning on I5 near Bellingham after heavy overnight rain.   A mudslide pushed over the roadway, trapping a truck and closing the freeway for 10 hours (see picture below).


Then around 1:40 PM, after the passage of a band of heavy showers, there was a blinding reflection of sunlight on a wet I-5 near Kent, resulting in a mass collision on the freeway encompassing 45 cars.

You read that right:  45 vehicles were smashed up and the road was closed for hours (proof below).


The first question that most of you must have is this:  how much rain fell during the event on Sunday?

The totals for Saturday and Sunday are shown below. Over two inches(2.12 inches) at the Bellingham Airport and as much as 5 inches over the western slopes of the Cascades.  Roughly an inch around Kent.


The 2.12 inches in Bellingham broke the daily record and was the 18th heaviest day over the entire record (going back to 1949). A culvert was blocked by a roll of carpet padding, leading to the failure of the adjacent slope.  

The Kent accident cases were more interesting.....and much more avoidable.

The radar image a few minutes before the accident (1:02 PM, 10/27 showed a band of moderate showers ( yellow colors) over the roadway.


As shown by the visible satellite image at 1:16 PM, the band had moved east and most of the clouds were gone, allowing sunshine on the roadway.  


So what happened?   Keep in mind the southbound I5 had the problem--the direction heading towards the sun.  There were several reports of substantial glare on the roadway.

The classic situation is that a pack of cars is traveling too fast for wet conditions and far too close.   One driver is blinded by the glare and slows abruptly, starting a chain reaction collision with the cars behind him/her.  

I suspect this is what happened in this case.  The other familiar failure mode is when one car enters heavy rain and rapidly slows down, resulting in a chain of collisions of the cars behind them.  Dust storms and fog can do the same thing.

The advice is clear.  During rainy conditions slow down and leave substantial room between you and the car in front of you.


October 27, 2024

The Unnecessary Decline of U.S. Numerical Weather Prediction

This week I fielded a call from a reporter from the Washington Post, who wanted to discuss why the U.S. has fallen behind in using machine learning for weather prediction.  The story is here.


The reporter only had half the story:  traditional U.S. global weather prediction models, which solve the complex equations that describe atmospheric physics, have declined into mediocrity.

Specifically, NOAA's global model, the UFS, is now in third or fourth place behind the European Center, the UK Meteorology Office, and often the Canadians. The plot below shows a comparison for the middle troposphere (at a pressure of 500 hPa) between the European Center and the NOAA.   We are behind and not catching up.


But it is even worse than this.  The European Center is actively pushing AI/ML (Artificial Intelligence/Machine Learning) numerical weather prediction, with their efforts producing even more skillful predictions.   NOAA is hardly trying.

To put it bluntly, U.S. operational prediction is being left in the dust.  We have settled into mediocrity with little hope of change. 

This is entirely unnecessary and I can tell you why.  I have written two peer-reviewed papers in a major meteorological journal (here) and have served on national committees and attended numerous meetings considering the issue.

U.S. numerical weather prediction (NWP), which uses computer simulation to predict future weather, should be the best in the world.

Our nation invented the technology and led the world for decades. We have the largest meteorological research establishment in the world and spend more money on weather prediction than any nation.  Our private sector invented machine learning numerical weather prediction.

The United States should be far ahead of the rest of the world in a technology that saves lives, promotes our economy, and has great strategic value.  But we are not.

As you will see, this unfortunate situation results from ineffective government bureaucracy, isolation of government weather prediction from the creative energy of the university community, and too much money leading to multiple duplicative efforts, among other reasons.   

Reason Number One:  U.S. numerical weather prediction is spread over too many agencies 

In most nations, numerical weather prediction is the responsibility of one group.  In the U.S., governmental global weather prediction is spread over FIVE efforts:

  • NOAA, the National Oceanographic and Atmospheric Administration (the leading U.S. effort)
  • The US Navy
  • The US Air Force
  • NASA
  • U.S. Department of Energy

Thus, scientific and technical talent and computer resources are diffused over five groups, greatly undermining progress.

But it is worse than that.  Another independent (and important) independent NWP development is found at the National Center for Atmospheric Research, the combined effort of the university community. Government agencies have generally not taken full advantage of such university research and development.


The private sector also has major global weather prediction efforts, such as those run by IBM/WeatherChannel and several high-tech firms developing AI prediction systems. 

With national resources divided, with relatively little cooperation and few joint efforts, U.S. progress in global weather prediction has trailed behind other nations and the state of the science.

Reason 2:  NOAA Organization of NWP is Flawed

The central U.S. agency responsible for operational numerical weather prediction is NOAA, of which the National Weather Service is a component.  In NOAA, no single individual has overall responsibility for the success of U.S. operational numerical weather prediction. 

Today, the NWS Environmental Modeling Center (EMC) director, who is responsible for running NOAA forecast models does not control model development, which is found outside the National Weather Service in NOAA OAR (ESRL, GFDL, and NSSL labs).   Funding for model development initiatives, and particularly the support of extramural modeling research, is found in both the National Weather Service Office of Science Technology Integration (OSTI) and the NOAA OAR Weather Program Office (WPO), not by the leadership of EMC.  


This division of responsibility and resources has led to competing efforts, wasted resources, and occasionally unproductive conflicts and tensions.

NOAA management has also made some very poor decisions that have undermined progress.  For example, 8 years ago, realizing their global modeling system needed to be replaced, NOAA management decided to use an in-house system (FV-3) instead of a modeling system developed by the academic community (NCAR's MPAS).

Refusing to complete extensive testing and rejecting warnings about FV-3 (that it failed to accurately simulate convection...e.g., thunderstorms), they adopted FV-3.   As predicted, the model flaws became apparent in recent years and NOAA is being forced to abandon FV-3.  The result is the loss of nearly a decade of effort and tens of millions of dollars of public funds.

Reason 3:  Lack of Cooperation and Joint Research and Development with the Academic Community

As noted above, NOAA rejected the the well-tested model developed by the university community, called MPAS.  Today, they are being forced to reconsider that decision and recently announced they will use MPAS for regional applications, but have been silent regarding global prediction.

But NOAA's refusal to work with the large university community is more clearly shown by the story of the EPIC center. In 2017 Congress passed the Weather Research and Forecasting Innovation Act, followed by the National Integrated Drought Information System Reauthorization Act of 2018, which established an Earth Prediction Innovation Center (EPIC). 

  It was hoped that EPIC could become an independent, national center for model development and innovation, bringing together the academic, governmental, and private-sector communities. Unfortunately, NOAA downgraded EPIC into an entity centered on code maintenance and support, not the independent national development center visioned by Congress.  A major defense contractor with no experience in weather prediction was given the contract (Raytheon).

To put in politely, EPIC is recognized as a failure.

Reason 4:  Inadequate computer resources.

U.S. operational NWP has historically suffered from a lack of computer resources, often with far less computational capability than competitors with lesser requirements (e.g., ECMWF).  A decade ago, during the landfall of Hurricane Sandy, NOAA/NWS/NCEP operational NWP computers only had a peak capacity of 0.1 petaflops, roughly one-tenth of that available to ECMWF, which possessed a far more limited NWP portfolio. Although NOAA/NWS has recently acquired significant computer upgrades, it possesses only a fraction of the computer resources it could productively use in operational NWP.   Furthermore, there is a profound shortage of computing resources for supporting research. 

High-resolution global prediction (grid spacing of 3 km or less) could revolutionize weather prediction, producing far more skillful forecasts, but NOAA has no plans to secure the computing resources necessary to make this happen.

The Department of Energy is able to acquire vast computing resources hundreds of times greater than NOAA.  NOAA needs access to such computing capabilities to help protect and warn the American people.


How the U.S. Could Have the Best Global Weather Prediction Within A Few Years

If the new Congress and President wish for the U.S. prediction effort to gain world leadership within a few years, this is how to do it:

1.  Establish an EPIC center outside of NOAA, that will be an independent national center to develop and test the best global weather prediction models in the world.  Many of the critical pieces are available today:  the NCAR MPAS global model and the JEDI data assimilation infrastructure.   This will be a multi-agency effort with the active participation of NCAR and the university community.

2.  Move all forecast model development, support, and operations in NOAA into ONE entity, with one person being responsible.

3.  Secure at least 100 times the current computer resources for forecast model development and operations.

4.  As part of the EPIC effort, actively evaluate and test ML-based prediction approaches, with close cooperation with American tech firms that are already active in this field.  Develop operational ML weather prediction systems, as well as hybrid approaches with physics-based models.

In five years we could easily be the best in the world.


October 24, 2024

Heavy Rain Returns to the Northwest as a Deep Cyclone Develops over the Gulf of Alaska

 Substantial precipitation is expected during the next week, especially in the mountains.

Rain will move in Saturday morning, with totals reaching over two inches of liquid water over the Cascades by 5 PM Sunday (see below).    Sunday looks particularly wet, so a hike in the mountains might not be a good idea.


Precipitation will continue into next week, with substantial totals through 5 AM Tuesday from northern California through southwestern BC.


The rain will be welcome.   Some rivers in the region are currently running below normal flow (see below).   That will not be true in 5 days.
Green are near normal, red and orange, below normal.


Also impressive over the weekend will be the development of an intense low-pressure center,  a "bomb cyclone" over the Gulf of Alaska. On Saturday morning, the central pressure will be down to a respectable 960 hPa.


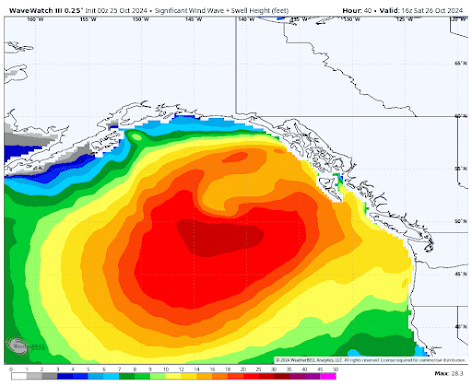
Such a big storm will result in significant wave generation, with major waves reaching our coast.    Saturday morning significant wave height will attain 25 ft (see below).


By early Sunday morning, big waves will reach the Washington coast.


It is good the Alaska cruise season is over.  

Finally, for the bizarre and scary, the latest National Weather Service global model forecast has ANOTHER major hurricane approaching Florida, just before the election.  Stay tuned.   Most of the major models have different, less threatening solutions.


October 22, 2024

Snow Returns to the Mountains

The first sigmificant snowfall over the higher elevations of the Northwest occurred during the last two days.

Consider the image from the Crystal Mountain 360 cam two days ago (the peak of Crystal is at about 7000 ft).  

No snow on Crystal and little snow on Rainier below the glaciers.   Nice cap cloud though...


This morning, a very different story.   Crystal has some snow and the lower slopes of Rainier are now white.


What about the view from space?

Below are the visible images two days ago (left) and this morning (right) for the region covering Rainier, St. Helens, and Mt. Adams.  A LOT more snow coverage this morning.
There were some beautiful snow-capped peaks this morning.  Here is a picture taken earlier today by Debra Ellen Baker of Glacier, WA of Church Mountain (elevation 5693 ft).  Impressive.  


But now let me provide the exciting news.....some decent mountain snow is being predicted after this weekend by several forecast models.

The UW WRF model shows only a very light snowfall total through Sunday at 5 PM.

Moderate snow totals through Monday night.


And as much as a foot in place by Friday morning.


Do you really want to get excited?  The European Center snow total forecast through next Thursday evening has even more, with several feet in the north Cascades.


Time to get those skis ready!


October 20, 2024

Why Do Strong Southerly Winds and Western Washington Rainshadows Come Together?

There were two singular aspects of the weather on Saturday.  First, there were extreme variations in rainfall across the region, with an amazing rain shadow over Puget Sound.

As shown below, for the 24 hours ending 10 PM yesterday, there was nearly 5 inches of rain over the western slopes of the Olympics, but only 0.01 inches near north Kitsap County in the Olympic rain shadow.

You read that right, a factor of FIVE HUNDRED in rainfall.


If you want to be further impressed, consider southeastern Vancouver Island, where a peak rainfall of 11.17 inches was observed over the coastal side while only 0.57 inches fell in the lee.   


And then there were the winds.

Strong, gusty winds from the south and southeast were found across western Washington, with Paine Field winds gusting to 62 mph, with 50-55 mph observed at several sites (below, max gust yesterday).


As shown by the wind observations at Paine Field in Everett, the winds really revved up between 2 and 5 AM on Saturday and then stayed strong for hours.

Paine Field sustained winds (cyan) and gusts (purple)

And now the interesting part.  The rain shadow and the strong winds were directly related.  

The flow that produces a strong rain shadow also results in powerful southerly winds.

Let me explain.

The heavy precipitation on the western side of the local terrain and the rain shadow to the east of the mountains are associated with strong moist westerly flow (winds from the west) reaching our region.   

To show this, the winds around 5000 ft (850 hPa pressure) yesterday afternoon are found below.  The lines are like pressure (called heights), and the winds aloft tend to be parallel to the height lines.  The closer the lines are together, the stronger the winds.  Lower heights are to the north and higher heights to the south, which is associated with higher pressure to the south and lower pressure to the north.  Remember this.


Such strong incoming flow rises on the western side of local causing precipitation enhancement and then sinks on the eastern slopes producing a rain shadow (as shown in the schematic below).


The windward enhancement was obvious in the weather radar yesterday afternoon (see below)


The accumulated precipitation during the event simulated by the UW WRF model, is below.  We have an amazing ability to simulate these precipitation contrasts.


But this wind field is also associated with strong winds from the south over Puget Sound and the Georgia Strait.

As noted above, to get strong winds from the west or southwest approaching the mountains aloft, there needs to be lower pressure to the north and higher pressure to the south.  In meteorological classes, we explain this fact, which is associated with geostrophic wind balance.   

Now, let me show you the predicted sea level pressure pattern yesterday afternoon.  

You will note low pressure over British Columbia and higher pressure over Oregon.  There is a large north-south pressure difference over western Washington State  At low levels in the presence of terrain, air moves directly from high to low pressure, which explains the strong southerly winds.   Offshore, away from terrain, the low-level winds are more parallel to the sea-level pressure lines, which are called isobars.


One final thing, why were winds particularly strong over the north Puget Sound area, such as Paine Field?

Because the pressure differences (a.k.a. pressure gradients) are particularly strong there, something shown by a high-resolution simulation for nearly the same time (see below).    

Why is the pressure difference large there?   Because of the tendency to produce a low-pressure area in the lee (downstream) of the Olympics.   Analogous to an eddy in the lee of big rock in a stream.


Strong southerly winds also bring up warm air.....and yesterday's high hit 65F at SeaTac, 6 degrees above normal.

Today should be warm and dry for most of western Washington until late afternoon when a moist Pacific front will cross the region.


October 18, 2024

Profound Rainshadowing over the Western Washington Lowlands

If you like extreme differences in precipitation, the Pacific Northwest is the place for you!

A moderate atmospheric river is heading into our region: some locations will get huge amounts of precipitation, while others will enjoy only a few sprinkles.

At lower elevations in western Washington, you will hardly need to use an umbrella.

Let's start by looking at the predicted 24-h precipitation totals ending at 5 AM Saturday morning (below).

Parts of the Cascades will get 2-7 inches, while southwest Vancouver Island will be drenched with nearly a foot of rain.   In contrast, many western Washington locations will receive 0.05 inches or less.  Near Sequim, almost nothing.


The next 24 hours, ending 5 AM Sunday?  Virtually the same story. Wet Olympics and the North Cascades, with generally dry lowlands (see below).   I plan to work in my garden tomorrow and go for a long run.


All this will occur as a moderate atmospheric river slams into our region.  To illustrate, below is a plot of the key measure of atmospheric river activities, integrated water vapor transport, a measure of how quickly the wind is moving water vapor horizontally.  The magnitude is indicated by the shading (purple is the most) and the direction and magnitude by the arrows.

A strong plume of moisture (and wind) is moving from the southwest to the northeast at the time shown (8 PM tonight, Friday).  Most of the weekend will have the same pattern.


With winds from the southwest, air rises on the western side of the regional terrain (producing more precipitation) and sinks on the eastern slopes (where this is a rainshadow).

That pattern of windward enhancement and leeward rain shadowing explains the complex precipitation pattern shown above.


You can see the precipitation/cloud pattern setting up this afternoon.

Less cloudy areas are developing over the lowlands (see visible satellite image at 3 PM, arrows show the areas)


And the rainshadow is clearly evident in the regional weather radar imagery.

So stay out of the mountains and you will be relatively dry.