June 29, 2016

The KPLU Triumph

Sometimes the good guys win.   Today is such a time.

A few hours ago, we learned that Pacific Lutheran University (PLU) has agreed to sell popular public radio station KPLU to a community group (Friends of 88.5) for 7 million dollars in cash, plus 1 million dollars in underwriting.

Against great odds, the Puget Sound community said no to a sale of the radio station to University of Washington's KUOW, which longed for a regional public radio monopoly and KPLU's transmitters/frequency allocations.

This is not just a western Washington local triumph, but an achievement of national implications. 

It is about a community that said no to the loss of diversity in local news and regional programming.   No to the trend of corporatization and nationalization of local content.  Yes, to valued and unique jazz and blues programming.  Yes, to distinguished local news coverage.


A record breaking amount of money was raised while an army of naysayers said it was impossible.

And the community showed the extraordinary power of social media to dissuade bad decisions of even the most powerful local interests.

The story of the saving of KPLU has the breadth and interest to make a compelling novel, with twists that would inspire a Hollywood screenwriter to think about the movie potential.   It has greedy/deceptive villains.  Moneyed and powerful interests wanting to get their way.  Secret deals.  Heroes and heroines.  A Hail Mary attempt to save the station that worked.  Record breaking fundraising.   Covert KUOW emails revealed in the press.  Fight Club. The participation of thousands of listeners and supporters.  The innovative use of social media.  Leadership and staff at KPLU that would not give up.   And even gunfire in a Seattle Public Library branch.

It is a story so unusual and far fetched that most would think it was a tall tale.  But it wasn't a story...it was real.  And KPLU, whatever it will be called in the future, will provide regional listeners and jazz/blues lovers from around the world with the programming they love for many years to come.

Stephen Tan, Chair of Friends of 88.5, and Joey Cohn, KPLU head

For me, the most interesting questions deal with the future.

How will KPLU evolve and grow as it becomes an independent entity, unfettered by their connection with PLU?    KPLU management has learned deep lessons about the importance of community engagement and the value of close ties with its listeners.   I suspect those lessons will have profound effects on the trajectory of the station.

For KUOW, this failed hostile takeover attempt of a valued local public radio station should stimulate deep reflection and reform.  KUOW management worked on a secret agreement to buy KPLU, skirted public meeting laws to keep the public uninformed before a UW Regents meeting, planned on using pledge money acquired for KUOW operations for the takeover bid, and wasted large amounts of money on a jazz outlet meant to put pressure on KPLU.

Perhaps even worse, KUOW management has stripped most of the local programming from the KUOW weekday schedule, filling the hours with bland nationally syndicated material.   It is time for KUOW to reappraise its programming,  bringing back much more local content.  The rich resources of the University of Washington should be entrained into the on-air material, and the management of KUOW improved (clearly the KUOW board has been ineffective at best). And there should be many opportunities to join forces with a resurgent KPLU.

KUOW can become a far better public citizen and regional news organization.   And to do so, it would be advised to follow the model of integrity and listener engagement so evident at KPLU.

June 27, 2016

Who provides the best weather forecasts?

One question I frequently get is: where can I get the best weather forecasts?   Quality varies substantially and the answer is often different between garden variety forecasts and more difficult rare/severe weather events.

So what about garden-variety weather predictions?  What source is best?  The National Weather Service, Weather.com or Accuweather?  Or what?

There is a web site, forecastadvisor.com, that provides average verification statistics for the last month or year for a large number of locations.  Our independent verification for some Northwest locations suggests that this site is relatively reliable.  

Here is the table for Seattle for the last year.  For temperature, they consider a forecast accurate if it is within 3F.    Precipitation is not so clear, since they consider the forecast as rain if there is any chance of precipitation in the forecast.   So you might dismiss the precipitation evaluation...although all forecasts are verified in the same way.

Considering temperature, the three best are the Weather Channel, the Weather Underground, and Accuweather--I doubt whether the differences are statistically significant.   The Weather Service is a step down.


What about Spokane?  The same three are on top, but this time Accuweather is the leader, particularly for low temperatures.  They are good at low temperatures.  Again, the NWS lags a bit.


Finally, lets look at Yakima, the primary agricultural center of our state.  Same three in the lead, and Accuweather is again better at the low temperatures.

So why do the Weather Channel, Weatther Underground and Accuweather produce better forecasts than the National Weather Service on average?    The key reason is that they generally make use of multiple  weather forecast models (e.g., US GFS, European Center and UK Met Office models), and  then do sophisticated sophisticated statistical postprocessing to combine the forecasts in an optimal way.   The National Weather Service has lagged in statistical postprocessing, depending heavily on a forty-year old system called MOS, Model Output Statistics.    Thus, it the guidance provided to National Weather Service forecasts has been less than state of the art.

Fortunately, this is changing.   During the past year, the NWS has developed the National Blend of Global Models, which statistically combines an international collection of global models and traditional MOS to produce better forecasts.   The results so far are encouraging, with reduced error and lower biases.

With these advances, I would expect the National Weather Service average statistics will move closer to the Weather.coms and Accuweathers during the next year.

The National Weather Service human forecasters do play an important forecasting role, particularly when unusual and extreme weather occurs.  Events in which the models and statistics can fail, but where long experience and physical insights can be critical.  Some private firms, like Accuweather, have also invested heavily in a substantial human forecaster contingent.

The National Weather Service forecasters are positioned in a two-tiered system:  the roughly 120 forecasts offices spread around the nation, and national speciality centers, such as the the Storm Prediction Center in Norman Oklahoma or the Weather Prediction Center in Washington DC.  The first group is responsible for local prediction, while the latter specializes in specific types of extreme events, like severe convection (Storm Prediction Center) and heavy precipitation/flooding (Weather Prediction Center).

The Weather Prediction Center has found that humans can provide positive impacts for very heavy precipitation events over numerical model guidance (of course the humans START with the numerical guidance).  The Storm Prediction Center is absolutely world class, providing the best severe thunderstorm warnings in the world.

The future will be one where garden variety weather is mainly taken care of by statistically corrected ensembles of models, with humans spending most of their time dealing with extreme weather, resolving with model problems, and communicating forecasts to the public and critical user communities.  

Even  today if you are looking for a weather forecast on average day, the forecast from your typical weather app (weather.com, accuweather, etc.) are fine.  But when severe weather is possible, turning to an outlet in which humans are carefully following the situation is advised.

June 25, 2016

Glorious Rain Shaft at Sunset

Sometimes folks send me pictures that are so beautiful and educational that I want to share them.  Such a picture came my way this week, supplied by Tom Keenan, and taken at the Nisqually Wildlife Refuge north of Olympia on June 20th.  A solstice meteorological treat and Tom did a splendid job in capturing the moment.

Here is an example of the eye candy Tom sent me.  It show a rain shaft falling out of a cumulus cell near sunset.  Just marvelous.  There also appears to be some light rain falling out of the cloud to the left and mostly evaporating before reaching the ground.  This is called virga.


Some folks confuse rain shafts with funnel clouds, but they are completely different animals, with the rain shaft simply a well-defined area of precipitation produced by the relatively small scale convective cloud updraft.

Below cloud base, rain shafts are usually associated with downward air motion (downdraft) due to two reasons:  (1) the falling precipitation drags air downward, (2) if the air below cloud base is not saturated (relative humidity below 100%), then there is evaporation that produces cooling in the rain shaft.  Cool air is more dense than surrounding warmer air and this results in a downward acceleration.

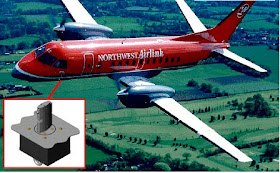
In the right conditions (very high cloud base, heavy precipitation, low relative humidity) such rain shafts can be associated with powerful downbursts that can produce winds of 50-100 mph as the downdraft hits the ground and spreads out.   Such downbursts (also known as microbursts or macrobursts, depending on size) can bring down large jets (see image).


Fortunately, here in the Pacific Northwest we rarely get strong downbursts.  Our cumulus clouds are low based, Northwest cumulus clouds/convection are wimpy, and we rarely have very dry air near the surface.  In contrast, Denver Colorado often has ideal conditions for such dangerous events.

Finally, it is fun to examine the Langley Hill weather radar imager around 9 PM that day (8:58 PM to be exact).  Look carefully near the southern tip of the Sound and you will see the echo from the cell photographed by Tom.


 There won't be a lot of precipitation action during the next week, but when showers return (and they will) keep your eye out for rain shafts, and particularly near sunset when the lighting is ideas to view them.


June 23, 2016

West Coast Contrasts: Cool North/Hot South

The recent weather has been starkly different between the north and southern portions of the West Coast.

Over the Northwest we have experienced weeks of typical June weather:  cool with light moisture. And eastern WA has been cooler than normal with no fires. In contrast, southern CA is burning with temperatures reaching above 100F away from the coast; some unlucky folks are experiencing 115-125F.

Here is the departure from average of the daily temperatures during the past two weeks.   Cooler than normal in the Northwest, particular near and immediately downstream of the Cascade crest.   Warm in southern CA and VERY warm east of the Rockies.


Precipitation?  A bit wetter than normal over much of our region during this period.

One huge difference from last year is the mild conditions over eastern WA.  For example, take a look at Pasco, WA during the past month.   After the warm spell in early June, the cooling hit hard, with many days dropping far below normal...some even near 40F.
Wednesday night brought another cool, wet system to our region, as illustrated by the regional radar imagery at 10:30 AM.   No need to water tomorrow.


In fact, the 72hr precipitation total forecast by the WRF model is impressive (see below_, with some portions of the Cascades and Olympics getting 1-2 inches.  Good for water supplies and good for reducing the fire risk further.


June 21, 2016

U.S. Numerical Weather Prediction is Falling Further Behind: What is Wrong and How Can It Be Fixed Quickly?

Updated (see addition at the end)

It is a disappointing.  The U.S. has the largest meteorological community in the world and led the development of numerical weather prediction for decades.  The National Weather Service, stung by its relatively poor performance on Hurricane Sandy and publicity about inferior computers, was given tens of millions of dollars to purchase a world-class weather prediction system and to support forecast model development.

But the latest forecast statistics reveal an unfortunate truth:  U.S. operational weather prediction, located in NOAA's National Weather Service (NWS), is progressively falling behind the leaders in the field.  Even worse, a private sector firm, using the National Weather Service's own global model, is producing superior forecasts.

Something is very wrong and this blog will analyze why NWS global models are losing the race and what can be done to turn this around.  As I will show, this situation could be greatly improved within a year, but to do so will require leadership, innovation, and a willingness to partner with others in new ways.  I will also highlight a critical NOAA/NWS decision that will be made in the next several weeks, one that will decide the future of US weather forecasting for decades.

The Problem

       A number of media reports and several of my blogs have described the fact that U.S. numerical weather prediction (NWP) has fallen behind other nations and is a shadow of what this nation is capable of.   Global NWP is the foundation of all weather forecasts, so it is critical to get this right.  As we will see, it is not that U.S. global NWP is getting less skillful, but that other nations are innovating and pushing ahead faster.

For most of the last few years, U.S. operational global weather prediction, completed at the National Weather Service's Environmental Modeling Center (EMC) of NCEP (National Centers for Environmental Prediction), has been in third place:  behind the world leader ECMWF (European Center For Medium Range Weather Forecasting) and the UKMET Office (the Brits).    During the past several months, we have fallen further behind ECMWF and, to add insult to injury, the Canadians (the Canadian Meteorological Center, CMC) have moved ahead of us as well.  US global weather prediction is now in fourth place, with substantial negative implications for our country.   Let me demonstrate this to you.

One measure of forecast skill is anomaly correlation (AC), a measure of how well a forecast matches observations (it ranges up to 1, the best).  Below is the AC for the Northern Hemisphere for the day 5 forecast, evaluated at the mid-troposphere (500 hPa, around 18,000 ft).

The ECMWF is the best (red triangles), with the UKM (yellow) second best.  Black is the US global model (GFS).  Note that the US GFS not only has generally lower skill, but sometimes has serious dropouts, periods of MUCH worse skill.  The legend has summary numbers for the period, showing that the GFS is in fourth place, and the Canadians in third place (light green).  These statistics are from a NOAA/NWS website.


Let's compare this to the situation a year ago. Last June's statistics for the 5-day, Northern Hemisphere forecasts are shown below.  We were ahead of the Canadians then.  Look closely and you will see that difference between the US and ECWMF was less.  I could show you many more plots like this that demonstrates that the US has fallen behind the leaders in global weather modeling.


During the past few months both the US and ECMWF upgraded their global models, but clearly the ECMWF upgrade was more effective, with ECMWF pulling further ahead.

A more detailed comparison (from WeatherBell analytics) of the US and ECWMF performance for 2016 is shown below (still 5 day forecast at 500 hPa) using the same verification measure (anomaly correlation).

ECMWF (blue color) is better nearly every day.   Importantly, the ECWMF forecast is much more consistent, without the frequent (and substantial) drop outs of the US GFS.  The U.S. (red colors) frequently declines to .8 or below,  indicating of periods of large declines in skill.  These are serious failure periods.


The bottom line is that Europeans and Canadians are pulling ahead of the U.S. National Weather Service in global weather prediction. I have a LOT more statistics to back this up if anyone has any doubts.

But it is worse than that.   A private sector firm, Panasonic, has gone into the global weather prediction business using the US global model (GFS) as a starting point.   Panasonic scientists have worked on fixing some of the obvious weaknesses in the U.S. modeling system and report they have dramatically improved the forecasts over National Weather Service performance (GFS model).  They claim that their forecasts are not only better than the official US GFS model, but nearly equal to that of the vaunted ECMWF.


I have talked to the chief scientist at Panasonic, Neil Jacobs, and he has shared some of the verification statistics, which look good.  I told him the only way to prove that they have the world's best global model would be to share the forecasts and let a neutral third party verify them.  He agreed to do so, including sharing the forecasts with the University of Washington.   I doubt he would do that if their forecasts weren't as skillful as they claim.

Even worse?  The US Air Force has abandoned the US GFS model, saying that it was inferior to the UKMET office model, which the AF will switch to.

So the National Weather Service's global model is falling behind international leaders AND a private sector firm starting with the same NWS model.  Even the US military is abandoning it.   Can it get any worse?

It can.  The U.S. Congress gave the National Weather Service tens of millions of dollars for superb new computers, two CRAY XC-40s: one used for operations, and the other for development and backup.   Unfortunately, the operational computer is only being lightly used, with its vast capacity not being applied effectively to make critically needed improvements in U.S. NWP.


Key Deficiencies in U.S. Global Modeling

So why is US operational global weather prediction falling behind the leaders? Some of the problems with U.S. global weather predictions are well known and the essential "fixes" effected by Panasonic are no secret (and Panasonic should be commended for letting the community know what they are doing).  To list only a few:

1.   The National Weather Service GFS has starkly inferior physics, which means the descriptions of essential physical processes in the atmosphere.  For example, the GFS model is using a primitive, two-decades old microphysics scheme (the software describing how clouds and precipitation work).  As a result, there are serious errors in precipitation amounts and clouds, which in turn influences the evolution of the forecasts.

They are also using a very old and primitive cumulus parameterization, which describes the impacts of cumulus clouds and thunderstorms (called convection).
This results in poor prediction of convection, including critical features in the tropics (like the Madden Julian Oscillation, MJO), which in turn undermines extended range forecasts.

A plot of precipitation rate versus time and longitude for a portion of the western tropical Pacific (5N to 5S) for a two week period in April to early May 2016.  Above the line are observations, and below the line is the US GFS model.  Note how the character of the precipitation radically changes after the switch to the model.  The model is doing a very poor job forecasting the character, amplitude, and movement of convection in the tropics.  The ECMWF model is far better because they use a better cumulus parameterization (image courtesy of Michael Ventrice, the Weather Company, and University of Albany).

Importantly, the National Weather Service has few people working on model physics and no strategic plan how to improve it.  Other centers (like ECMWF) have put great emphasis on physics and substantial scientific resources.  Furthermore, the NWS has not entrained the expertise of the large US research community to help.

2.   The National Weather Service has less model resolution that its competitors.    The high-resolution ECWMF model has a grid spacing of 9 km compared to the 13 km used by the US GFS. More importantly, the ECMWF global ensemble system has TWICE the resolution of the American system (18 km grid spacing for ECMWF, 35 km for the US GFS).  Ensemble systems play a critical role in data assimilation and probabilistic prediction.  Considering the new computers acquired by the National Weather Service, this resolution gap is inexcusable.


3.  The ECMWF, UKMET Office, and Panasonic have far superior quality control of observations.  Quality control reduces the amount of bad data used in the forecast processes.

4.  ECMWF, UKMET, and the Canadians use a superior data assimilation system called 4DVAR.  Data assimilation uses observations and the model to produce the best possible initial state (the initialization) for the forecast.  Better initial states produce better forecasts.   ECWMF has been using 4DVAR since 1997.

5.  The other leading weather modeling centers use a greater range and volume of observations in their data assimilation systems.  ECWMF, for example, has applied a far greater range of satellite observations than the US, and Panasonic has great volumes of aircraft data (called TAMDAR), that the National Weather Service has been unwilling to purchase.

6.  The other major weather forecasting centers have detailed strategic plans and visions of their future directions.   The National Weather Service has no real strategic plan for global weather prediction.  Or any weather prediction.  Recently, they began a process to acquire their next generation global model (called NGGPS, Next Generation Global Prediction System), something I will talk more about below.
TAMDAR data on short-haul aircraft, collected by Panasonic, can enhance the quality of forecasts.

7.  Other major centers have entrained the help of the research community in an effective way.  The National Weather Service, until very recently, was isolated and had a go-it-alone attitude towards global weather prediction.  Even today, they have no rational, organized way to encourage and reap the benefits of academic community research.  Trust me, this is something I know about.

8. Until last year, the National Weather Service had starkly inferior computing resources compared to ECMWF, UKMET, and other major centers.  It provided an excuse for NWS prediction being second rate.  Today, the National Weather Service has first class computing and Congress wants to keep it that way.  So that excuse is gone.  The National Weather Service has the computing power to push forward rapidly and innovate, if it has the will to do so.

The Big Decision:  The New NWS Global Model--MPAS or FV3?

The National Weather Service is about to make a critical decision regarding the replacement of its out-of-date GFS global weather prediction model.  And this decision is a huge one, deciding the fate of US global weather prediction for the next several decades.

As noted above, this decision is  part of a process called NGGPS and has been an attempt to rationally decide on the guts of the next US global model, something called its dynamical core.  After testing a number of candidates, the choice is down to two.

The first is the MPAS model, developed by the National Center for Atmospheric Research, a consortium of US universities involved in atmospheric research.  The second is the FV-3 model developed by the NOAA/NWS GFDL laboratory.   As I have described in a previous blog, the clear choice is MPAS for many reasons.


MPAS uses an innovative geometry (hexagonal grid) that solves age-old model problems at the poles, while FV-3 uses a more traditional grid geometry.  MPAS uses a superior grid structure (the "C" grid) that will produce far better high-resolution predictions than the problematic "D" grid of FV-3.  And moving to high resolution is where global prediction is going.

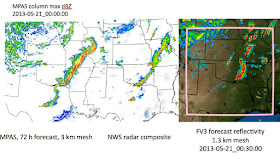
MPAS allows local refinement of resolution without adding additional "nested grids", as shown by the figure below.  And MPAS' superior numerics offer better inherent resolution for a particular grid spacing, so one can run with coarser grids than FV-3 and secure equally good results (which reduces computer demands).

But there is something that goes beyond grids and model numerics.  Something even more important.  By picking MPAS, the National Weather Service will combine efforts with the huge US atmospheric sciences research community, with that community's model innovations (including physics and data assimilation) flowing into the National Weather Service.   The isolation of NWS global prediction efforts would end.  

But it is better than that.  NWS research dollars could then help support global model research efforts that benefit both the operational and research communities.  Other entities, such as the National Science Foundation, would able to help support research and development as well that would, in turn, improve operational skill, and hopefully a resurgent US global model, will bring the Air Force back into the fold.

But it is even better than that.  A regional version of MPAS can be created and eventually replace the current regional model favored by the academic community, WRF, which was also developed at NCAR.  So there is the potential for a national UNIFIED modeling system that could concentrate US weather modeling efforts, producing even more rapid advancement.
FV-3 grid

In contrast, the less innovative FV-3 model was developed by a small group in NOAA/GFDL with little experience in outreach and interaction with the university/research community.  

You would think the global decision is obvious in favor of MPAS, but there are powerful voices inside NOAA that are pushing for an in-house solution.

The final decision on the future NWS global model will be made by Dr. Louis Uccellini, head of the National Weather Service.  It will be one of the most important decisions he makes during his tenure.  One choice, MPAS, will lead to a creative engagement with the US weather research community and the potential for the US to move rapidly into a leadership position in global weather forecasting.  The other, FV-3, will continue and deepen National Weather Service isolation from the US academic community and continued mediocrity in global weather prediction.

In the mean time....

Even if MPAS is selected as the new U.S. global prediction model, it will take several years before the complete system is ready to go operational.  As demonstrated by Panasonic, there are steps that the National Weather Service can take during the next six months to rapidly improve US global weather prediction. If I was the US weather prediction "czar", this is what I would do:

1.  Start using the extraordinary capabilities of the new NOAA/NWS operational computers.

Increase the resolution of the US global ensemble system to 18 km (like ECMWF), increase the number of members to 50-75, and add physics diversity using stochastic physics.   This will greatly improve US data assimilation and probabilistic prediction.

By increasing the resolution and quality of the global ensemble, the NWS can drop the redundant North America/only SREF (Short-Range Ensemble Forecast System), releasing more computer power for useful work.

2.  Fix the obvious physics problems.

Update the model microphysics (moist physics) parameterization to something modern, like the well-regarded Thompson scheme used in WRF.  Replace the old SAS convective scheme as well.


3.   Improve quality control.   

Follow the lead of Panasonic and upgrade the NCEP QC system.

4.  Work with the rest of the atmospheric science community (academia, private sector) to develop a detailed strategic plan for US numerical weather prediction and follow it.

5.  Rework the structure and personnel of EMC, NCEP and NOAA labs to build coherent teams to work on key model issues (such as physics).

Final Comments

Numerical weather prediction is one of the most complex activities done by our species, requiring billions of dollars of hardware, understanding and modeling of physical processes from the microscale to the planetary scale, complex computer science issues, and much more.    World leaders in numerical weather prediction understand this challenge and know that it requires organization, planning, coherence, a long-term view, and innovation.

For too long, the National Weather Service has developed it models in a disorganized ad-hoc way, in isolation from the US research community.   They have learned the hard way that one can not do state-of-the-art weather prediction development and operations that way.

NOAA and the NWS must change the way they do global modeling if they are to provide that nation and the world with the best global weather prediction.  The opportunity and resources are now in place.  The question is whether NOAA/NWS leadership will take the right path.


Important Addendum:  June 22

I disappointed by a NOAA presentation this morning regarding testing between the two global model finalists:  the NOAA/GFDL FV3 and the NCAR MPAS.   I will blog further about this, but a few major points:

1.  NCAR has pulled out because they feel the testing is inappropriate, and I have to agree.
2. All test models had to use the old GFS (current model) physics which are  completely inappropriate at high resolution.  In fact, GFS physics doesn't work well at any resolution.  Like testing new racing cars on a muddy road--you can't do it.
3. The future of global prediction is at convection-allowing resolution (4 km or less grid spacing).   But these resolutions were hardly tested (48 out of the 50 tests were at 13 km grid spacing or more).
4.  Some of the results were clearly bogus, like the radically poor results of a 13-km forecast run and a hurricane simulation that had rain in the eye of the MPAS hurricane).  Something was clearly wrong with the tests.
5.  The testing had no vision of testing a configuration that might be used operationally in ten years (e.g., convection allowing over the globe).  It was all about testing a configuration nearly identical to the current GFS.


June 19, 2016

Perfect Rain

Yesterday we had a rain event that was perfect....just the right amount, just where we wanted it, without too much lightning in the wrong places.

As Goldilocks would say:  "just right"


Here are the 24h precipitation amounts ending 9 AM Sunday, showing all locations where at least .1 inches fell.  Good coverage, with substantial rain getting into eastern WA and particularly the fire-prone northeast Cascades and Okanogan areas.   Good precipitation in the central Cascades to top off water resources for the large population areas. Light precipitation in eastern WA to help agriculture.


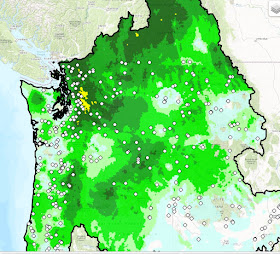
A map of the precipitation over the region from the NOAA/NWS Portland River Forecast Center is shown below.  Great coverage over historical fire areas.  The yellow regions, where more than 1 inch fell,  are associated with a Puget Sound Convergence Zone that formed yesterday afternoon.


Lightning?   As show by the Saturday lightning map. there was plenty of lightning over western WA, but very little over the eastern slopes of the Cascades and northeast WA. Just right. And a few funnel clouds were observed with a few of the stronger thunderstorms cells, but no damage.


Finally, one of the great gifts of our springtime rains are the marvelous rainbows that are sometimes visible.   Here is a picture sent to me of Peter Benda of Bellevue of one of the most spectacular rainbows ever seen in our region.  Magnificent, and he tells me the pictures are nothing compared to reality.  (Notice this is a double rainbow!)


Today, will be dry and I am headed out for a nice Father's Day hike.

June 18, 2016

A Very Different Late Spring (and a Wet Saturday)

Right now (Saturday AM), showers are found over much of the Northwest, with particularly heavy rain along the eastern slopes of the Cascades (see radar)


The latest WSDOT cam shot at Ryegrass Summit near Vantage, says it all.

The current infrared satellite image shows the circulation of a low center west of the northern Oregon coast and an impressive band of clouds over Washington and Oregon.  The frontal band should sweep northward during the day, but showers will follow in its wake.  Sunday should be much drier and warmer--allowing fathers to enjoy some deserved outdoor activity.


But what is striking to me is how different late spring 2016 is from the same time last year, with important implications for wildfire danger and drought issues.  The plots below show temperatures at Seattle Tacoma Airport for the last four weeks, this year and last (since roughly May 20th).   

This year temperatures were very normal, except for the hot spell in late May and early June.  A number of days got to the normal minimum temps.

But last year was very different. Hot periods dominated and most days did not get even near the normal minima.   The warm BLOB of high sea surface temperatures over the eastern Pacific undoubtedly contributed to the later.
  Rainfall?   This year has been dry, but we have gotten about 60% of normal precipitation for this 4-week period.  Last year, maybe 15% of normal.

Why so different?   Last year there was persistent upper level ridging (high pressure) over the West Coast, while this year the high pressure has moved over the central Pacific (and the interior of North America), leaving a trough (low pressure) over the northern and central West Coast.   Let me show you the forecast upper level maps (500 hPa) for today (11 AM), Monday, and Friday.  

You notice the similarity?  Troughing over our region.


The ending of El Nino has led to a substantial reorganization of the atmospheric circulation, and it appears that this change will persist at least through the end of this week.   The fact that eastern WA is getting a good wetting in mid June will push any potential fire season into the future, which is good.  Cooler weather has greatly reduced water demand.

So the rain is good news, except for one group:  the nude bicyclists that are expected at Seattle's Solstice parade today.  Waterproof body paint is recommended.

June 16, 2016

The Seattle Rain Shadow

During the past few weeks it has been strangely dry around Seattle and central Puget Sound.  Rain comes in off the coast, hits the south Sound and north Sound.  Hits the Cascades to our east.  But leaves Seattle and vicinity weirdly dry.  Several of you have commented about it on this blog or sent me emails.

Has Seattle really been so dry?  And if so why?

Well, it is true.  It has arid within sight of the Space Needle.

Plot the precipitation for the 24h period ending at 6 AM Wed. morning and you can see the pattern...a few hundredths of an inch or nothing in the central Sound, but lots more to the north, south and east.


The radar-based totals from Seattle RainWatch for the same period shows  a similar pattern.


The NOAA/NWS River Forecast Center rainfall total for Tuesday shows the precipitation hole as well.

Impressively, the high-resolution (1.3 km grid spacing) UW WRF model even predicted the :Seattle dry hole" a day before (the map below shows the 24h total precipitation ending 5 AM Wednesday).


And this crazy pattern has been very persistent!  Here is the 14-day precipitation totals:  the central Puget Sound area has been superdry!  My poor plants really needed some serious watering and my grass is turning yellow.


But why so dry around Seattle?  Blame it on the Olympics---we have been in the Olympic rain shadow.

I have talked about rain shadows a lot in the blog and particularly how air dries out as it descends on the lee side of barrier.

During the winter, the winds approaching the Olympics are typically from the south to southwest, producing a rain shadow over the Sequim or Port Townsend.    But this time of the year the coastal winds often rotate into a more westerly direction as high pressure builds over the eastern Pacific.  Westerly winds (from the west) cause the downslope flow and drying to rotate to over central Puget Sound.


To illustrate the current situation, here is a weather map for 850 hPa  (around 5000 ft) on Tuesday at 2 PM, showing winds and heights.   Winds are nearly westerly.

This time of the year rain shadows over Seattle and central Puget Sound are not unusual.  June can be cloudy and cool, but it is rarely very wet around the Seattle Metro area and to its west.  The lawn knows: