This blog discusses current weather, weather prediction, climate issues, and current events
April 23, 2013
The Banana Belt of Brookings, Oregon
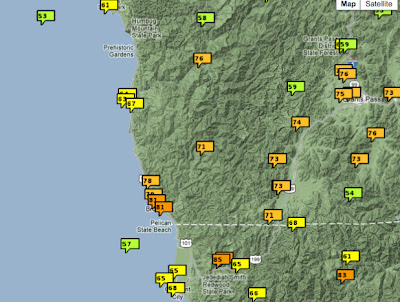
The Pacific Northwest has lots of weather oddities and one of my favorites occurred yesterday at Brookings, Oregon, located on the southern coast of Oregon. Here are the high temperatures yesterday (Monday) over the Northwest from a National Weather Service summary chart. Lots of 60s, but wait! ON THE COAST, right near the California border temperatures jumped to 80F, while temperatures were in the 60s to the north and south! To an experienced NW weather watcher this means only one thing: the "Brooking's Effect" has again revealed its power. There is a reason this area is called the "Banana Belt" of southern Oregon!
A closer-in view reveals more detail (see below). Low 80s in Brookings and 60s to the north and south along the coast. 70s inland. What is the origin of this weird effect, one that can brings 70s or higher to the coast near Brookings during ANY MONTH OF THE YEAR?
To understand what is going on, we must start with a terrain map (see below). There is something unique and special about Brookings: it is just west of the one location along the coast where high terrain extends all the way from the coast to way inland (known as the Klamath Mountains/Siskiyous). It also is a place where the coast is oriented SE-NW.
In situations where the winds are from the east or northeast, air descends the terrain east of Brookings and is compressed as it moves downward. Compression results in warming. We know this was happening for many reasons, including the availability of a radiosonde (balloon-lofted weather instrument) upstream at Medford (see below). This figure show temperature, dew point, and winds from the surface to roughly 10,000 ft (700 is pressure in hPa). We can see the easterly and northeasterly flow through the layer.
We can also examine the sea level pressure, surface winds, and lower atmosphere temperatures...in this case at 2 PM on Monday using the WRF model forecast (see graphic). There is a trough of low pressure extending northward into western Oregon, with easterly flow over its northern portions.
We can view the surface temperature forecast from the WRF model (4km resolution), which shows the whiter (warmer) colors near Brookings and the NE flow near the surface.
Offshore, descending flow not only brings warmth, but very low humidities. The plot (right panel) below shows that the relative humidity dropped to approximately 10% during the warmest period. This is because the air was warm (so it could hold lot of water vapor) and because the dew point dropped in the downslope flow.
One final curiosity...while the minimum temperature last night at Brookings was 62, while at Burns in eastern Oregon it dropped to 13F. Nice to live in a region with some contrasts.
Subscribe to:
Post Comments (Atom)
Are Eastern Pacific Cyclones Become More Frequent or Stronger?
During the past three days, I have received several calls from media folks asking the same question: Are storms like this week's &quo...

-
Mother Nature seems to have forgotten about the current strong El Nino and the record warmth of the past month. Massive snow will fall over ...
-
The latest model forecasts are consistent: an unusually powerful storm with extreme low pressure will develop rapidly offshore on Monday a...


Cliff, I noticed that there was a 86 in northern CA as well on the maps. Is that a mis-reading or is there another hot spot there?
ReplyDeleteHi,
ReplyDeleteThis, I believe, is the exact same effect that creates the sundowners in Santa Barbara, CA. The mountains and coast are orients NW to SE with mountains up to 3-4k feet right along the coast. This effect fueled the devastating fires of 1991.
Paul