October 31, 2012

Notable Precipitation Totals

Some impressive rain totals the past 24 hours, with nearly five inches along the SE side of the Olympics and 3+ along the Olympic windward slopes and the western side of the north Cascades.  At the same time Port Townsend received 0.06 and Ellensburg .02.   Enough to make you a believer in the profound rain shadows we have around here.


As shown by this table from the National Weather Service, some locations on the windward side of the Olympics got 7.5-9 inches during the past 72 hr.   Wet season has begun.

 The precipitation totals for Seattle Rainwatch indicates large contrasts over Puget Sound country during the last 48 hr, with the Kitsap getting hammered with 3-4 inches, and heavy rain extending northeast to north Seattle. The radar blockage by the Olympics is profound, with other blockage over the north Cascades.

After a few more days of rain it looks like we are heading into a relatively dry spell:  here is the latest 8-10 day forecast from the Climate Prediction Center.


October 30, 2012

The Northwest "Drought" Erased

It wasn't very long ago that the main topic of meteorological discussion was the nearly three-month dry spell.  Folks were getting antsy without clouds and rain, and some worried we would run out of water.

Well, worry no longer.   In two weeks we have made up virtually the entire deficit and are now being hit by a modest atmospheric river.

 First, take a look at a plot of the actual (red) and normal (blue) precipitation for the past 12 weeks at Sea-Tac Airport and Pasco.  On October 15th, both locations (and essentially the whole region) was way dry, but during the last 1.5 weeks the skies have opened, with nearly 5 inches at Sea Tac and 1 inch over the desert of Pasco.
We are now getting the heaviest precipitation yet, as a plume of subtropical moisture...a.k.a., an atmospheric river.. extends over our region (see graphic).  This image shows the amount of water vapor in a column of air (actually a forecast for 2 PM this afternoon) with whites and blues indicating the highest values. 

Such rivers have substantial amounts of rain with them, but when they ascend our regional mountains the precipitation rate is increased immensely.  Here is the precipitation forecast for the 24 hours ending at 5 AM tomorrow morning.  Lots of the area will get 1.5-2.5 inches, with the mountains receiving 2-5 inches. 

Over the next 72 hr (see below), some windward slopes will be getting 5-10 inches--roughly the same as some of the locations back east endured from Hurricane Sandy (graphic).

With all this precipitation some local rivers are either at flood stage or soon will be (see graphic from the NW River Forecast Center).  Red dots indicate flood levels.


Want to see something neat that we could never view before a year ago?

Here is the one-hour rainfall ending 5:02 PM from the Langley Hill coastal radar.  You can see the profound enhancement by the Olympics, with light rain offshore (few hundredths of an inch) to roughly .6 inches in an hour over the mountain slopes.


 And would you like to see the most classic Olympic Mountain rainshadow you will ever see?  Then examine this recent radar image from the Camano Island radar.  Pouring all over the region, BUT NO RAIN from Sequim to northern Whidbey Island.  Nothing. You can see why a lot of folks retire in Sequim and Port Townsend.


 I have a lot to say regarding the post-mortem for Sandy, but I think my profession did a very good job in this case (so we don't have to worry about being arrested in Italy hopefully!).  .

But we can do even better. USATODAY had a good editorial on the subject (found here).

In Italy, they convict forecasters that get the forecast wrong

October 28, 2012

Hurricane Sandy's Transformation

A lot has been said of the severe damage that may accompany Hurricane Sandy---10-20 inches of precipitation west and southwest of the storm, coastal wind gusts exceeding 80 mph, severe damage to barrier beaches, flooding over western L.I. sound and other vulnerable locations.  The threat is great and imminent.

But what has not been discussed in depth is the extraordinary transformation that will occur as Sandy makes landfall and moves inland....from a tropical to an extratropical storm, the first with a warm core and the latter with a cold core.  I will talk about that here.

Right now Hurricane Sandy is almost exactly one day from landfall on New Jersey.  It possesses sustained winds of 75 mph and a central pressure of 950 hPa, and is very large storm and will expand even more.  Here is a recent infrared image, showing the band of moisture feeding into the center of the storm.


As I have mentioned before, hurricanes and tropical storms derive their energy from the warmth and moisture of warm oceans, and Sandy is no exception.  Such tropical storms are warm-core systems, with the warmest air in their centers.  In general, tropical storms are not found in regions with large horizontal changes in temperature.

 Recently, there has been a substantial warm anomaly of the sea surface temperature (SST) of the western Atlantic (SST much warmer than normal), which helps tropical systems like Sandy move northward and stay strong longer than normal.  Here is a recent map showing the SST anomaly:  much warmer than normal along the path of Sandy, by over 1.5C!  So a very attractive welcome mat had been laid for tropical storms over the western Atlantic.


Now midlatitude or extratropical storms get their energy not from warm oceans, but rather horizontal temperature changes---generally warmer to the south, cooler to the north.  It turns out that the temperature changes on our planet are concentrated in the midlatitudes...and this temperature gradient fuels nearly all of the storms we experience in the winter.  Midlatitude storms tend to be cold-core, with the coolest temperatures in their center.

Sometimes a tropical storm moves northward and undergoes an amazing transformation, from a warm core tropical system to a cold-core extratropical system, and switches its energy supply from the warmth and moisture of a tropical ocean to the temperature gradients of the midlatitudes.  This is called Extratropical Transition (ET) in the business.

Sandy is about to go through the transformation.

Let me show you.  The figures below show you the temperatures and pressure pattern (actually heights of the 850 hPa pressure surface) at around 5000 ft above sea level for three times (Monday morning, Monday evening, and Tuesday morning--Seattle Time).  At the initial time there is warm air at the center of the storm (the dark orange color).  Fairly symmetric structure (which is typical of tropical systems).


By tomorrow evening, just as the storm is making landfall,  the warm core is fading, and temperature structure is becoming much more asymmetric.

 By Tuesday morning, the transformation is complete....cold air has reached the center of the storm and the warmest air is found far to the east of the center


Many tropical storms weaken when they go through this transition, but for a small subset the opposite occurs.   The two energy sources work synergistically for a while, resulting in an strengthening and expanding system....such is the forecast fate of Sandy.

In fact, during this transition stage, Sandy will continue to intensity until it makes landfall.  Here is the latest forecast from the NWS NAM model:

956 hPa low center at 2 AM Monday morning (PDT)


12 hours later 948 hPa pressure (2 PM Seattle Time).


My next blog will take a look at the scorecard for this storm....and return to talking about Northwest weather.  And there is a lot to talk about, including an atmospheric river situation setting up and 5-10 inches forecast over the next 72 hr over NW mountains.


October 26, 2012

A More Perfect Storm Will Strike the Midlatlantic Coast

There is now a high probability that an historic storm will strike the mid-Atlantic states next week.  

A storm far more intense than the Perfect Storm, of book and movie fame.

One of the most intense landfalling cyclones in several years and perhaps the equal of the great Columbus Day Storm of 1962 that brought 100 mph plus winds to large swaths of the Pacific Northwest.

The storm that will strike the East Coast early next week is eerily like the Columbus Day Storm and the famous Perfect Storm in several ways.  Each of these started as a typhoon or hurricane and  transitioned into a powerful midlatitude cyclone, undergoing what we call extratropical transition.

As I will describe below, although there is still some uncertainty, the major modeling systems, American and European, have now locked on to a very similar solution.

Hurricane Sandy is now a Category 1 storm with sustained winds about 75 mph and a central pressure of 971 hPa.  Now located just north of the Bahamas and still over warm water.

At the same time, an upper level trough is approaching from the west and the interactions between the two will cause Sandy to morph into a hybrid storm, expand,  and intensify rapidly.  The National Weather Service is doing something very rare:  adding more radionsonde (weather balloon) launches (four times a day instead of twice day)...a very wise investment.

This figure shows the situation on Saturday, showing the upper trough over land (red line) and an upper low over Sandy (purple circle) (the figure is for 500 hPa--about 18,000 ft above sea level).  These will join up during the next few days.

Sandy will not only grow larger, but the pressure will fall, and the winds will increase.  Perhaps the most dramatic description of this process (but not technically quite accurate) was given by a supposed meteorologists in the Perfect Storm movie, click on the picture to view it:

Click to see video
Until recently, two of our most important models (the European Center model and the U.S. GFS) were substantially at odds, with the European model taking the storm into Maryland/Delaware and the U.S. model taking the storm out to sea.   In more recent runs, the U.S. high resolution model began recurving the storm back to the East Coast, first over New England and now across Long Island, with the European Center model not changing very much.

But now European Center model has moved northward, the GFS model swings inland earlier, so the differences have diminished.

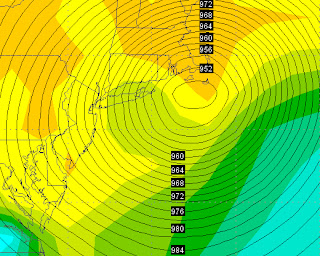
Lets talk a look.  First the U.S. GFS.  Here is a series of surface pressure analyses from this morning's run (solid line are sea level pressure and shading is relative humidity.  A very deep low moves in off the ocean at 8 PM PDT Monday with a pressure of around 950 hPa (the Columbus Day Storm was about 960 hPA), then swings in over Long Island on Tuesday morning, then moves in a circle just inland, and eventually moves northward on Wednesday.  This is extraordinary behavior--to have a deep low just circle about for a day, before heading out of the region.  And deadly.


The winds would be very strong and damaging...sustained winds of 50-70 knots over the water with higher gusts.  Here is the wind forecast at 2 PM on Tuesday morning.  Winds are in knots (see legend).  Lots of sustained winds above 50 knots over the Atlantic and some coastal locations.

 What about the European Center forecasts?  A sub-940 hPa low makes landfall on central New Jersey, circles around, and then moves northward.  The European Center and GFS models tend to overdo the deepening in this situations, so I don't believe we will see anything below 950-960 hPa.


We are talking about huge events, if either of these forecasts are correct--or if the truth is somewhere in between.  Heavy rain, powerful winds over a long period, storm surges north of the low center.   This will make the Perfect Storm look like a zephyr.  Take a look at the cumulative rainfall through October 31st at 11 PM PDT.  5-10 inches over New Jersey and adjacent areas.  And this is a relatively coarse model....could well be more at some locations.  Cascade Mountains do almost as well!


Is there still uncertainty now that the major models are converging?  You bet.  There is some probability that the real storm will moves out to sea.  To get a handle on this, lets take a look at the last European ensemble prediction (left panel below) and the their high-resolution forecast (right panel) for 5 AM PDT on Tuesday.   The shading is a measure of uncertainty...how much the ensemble members disagree.

The high resolution forecast shows a huge, powerful storm making landfall.  Importantly, the ensemble (the mean of many different forecasts) show a low center at a similar position, perhaps a bit farther north.  This provides some confidence in the high-res forecast.  But the shading shows there is considerable uncertainty still, with the shading offshore suggesting a few of the forecasts were for a low farther offshore.  So, this is not 100% now...but a very good bet at this point.

 I think you can appreciate the technology...high resolution forecasts show us some possibilities, with ensemble prediction giving us a measure of the uncertainty in the forecasts.  No forecast is complete without a quantification of the uncertainty.  Nothing is 100%.   And certainly not a complex, sensitive situation like this one.

October 24, 2012

Will Hurricane Sandy Make Landfall on the Northeast U.S.?

We have a fascinating and potentially dangerous situation on hand for the Northeast U.S. and one possessing considerable uncertainty.

Sandy is now a category 1 hurricane with estimated maximum sustained winds of 85 mph and central pressure of 970 hPa (see picture).  My community is all aflutter about this storm, particularly since our forecast models are not in agreement--some suggest the storm will intensify and head straight in to the Middle Atlantic coastline, some take it out to sea, and others move it out to sea before swinging it westward to hit New England or the Canadian maritimes.
Hurricane Sandy is not well formed at this time
Such uncertainty is not unusual under the present circumstances:  we have a storm that will undergo what we call extratropical transition as it moves northward (changing energy sources in the process) and interacts with the stronger flow and temperature gradients of the midlatitudes.  Very complex interactions that greatly reduce predictability.

 Let me illustrate.

First, lets start with the gold standard.  The best hurricane prediction system is embarrassingly not American, but the European Center (ECMWF) high-resolution global model (note to U.S. Congressmen and Senators--you folks need to attend to this issue!).   A model that has the equivalent of 15-km grid spacing over the entire planet.

You will not believe the forecast.  Here is the sea level pressure analysis (solid lines, the shading is relative humidity) as the storm makes landfall along the Delaware coast.  A 940 hPa low! That is very low.


And here is the associated wind field--sustained 50 kts plus over the ocean.


If this were true there would be major coastal damage.  Most models tend to overdo such systems, but still, a huge threat.

But this is 2012 and we can do a lot better than a single "deterministic" forecast....there is plenty of uncertainty in the forecasts and one way we deal with that is with ensemble forecasts..running the model many times, starting a bit differently or with varying physics (e.g., different ways of describing clouds, precipitation, and the like).  Ensembles are run with less resolution than the single high-resolution forecast shown above.

 Here is the sea level pressure output from the ECMWF ensemble mean (the average of all the simulations) on the left side (solid lines) and the single high-res forecast on the right, both for 5 AM PDT on Monday, 29 October.  The ensemble mean is a bit washed out (we are averaging the pressures of many runs and those diffusing things a bit), and the lowest mean pressure somewhat offshore of the high-res run.  The color shading indicates that thelevel of uncertainty, based on the differences between the ensemble runs,  is considerable. 

Here is the same figure for 24 h later (Tuesday morning).  The ensemble mean (left side) low center is making landfall on New England, but there is a lot of uncertainty.  Clearly most of the ensembles are making landfall, but some forecast lows stay out to sea.   The bottom line:  a real threat, but it is not nearly 100%.


What about the American model, the GFS?  Statistics show it is now tied for number two with the UKMET office model.  Our high-res version (resolution about 25 km) does something very different (see graphics showing sea level pressure--black lines, and precipitation--shading).  The storm stays offshore for a long time, bypassing the central Atlantic states and then swings towards the Canadian Maritime Provinces.
Saturday, 11 AM PDT
Monday 11 PM PDT

Wednesday 2 PM PDT
The East Coast is safe?   Don't be so sure.  Let's check the U.S. global ensemble (much coarser than the European Center, unfortunately) at 5 AM on Tuesday..   The solid line is the mean (or average) pressure and the colors indicate uncertainty--orange is the most uncertain--where the simulations disagree the most. Wow...HUGE uncertainty.  Some solutions are taking the storm into the mid-Atlantic states like the European Center model, while others are heading the storm offshore.

Add caption
Here is the ensemble mean and uncertainty the next day. The ensemble mean makes landfall on the U.S.:  many solutions are hitting the NE states, but some move offshore (like our single high-res solution).


 By the way, what other famous storm started as a tropical storm, headed out to sea and then turned westward towards New England at almost exactly the same time of the year?   Answer:  The 1991 Halloween Storm....a.k.a. the Perfect Storm of book and movie fame.

So what do you come away with from all this?  First, you know what it is like to be a meteorologist in a real-world, very serious situation.  There is the potential for substantial loss of life, damage, and disruption.  Large costs to protect assets.  What would you recommend?  This is why meteorologists make the big bucks (right!).

Our models..both high res and ensembles..indicate there is a real threat to the U.S., from roughly Virginia to New England.  Folks in that region should pay close attention to the forecasts--which will get more certain as we get closer to landfall.  Not too soon to think about preparation.  There is still considerable uncertainty--and next week we could see anything from a catastrophic storm to nothing.  There is considerable chance of a serious landfall since our best model is going that way and BOTH U.S. and ECMWF ensemble systems showing a considerable number of forecasts with that solution.

There are many things I have not discussed here...how the tropical storm interacts with the midlatitude winds and why that produces uncertain forecasts...that will have to be for another time.   And yes, it is going to rain in Seattle this weekend.

October 22, 2012

A Faltering El Nino

The difference between a strong El Nino winter and a neutral winter (neither El Nino nor La Nina) can be a large one.

Strong El Nino winters are generally warmer and drier than normal. Less big storms.  Considerably less snowpack in the Cascades and little, if any, snow in the lowlands.

Neutral winters bring "normal" weather and have a bit of a twist:  the biggest storms--the greatest floods, windstorms, snowstorms--when they happen (which is rare), tend to occur in neutral years.  Years that Seattle mayors need to worry about, as should the keepers of the 520 bridge.  Buckle your meteorological seatbelts--its looks like a neutral winter is coming our way.

As many of you know, the signs late last summer were for an El Nino, albeit a modest one.  But after a period of intensification, this El Nino has run out of steam and the current model forecasts (which are more accurate now because we are so close in time) suggest a neutral year.

Here is the latest record of the sea surface temperature anomaly (the difference from normal) for a region in the tropical Pacific (the Nino 3.4 area shown in the map below).   The official definition of a neutral year is when the anomaly is within .5C of normal.   Currently is it about .3C warm.  And the real El Nino effects aren't significant until the anomalies are much larger (at least 1C warmer or cooler than normal).   You notice that the warm anomaly increased significantly in June-early September and then plummeted.


Unusual sea surface temperatures cause changes in the atmospheric circulation and particularly the trade winds (the easterly tropical trades weaken during El Nino years).  Right now they are near normal.  What about the warmth of the upper portion of the oceans?   As shown here, it has dropped recently.


So what about our fancy computer models?   Well, the National Weather Service key tool is its coupled ocean atmosphere global model (CFS 2) ensemble.   Here is the output.  Predicting neutral conditions and no El Nino (temperature anomalies of the Pacific ocean 3.4 area are small).


And there are a variety of U.S. and international models that indicate either a weak El Nino or neutral conditions:


Folks...the cards are stack AGAINST our friend El Nino, with wily gamblers going for that wild kid, El Neutral (or La Nada).

So I told you earlier that although it is no sure thing, the biggest of the biggest storms of all kinds like neutral years.  Here is an example for windstorms (this is from a figure in my Northwest Weather book.  The red squares indicate a major windstorm year (like the 1962 Columbus Day Storm or the 1993 Inauguration Day Storm).  All of them are associated with temperature anomalies in the tropical Pacific between plus or minus one.  This year will be in that range!


I could show you a similar figure for floods or snowstorms, but that would only scare you.  And bring chills to the spine of Seattle mayors past and present.  Importantly, it is ok to get that season lift ticket pass for Stevens, Snoqualmie, or Crystal.

We might well escape a big storm, but in light of the above information it would pay to be ready.  Flashlights, extra supplies, etc.  I would have recommended getting a Subaru Outback (and was thinking of getting one myself), but they have run a series of insulting advertisements about weathermen. 

P.S.  I would like to thank those that contributed to my fund recently (upper right column or here).  I used the funds to pay for the room charges of the recent Columbus Day Storm gathering in Kane Hall and purchase a replacement disk server for our real-time weather predictions.  I also hope to give another undergraduate scholarship this year.


October 20, 2012

Funnel and Waterspout Seen Near Everett

A dramatic series of pictures have been reaching the web and sent to me of a waterspout/funnel cloud over and near Hat Island, located between Everett and Whidbey Island (see map).

Here are some amazing shots of a relatively unusual phenomenon around here (this may not be Oklahoma, but every year we get a few).  In the first, you can clearly see a beautiful waterspout that is sucking up water off the surface.

Courtesy Sharon Wandler and KING-5
 Here is a shot on the Scott Sistek Blog site.   There is some evidence of a double vortex (look at water).

Look at these extraordinary images from Chris Evans (you can view and access pictures at his website

Courtesy Chris Evans
If you carefully, there appeared to be three funnels.  And here is a close up of the same image.

These funnels were associated with a fairly strong convective cell that was apparent in the Camano Island radar.  The funnels were seen between 4 and 4:15 PM (2300 and 2315 GMT).  The radar reflectively shows some very strong echos (yellow and reds) near the location in question.


A closer in view. Wow..the red dot looks like the position of the funnel!


The radar provides the tops of the convective cell...looks around 20,000 feet (see image).  High for around here, a joke in Oklahoma.


The atmosphere was modestly unstable today, with small amounts of CAPE (convective available potential energy)--the measure of how much energy a rising parcel can acquired from buoyancy.   Here is the plot for around 2 PM--perhaps a few hundred.  Decent for western Washington, comical in Oklahoma.  Lot of instability offshore as the colder air moves in aloft.

There was no real boundary which could cause horizontal rotation (like a front or shear line), so vertical wind shear (winds increased rapidly aloft), must have led to rotation around a horizontal axis that was redirected into the vertical by the strong updraft in the convective cell.  Sounds complicated I know, but one of the great insights meteorologists gained during the past 30 years was how horizontal rotation (rotation around a vertical axis) can result from wind shear in the vertical.

And look what's back in the mountains:


Should I Let AI Write My Blogs?

I spend a lot of time thinking about and writing my blogs.   Could AI apps do the work for me?   Could any of you tell the difference? Well,...