February 27, 2017

Surprise Snowstorm in Seattle

3:30PM Update
THUNDERSNOW HAS HIT SEATTLE!

As predicted, a strong convergence zone has formed over Puget Sound, producing heavy precipitation and lightning (see radar at 3:30 PM)

The heavy precipitation is driving the freezing/snow levels towards the surface and there is mixed rain/snow here at the UW.  Did you notice how the snow was associated with the heaviest precipitation?

Lightning even hit the Space Needle (see below)


Hopefully, the lightning won't get near the overturned truck on I5 loaded with butane....
____________________

It was quite a surprise for many as heavy snow started falling in Seattle around 6:30 AM this morning.  The National Weather Service did talk about the potential for rain and snow showers, but the this morning the snow was quite substantial with .5-2.5 inches around Seattle and neighboring communities.


What happened?

An area of particularly heavy precipitation that pushed the snow level to sea level.

When I went out to get the newspaper at 6:30 AM it was actually raining, but as the precipitation intensity increased, snow started mixing in, followed by big wet flakes.

The Camano Island radar shows the culprit (see below):  a small area of heavy showers (yellow is moderate intensities).  The precipitation is being enhanced over central Puget Sound due to convergence (air coming together) in the lee of the Olympic Mountains (a weak Puget Sound Convergence Zone).


The freezing level at 5:30 AM was at roughly 1300 ft, but near-freezing temperatures were found down to around 500 ft.    As a rule of thumb, the snow level (the level at which all snow from aloft melts) is roughly 1000 ft below the freezing level.  So we were close,

As the snow aloft melted, it cooled the air below (it takes heat to melt the snow!), causing the freezing and snow level to be pushed lower.  The descending snow level quickly reached the surface, resulting in snow accumulating on grass, building, and even the roads (which were above freezing).  Beautiful big flakes.

Why were the snowflakes so big?   Because at marginal temperatures at or near freezing snowflakes are more "sticky" and they tend to form large aggregates of smaller snowflakes.

Roads should improve and daytime solar heating will ensure that temperatures rise by early afternoon.  But  there are some more showers moving in that could cause some snow showers.   And there is another chance of significant snow later this afternoon as a Puget Sound Convergence Zone forms north of the city (see snowfall forecast for the 3-hr ending 4 PM).  This graphic shows where snow is expected (green/blue colors) and rainfall (gray shades).  Only where the intensities (and thus cooling due to melting) is there snow.  Where light precipitation exists, there is rain.


___________________


The Northwest Weather Workshop

And don't forget...if you want to attend the big weather meeting of the year...the Northwest Weather Workshop on March 3-4 in Seattle...you have to register before.  The agenda and more information (including how to register) is found here: https://www.atmos.washington.edu/pnww/

February 26, 2017

Too Warm

While the passes are getting hammered with snow right now (chains required at Snoqualmie), the lower atmosphere is too warm to get snow down to near sea level.  Snow is being reported at higher stations (e.g., Paine Field in Everett) and over NW Washington, but around Seattle it is nearly all rain.
Peter Benda sent a picture at his house at 1170 feet near Bellevue...about 1.5 inches there.


And you pick up snow on I 90 east of Issaquah.


Light snow around Bellinghan


The snow level is around 400-500 feet now around Puget Sound.

We knew the temperatures were marginal, with the predicted precipitation intensities sufficient to bring the freezing and snow levels down to  a few hundred feet..   However, the precipitation has been lighter and thus the atmosphere stayed warmer near the surface.

The latest radar (7AM) show only light precipitation and the back edge of the front is already crossing the coast.  Just a few light showers offshore and most of those are going to the southeast.


Well,  at least everyone was warned about this possibility.

February 25, 2017

Marginal Lowland Snow, Again.

Folks... this is getting tiring.  Another situation in which lowland temperatures are marginal for snow, making the forecast exquisitely difficult and elevation dependent.  With rapidly increasing day length and strengthening sun, we are almost out of the lowland snow season (which is really over by March 8-10th).

Later tonight and tomorrow morning, an upper level  (500 hPa) trough of low pressure will pass over the Northwest, producing upward motion and precipitation (see forecast map for 10 AM tomorrow).


Associated with the upper trough there will be a surface low, that will be along the Washington coast around 10 AM (see below).   The trouble is that temperatures are not that cold over the region and there is not a good push of cold air out of British Columbia. Marginal for snow near sea level.


But we do have cool air over us now, with the freezing level around 1300 ft (see below).  The snow level is generally about 1000 ft below that, so snow could fall to 300 ft. And precipitation can cool the atmosphere, thus bringing wet snow to sea level if the intensities are large enough.
So  what are the model's saying?  Well, the super high-resolution UW WRF model is predicting a few inches of snowfall away from the water around central Puget Sound by 4 PM Sunday (keep in mind that snow DEPTH would be less). Lots of snow in the Cascades (1-1.5 ft).

The vaunted European Center model for the same period?  Less snow near sea level, with increasing amounts (few inches) towards the Cascade foothills.  Somewhat different details though.
What about the ensemble (many model) forecasts? A lot of uncertainty, with varying amounts.  The ensemble average is about 1.25 inches in Seattle (SeaTac) and 2.00 inches at Paine Field in Everett.


So what is the bottom line?   Precipitation will start tonight around 10PM-midnight and will continue until mid-morning.   Above 400 feet, there will be a few inches of wet snow, increasing with higher elevation.  Below that, it will be a mixed bag.  Perhaps 0-1 inch near sea level, increasing to a few inches as one goes higher.  

But please note there is a lot of uncertainty.  At sea level it could be all rain or you might get 3-4 inches.

Later in the day, temperatures will warm into the 40s with onshore flow behind the low and warming by the sun.  So driving conditions will improve rapidly.

___________________

The Northwest Weather Workshop

And don't forget...if you want to attend the big weather meeting of the year...the Northwest Weather Workshop on March 3-4 in Seattle...you have to register before.  The agenda and more information (including how to register) is found here: https://www.atmos.washington.edu/pnww/

February 23, 2017

Why has California Been Wet and Washington State Cool This Winter

Potential for lowland snow on Sunday--blog around 1:30 PM Saturday

It has been a remarkable winter so far, very different in character from the previous winter seasons.  During the past 90 days, the southwest US, and particularly California and Nevada, have been MUCH wetter than normal.  Some locations have had over 400% of normal precipitation!  Western Washington has been a bit drier than normal.

For temperatures over the same period, Washington and Oregon have been much cooler than normal (particularly east of the Cascade crest), while California close to normal.

So what his interesting north-south pattern and why has it been so persistent?

Well, the proximate cause is easy.  There has been a persistent area of low pressure over the eastern Pacific west of northern California to Washington.  The following figure shows the anomaly (difference from normal) of the height the 500 hPa pressure surface (around 18,000 ft) for the past 90 days.   There is an amazing negative anomaly (purple color) signifying lower than normal heights (or equivalently low pressure).

Storm after storm has brought low heights/pressures along the northern West Coast.

Such a persistent trough or low along the northern West Coast causes the jet stream to be pushed south into California, instead of its normal position coming into the Pacific Northwest  (the jet stream, a current of strong winds tends to follow the outer periphery of the trough).   Troughs are associated with colder than normal air.  So with the jet moving south into California, CA get more precipitation (since the southern of the trough is associated with upward motion), while cold air is found over the Northwest.

But why is the trough found over the northern West Coast?   Good question.  If you look at the pattern of the height anomalies, you will notice a wave-like pattern, with alternating high and low heights.  This pattern is associated with something called Rossby waves in the atmosphere (they are names after a famous meteorologist Carl Gustav Rossby).   Think about throwing a rock into a big pond, with waves radiating away from the rock.


So what is the analog for a rock in the atmosphere?  What is disturbing the atmosphere causing waves to propagate over the Pacific Ocean and north America?

Lots of thunderstorms over the Maritime Continent- places like Borneo, New Guinea, Indonesia, and the adjacent islands.  

Here is a measure of the amount of thunderstorms that we can observe from space--called Outgoing Longwave Radiation  (OLR) for the same 90 day period.  To be more specific, this shows the anomaly (or difference) from normal.  Where values of OLR are low, there are more high clouds from thunderstorms.   You can see a big negative anomaly over the Maritime continent and SE Asia.
Thunderstorm are like rocks to the atmosphere, greatly perturbing the wind, temperature, and humidity fields.   That in turn generates atmospheric waves that can cause localized weather anomalies like we have seen on the West Coast.

But why is there a big thunderstorm anomaly with lots of thunderstorms over SE Asia and the Maritime Continent?    That is probably due to the La Nina of last winter, which wass associated with stronger trade winds that push warm water into the western Pacific.   And why is there La Nina?  Because of a natural oscillation in the tropical Pacific.

Enough questions!  But perhaps there is one more.  Will it snow over the lowlands on Sunday?   The latest model runs suggest some light snow is possible (see snowfall prediction for the 24 ending 4 PM Sunday).  Temperatures are marginal, but where there is some elevation and greater precipitation rates, snow may reach to near sea level.  More on Saturday.


___________________
The Northwest Weather Workshop

And don't forget...if you want to attend the big weather meeting of the year...the Northwest Weather Workshop on March 3-4 in Seattle...you have to register before.  The agenda and more information (including how to register) is found here: https://www.atmos.washington.edu/pnww/

February 21, 2017

La Nina is Dead. Can El Nino Be Far Behind?

I have sad news for all of you.

La Nina is dead.   Done. Finished. Terminated.   The final word came out a week ago, provided by the august U.S. Climate Prediction Center (see below).


And it appear that we have a better than even chance of moving back into the El Nino pattern again, a configuration that leads to generally less snow over the Pacific Northwest.

To track the oscillation between La Nina, Neutral conditions, to El Nino and back again, meteorologists follow the sea surface temperatures (SST) in tropical Pacific.  As I have noted in past blogs, this variation, also called El Nino Southern Oscillation (ENSO), represents a sloshing of the warm water in tropical Pacific.  When the water sloshes towards the east we have El Nino, when it sloshes to the west, La Nina.  You can think of the tropical Pacific as a giant bathtub.

To get a handle on what the sloshing is up to, meteorologists follow the SSTs for a few areas in the tropical Pacific (the Nino 4, Nino 3.4, Nino 3 and Nino 1+2 areas).  The figure below shows their locations.


The general approach is to track the SST anomalies (differences from normal) for these areas, with Nino 3.4 being probably the most popular. When Nino 3.4 has a warm anomaly greater than +.5C we have El Nino, an anomaly of -.5C or less, La Nina.   Near zero, a neutral or La Nada period.

Here are the latest graphs of SST anomalies.  Viewing the Nino 3.4 graph, you can see we had a weak La Nina for a while, but now temperatures are slightly on the warm side---we are in neutral conditions and probably have been for a few months.


What about the future?  The Climate Prediction Center provides a nice graphic of  past and predicted SST anomalies from many different ENSO forecasting systems (see below).   Forget La Nina.  Some of the model stay in neutral territory, but half move toward El Nino.


 The main U.S. seasonal model, CFSv2, is run as an ensemble (many forecasts).  Although there is a lot of uncertainty, most runs are heading towards El Nino.

Digesting all of the this information, the Climate Prediction Center is going for neutral conditions continuing into spring, but equal chances of moving toward El  Nino by midsummer, and a tendency towards El Nino by fall.


 Let me stress that ENSO forecasts made mid-winter have been notoriously bad.  Skill for the upcoming year increases substantially by summer.

One thing you can be sure about:  with our reservoirs in decent shape and a near normal snowpack, the water situation in the NW looks excellent for this summer. And with California soaked this winter and its reservoirs filled, vegetable/fruit prices should be more modest than in past years.


February 19, 2017

More Threatening Weather at the Oroville Dam

11 AM Monday Precipitation Totals

Some of the terrain about the dam has received over 4 inches already.


_____________________________

The latest forecasts are worrying regarding the heavily damaged Oroville Dam in California.  And I am surprised there is to so little talk by CA state officials and the media about the danger.

During the past few days, with little rain and active drainage of water, the dam level has been reduced substantially (see image)

But central California and the Sierra Nevada mountains are about to be hit again...quite hard, with a strong atmospheric river (see moisture plot for 1 AM Monday).  The red and white colors shows high column integrated water vapor values.  Aimed right at the dam.
The forecasts show substantial precipitation with this atmospheric river.  Here is the accumulated precipitation for the 24h period ending 4 PM Monday from the excellent NCAR high-resolution ensemble system (the ensemble mean). 4-8 inches over the Sierra.


But that is the ensemble mean or average.  But there is a chance it could be more, so here is the ensemble maximum, the ensemble member with the highest amount of precipitation.  Much more (30-50% more in some locations)..and a serious problem for Oroville Dam.


The 48h precipitation total ending 4 AM Tuesday from the GFS model projects 5-10 inches in the mountains.

And the European Center model has the same idea, with 5-7 inches


Looking at the NCEP SREF ensemble system at Blue Canyon, about 15 miles away from the dam,  shows an ensemble mean of 7 inches, with a range from 5.5 to 13 inches.  Great confidence for a major rain event.


Hydrological forecasts by the National Weather Service, project a rapid rise of the Feather River, the main feed into the reservoir behind the dam, with the flow quadrupling from around 7.5 thousand cubic feet per second to around 32 thousand.

This is a dangerous situation and, as always, there is uncertainty with our forecasts.  Why is there so little discussion of the rapidly increasing precipitation?
____________

And if you want to read an interesting blog about an unusually strong cold front that hit Hawaii, check this out:

http://hawaiianweather.blogspot.com/2017/02/cold-front-passing-hawaii.html

February 18, 2017

Will Seattle Beat the All-Time February Precipitation Record? Almost Certainly Yes

Sunday morning update:  SEA how has 8.01 inches,  1.10 inches below the record Feb total.
________

People love records.   And precipitation records are falling over the West Coast.

Here is Seattle, the record February precipitation is 9.11 inches, which fell in 1961.

As of midnight, Seattle Tacoma Airport had 7.85 inches so far this month.
Since then, Sea Tac got another .07 inches, so we are now at 7.92 inches or 1.19 inches behind the record.  A plot of actual (red) and average (blue) cumulative precipitation at Seattle shows the story...we are about 6 inches ahead of normal now.

Looking at the forecasts, we have a very good chance exceed this.   For example, here is the precipitation forecasts for Seattle from the European Center ensemble and high-resolution models.  1.3 inches for the ensemble and 1.7 inches for the high resolution forecast.   If true, the record is toast.

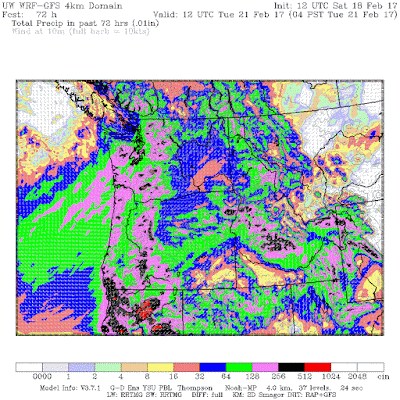
Or the UW WRF forecast for the 72 hr starting at 4 AM this morning. The purple color is more than 1.28 inches.... very close.  And there is more rain after that.

So the chances are very good that a new February rainfall record will be set at Seattle Tacoma Airport and a number of other western WA locations.

All this precipitation has caused our soils to become highly saturated, resulting in mudslides and slope failures, such as the one that closed down I-90 near Issaquah and another that closed I-5 near Woodlawn (see below).


___________

Northwest Weather Workshop:  

The Northwest Weather Workshop, the big annual weather gathering in the Northwest, will take place on March 3-4, 2017 in Seattle (NOAA Sand Point Facility).   Everyone is welcome.  For more information and to register, go to https://www.atmos.washington.edu/pnww/

February 17, 2017

Northwest Weather Hits Southern California with the Most Substantial Storm in Years

Southern California is about to be hit hard with heavy rain of 3-9 inches and powerful winds.  Flooding and slides are inevitable.   But it will have a silver lining:  any talk of drought in California should be ended as the last below-normal reservoirs are filled.

Let's start with the 2-day precipitation totals (ending 4 PM Sunday) from the wonderful NCAR high-resolution ensembles (the ensemble mean--the average of the ten ensemble members are shown). Totals exceeding 3 inches covers a wide area from LA north, with some locations in mountains north of Santa Barbara getting 7-9 inches.  That amount of rain would be huge anywhere, but in dry southern CA that is immense.     For a number of locations, this will be the greatest rain event in years.

The reason southern CA is so wet, while the Northwest is relatively dry, is because the jet stream has been deflected way to the south.  This is illustrated by an upper level forecast map for 4 PM Friday, with the sold lines presenting the heights of the 500 hPa pressure surface (around 18,000 ft).  A deep trough of low heights (pressures) is found along the west coast, with the jet stream/strong winds heading into southern CA.


Equally impressive is the latest infrared satellite image (Friday AM).   A extremely moist frontal band is headed right into the LA Basin, which will bring both heavy rain and strong winds.  There is clearly instability (convection/thunderstorms) embedded in the cloud mass.


The latest radar image from Vandenberg AFB shows extensive moderate rain over the region, with the yellow/orange areas being the most intense.


And now we have the problem--southern CA is ringed by high terrain and as the moist flow climbs the barriers, precipitation intensity is greatly increased (by 5-10 times is not unusual).  This air is relatively unstable, so there is also the risk of thunderstorms with locally intense rainfall.   The result is the potential for flash flooding and slides, with debris-laden regions that have recently burned of particularly concern.  The National Weather Service has a flood warning out for the Santa Barbara area and a flash flood watch extending down the coast. It is not going to be pretty down there.


February 15, 2017

For Some in California, the Worst is Yet to Come

After a few day break, California is about to experience a period of very wet weather, with the potential for flooding and slope failures in southern California and threats to the Oroville dam in the north.   For the 24h ending 8 PM Wednesday, the fire hose has been mainly directed to the Pacific Northwest, with some locations in the Olympics getting 5-7 inches of rain.  But substantial rain (greater than 2 inches) extends into the Cascades and down the coast to northern CA.


Now it is California's turn.  The U.S. GFS model forecast for the next 7 days is amazing, with portions of the Sierra Nevada near the Oroville dam getting 10-20


 inches of rain.  Very bad.  And heavy precipitation will hit southern CA as well, where flood and slide warnings are now in effect (see NWS warning page)


The European Center model precipitation for the same period (shown below) has a similar solution, with as much as 7-9 inches over the Sierra Nevada.

But how much uncertainty is there in this forecast? For Chico, CA (near the Oroville dam at lower elevations), the European Center ensembles (many forecasts) are all on pretty much the same page. (each line in the upper panel  \represents one forecast).  One event starting tomorrow, with the heaviest precipitation on Friday.  Then another event later Sunday and Monday.

The ensembles for Santa Barbara are also in agreement for a big event on Friday, with even heavier precipitation in the mountains.


This could well be the wettest storm of the year in southern California and damaging slides and floods are quite possible.

A Major Cyclone Will Approach Our Coast But Not a Repeat of November 19

A very strong, rapidly developing, midlatitude cyclone will approach the Northwest coast on Friday and move through on Saturday. Fortunately...