March 31, 2019

Rain Returns to a Dry Pacific Northwest

We have just experienced an extraordinarily dry second half of March, one in which weather systems and their accompanying precipitation was directed southward into California.

Well, all good things have to come to an end, and for us the spigot will be turned back on this week.

But first, let me impress you.  Here is the percent of normal precipitation for the past two weeks over Washington State.  The dark red is less than 25% of normal!    No wonder some some media outlets are throwing around the D word (drought!) or predicting a dry spring.


But percent of normal precipitation can be very deceptive, particularly in places or times that are relatively dry (like our summers or east of the Cascade crest).  Far better is to view the departure of precipitation from normal (in inches) as shown below.  Dry eastern Washington was generally less than an inch below normal.   The Puget Sound lowlands, 1-2 inches down.  More over the usually wet western slopes of the Cascades and Olympics.

But everything changes this week as the large-scale atmospheric configuration changes profoundly.  

For nearly two weeks,  there has a deep low over the eastern Pacific, with the jet stream and accompanying storms heading into California.  This is illustrated below by a weather map for 11 AM Wednesday for an upper tropospheric  level (300 hPa pressure level, about 30,000 ft).   Yellow colors indicate the strongest (jet stream) winds. Washington State gets little precipitation from such a pattern.  


But the pattern greatly changes this week, as low pressure retreats into the Gulf of Alaska (the normal position) and the jet stream moves northward right into us (see the forecast map for 8 AM next Sunday)  We get nailed and California finally dries out.


Let me show you the precipitation forecasts from the UW WRF modeling system.  Here in Seattle we have two more days of dry conditions, but Oregon gets hit earlier.   The total accumulated precipitation through 5 PM Tuesday (shown below) predicts that western Oregon will be very wet during the next two days.


One day later (5 PM Wednesday), it is clear that the hose has reached western WA, with the Olympics and north Cascades receiving several inches.


But why stop there?  Here is the accumulated precipitation through 5 PM Sunday.  Wow.  The Olympics and mountains of southwest BC get 5-10 inches, with the rest of western WA and Oregon enjoying 1-5 inches.


We had a cold/snowy February, a dry March,  and now a wet April?  We will see.

But one thing is sure....  you can not believe the long-term forecasts.  Here are the extended predictions of the NOAA/NWS CFSv2 seasonal forecast model run in late February for the precipitation anomalies (difference from normal) for the end of March.   The CFS was going for WETTER than normal conditions over our region for the period....when it was very, very dry.  And dry or normal in California, where it was very wet.

No skill.   


March 29, 2019

Advice to Californians: Vacation in Washington State for Sun and Dry Conditions

California is advertised as the "Golden State" with dry conditions and sun.  Washington is given the bad rap as a place of clouds and rain.

But not this March.  California should properly be called the "Sodden State", while much of Washington has been extraordinarily dry.

For example, it appears that Seattle-Tacoma Airport will end up with 1.37 inches (assuming the forecasts are right), resulting in the second driest March since the airport observations started in 1948.    And Seattle has had seven days with measurable precipitation

Typical March 2019 Weather in Seattle


Typical San Francisco Weather in March

In contrast, San Francisco had 15 DAYS of measurable precipitation for a total of 4.43 inches.

Los Angeles has had 2.10 inches of rain this month.

And Puget Sound has had less clouds and more sun than San Francisco.

To appreciate the recent dry conditions, here is the percent of normal precipitation for the past 30 days.   Large sections of western Washington received 5-25% of normal, while San Francisco northward had 200-400% of the typical amounts. Nevada, Utah and Colorado  were all very wet.

Central/northern California was wetter in March than western Washington.   And our dry conditions were also associated with some very warm periods with strong easterly winds.  The result:  a few days with several wildfires and a pollen storm that brought misery.

The origin of the situation?   A very persistent area of low pressure west of California, as illustrated by the upper level anomaly map (difference from normal heights or pressure) for the past month (see below).   The purple/blue colors indicate lower heights or pressures offshore.  Such low pressure sweeps weather systems into California.  Western WA gets the dregs on the north side of the low.  And high pressure (red colors) to the north of us, coupled with the low pressure to the south, sets up unusual easterly (offshore) flow aloft.  Such flow is dry and dries further as it descends our mountains.


A very unusual, but perfect, configuration to give us a dry, often sunny, but fire-prone month.

And there may be a contributor to this configuration:  a resurgent El Nino, which is associated with warmer than normal sea surface temperatures over the central and eastern tropical Pacific.  Such warmer water forces tropical thunderstorms that push energy into the tropical atmosphere above, in turn forcing a series of waves that propagate into the midlatitudes, resulting in the lower pressure areas west of California.  Think of a rock thrown into a very big lake, with waves moving away from where the rock hits the water.


Finally, if you are worried about Californians rushing northward into western Washington, you should be.  I was going to joke about putting up a wall, but thought better of it.


March 27, 2019

UW's Cherry Blossom Timing and Our Winter Weather

One of the singular events each year in Seattle is the stunning display of white/pink blossoms on the Arts Quad at the University of Washington.  At maximum bloom, the flowering is simply stunning.


Interestingly enough, there is quite a bit of variation of the date of peak bloom, the day when the crescendo of color reaches its apex.   A day that I have told follows the beginning of blossoming by about one week.

As shown below, since 2012 the peak bloom dates have varied from mid March through early April.  Talking to some cherry blossom experts today, it appears that this year's peak bloom should be on March 31, give or take a day (and I have plotted it). 


I have done some recreational reading about this important topic, including a very nice paper by Chung et al. that finds that Cherry blossom timing for the famous Washington DC blooms is closely related to winter and early spring temperatures.  Colder winters delay flowering.  And they used some of the UW blossoming data as well.


So can we explain the above variation in blossom date with local temperature variations?  And do the above variations suggest the influence of global warming?

Let me begin by plotting December through February temperatures for the Puget Sound lowlands from the NOAA Climate Division Data. 

The two warmest years were 2015 and 2016 and YES, they had the earliest peak bloom.  Very good.  2017 was the coldest year and its bloom was quite late (well into April).  But 2018 was late, but the temperatures were not exceptionally cold.  In short, there is clearly some kind of correlation, but it isn't perfect.  In fact, the Chung et al paper suggests this, revealing that to get flowering requires sufficient cold early in the season and a certain amount of heating late in the spring.  So the relationship is a bit more complex


One thing is sure, the short period shown above (2012-2019) does not suggest a progressive earlier flowering as would be expected with warming.   And certainly the winter temperatures plot does not suggest a warming trend....if anything temperatures have cooled this decade, with a warm spike in 2015.  But this is simply too short a period to have much confidence in any trends.

I am trying to acquire a longer term blossom date data base to secure a better estimate of a longer-term trend.  Will do another blog on this topic if I get it.  If anyone can help me get it, let me know.

March 25, 2019

Aurora Forecast Bust and Dry Western Washington

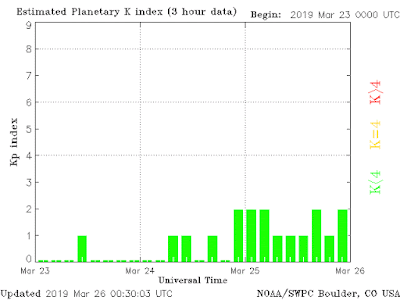
Well, I have to admit disappointment, both in the lack of auroral activity over Washington on Saturday and the poor forecast by the NOAA Space Weather Center of the Planetary K-index, Kp, which is used to characterize the magnitude of geomagnetic storms.

As noted in my last blog, there was a solar disturbance last Wednesday and the NOAA center predicted that that impacts would be felt on Saturday, with the potential for an evening aurora.

The forecast of Kp made the day before is shown below, with the verification right below.  Values over roughly four suggest a moderate geomagnetic storm that might provoke some decent auroral displays.  The initiation was predicted to occur Saturday morning (18 h is 11 AM).

But what occurred was much less and much later.  The "event" started on Sunday afternoon and was only reach a Kp of 2.

There was some minimal auroral activity Sunday night, but not in our area. 

Well, I suspect that predicting the propagation of particles from the sun to the earth is far more difficult than weather prediction, so I won't be critical of the NOAA folks.  Still disappointed though.

And we are getting some light rain tonight, which is welcome.  The last month has been dry for western Washington, in some places more than 4 inches below normal.  But most of the west has been wetter than normal, particularly around the Bay Area.

As shown in the cumulative one-month rainfall below, Sea Tac Airport received roughly 2.5 inches less than normal (cyan is normal, purple is observed)
But Pasco, in eastern WA, was about right:
The dry conditions in western Washington were very obvious over the weekend when I was busy turning over the soil in my vegetable garden....the soil was quite dry through depth. Sure enough the soil moisture anomaly (difference from normal) for yesterday showed drier than normal soil conditions.  And one good thing about the rain--it should lessen the pollen count a bit.


March 23, 2019

Potential Aurora Tonight!

One of the most extraordinary natural sights to behold is the aurora borealis and tonight and early Sunday morning, you might have a chance to see one in our region.


On Wednesday, there was a massive solar flare, followed by a coronal mass ejection (CME), on the sun.    It takes a few days for electrons and protons associated with the CME to reach the earth's atmosphere.  Blog reader Nick Earl suggests checking the following website to follow the progress of this event: https://www.swpc.noaa.gov/products/goes-magnetometer.

 The Space Weather Center is predicting a moderate geomagnetic storm today (see below),


with higher (red and yellow) Kp indices (which means the potential for auroral activity) between 1800 UTC (11 AM) today and 0900 UTC tomorrow (2 AM Sunday).


Furthermore, they are suggesting the potential to view auroras between the yellow and green lines on the chart below, which includes most of Washington State.


The big question, of course, is cloud cover.  The UW WRF model cloud forecast for 11 PM tonight suggests that western WA has a chance for some clearing, with a veil of thin high clouds over eastern WA.


 The latest NOAA/NWS HRRR (High Resolution Rapid Refresh) forecast for the same time shows a similar picture.  Cloud forecasts are difficult, but it appears that the western side of the state may offer some gaps that night allow a view if the aurora does occur over us


 I will certainly be looking.  One of the most amazing experiences in my life was seeing one as a teenager after a star gazing event with my family.  Will never forget the curtains of colored lights, constantly changing as if a wind were blowing on them.

March 21, 2019

The Great Eastern Washington Melt Out

Eastern Washington built up an above-average low-elevation snowpack at low levels in February and early March as a result of the extraordinary persistence of below- normal temperatures.

But temperatures have been rapidly warming the past week and the snow is melting fast.  You can appreciate the sudden warm up at Pasco in the central Columbia Basin from the figure below.  A progressive warming the last few day to highs that are even above normal.
But to appreciate the snow melt on a visceral level, let me show you a series of high-resolution MODIS satellite images.

March 13th--the Columbia Basin is snowbound


 Two days later, March 15th-- the snowpack is beginning to melt, with brown areas showing.


 By March 17th, the holes are really enlarging.


By March 20, broad areas are snow-free.


 And today, March 21st, most of the snow cover is gone at lower elevations.


The National Weather Service is warning about some very minor localized small stream flooding...nothing much to worry about.  But the snow cover and cold temperatures have left the soil temperatures quite cold in the Columbia Basin.

Here are the soil temperatures 8 inches below the surface from the WSU Agweather website.  Many are above 50F in western WA, much fewer in eastern WA, where some are still in the 30sF.  The agricultural season will be slow starting east of the Cascades.


March 19, 2019

Pollen Storm Hits Western Washington

People are suffering.  

Around my department, several folks had water eyes, runny noise, sinus pain, and a cough.

And it is all due to a massive and sudden influx of tree pollen, aggravated by very unusual weather conditions.

The initiator of these discomforts? A rapid increase of temperature accompanied by dry conditions and lots of wind.

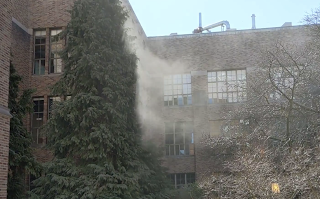
One  of the department sufferers (research meteorologist Jeff Baars) send me a video showing massive pollen coming off a cedar tree.  Take a look...you won't believe it.  He though the tree was on fire.

The link to the video is here.

The local tree pollen numbers were very high today and yesterday:  810 yesterday and 699 today, as reported by the NW Asthma and Allergy Center.


What a contrast to last week:
The pollen season onset was slowed by the cool temperatures in February and early March, but the rapid onset of well above normal temperatures has caused trees to release large amount of pollen. The last few days have been dry--so no rain out--and the unusually strong easterly winds, particularly today, pushed clouds of allergens into the air.

Not suffering enough?  The warm easterly downslope flow produce stunningly low relative humidity,  in fact the driest air of the last year at Sea Tac Airport.  Want the proof?  Check out this plot of RH for the last 12 months--it dropped to under 12% today.

 Another reason to have a dry cough.

And then there was the torrid temperatures of 79F at Sea Tac.  The warmest March day on record in Seattle (with a record going back to 1891).

And did I mention the wind?  Gusting to approximately 35 mph at Sea-Tac from the EAST.  This is quite unusual.

All and all, a challenging day for some.   Lots of pollen, very dry, windy, and extraordinarily warm for March.


The Warmest Winter Day in Sea-Tac History, But a Tie for Seattle

Yesterday reached an amazing high of 76F at Seattle-Tacoma Airport, an extraordinary contrast to the frigid temperatures of only a month ago.

But there is more:   That 76F was the warmest winter (Dec. 21-March 21) temperature ever observed at the airport, in a record that goes back to the late 1940s.

But before we get too puffed up with thermal pride (or worry), it should be noted that the same winter high (76F) was observed on March 19, 1928.  So we only tied the record.

Today we might beat it.

A plot of the temperature at Sea-Tac versus normal highs and lows for the entire winter (below) illustrates the amazing thermal surge.  Through Feb 1, our temperatures were a bit on the warm side, but then the bottom dropped out as we entered the freezer.   Below-normal temperatures reigned through early March, and then the thermostat was suddenly turned up.
Another plot shows Sea-Tac daily high (purple) and low (cyan) temperatures against the daily RECORD high (purple dashes) and lows (cyan dashes).  Yes...we clearly beat the all-time winter record at Sea-Tac.
Why are we so warm? 

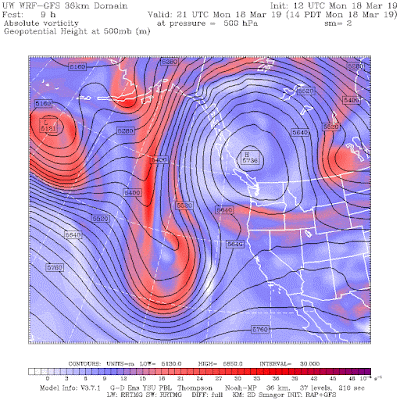
Everything had to be just right to do this.  We start with a very strong upper level high centered over southern BC and a trough offshore of California (see upper-level (500-hPa) map for 2 PM Monday).  This configuration is associated with warm air over the region and easterly (offshore) flow.  An unusual pattern.


The easterly flow is very important, since it produces downslope flow on the western side of the Cascades that warms the air by compression (as the air moves from low pressures aloft to higher pressures at low levels).   Just like your bicycle pump.

A plot of winds and temperatures  with height above Sea-Tac for the past day shows powerful easterly flow, reaching 30 knots.   That is strong.  Every major heat wave in late winter and early spring I can remember is associated with strong easterly flow...and this one is no different. (time increases to the left and is in UTC, heights are in pressure--850 is roughly 5000 ft)

With warm air and easterly flow just above the surface, expect a surge in temperatures today, as surface heating and associated mixing taps the warm air aloft.  Some locations near the Cascade foothills will get very near 80F.

March 17, 2019

With Declining Orcas and Salmon, Why Do We Allow the Shellfish Industry to Poison Our Coastal Waters With Herbicides and Pesticides?

Our Orca killer whales and Chinook salmon represent the environmental legacy of our region.  Their health and viability are important measures of the quality of our environmental stewardship of the region.

And sadly both are in decline.  


The populations of Chinook salmon and SRKW orcas are intertwined, since large Chinook salmon are a primary component of the Orca diet.

Documentation of a reduced Chinook salmon population is found in the Pacific Fishery Management Council annual report). And as noted in a number of recent stories, the Orca population is declining, with currently only 75 members remaining of the Southern Resident Killer Whale (SRKW) group that visit Puget Sound.  Not an historic low, but a substantial decline since the late 1990s.


Politicians and the media, such as the Seattle Times, have given a lot of attention to the declining Chinook/Orca population and have highlighted a number of causes from noisy boats, overfishing, and salmon-blocking dams, to the effects of the BLOB and global warming.

But strangely, these public accounts have not described what may be an important reason for the decline of the Chinook and thus the Orcas, the profound degradation of the coastal environment caused by the large regional shellfish industry.

A shellfish industry that has turned our coastal zones into industrial-scale farming operations for growing non-native shellfish species.  A shellfish industry that is spraying pesticides and herbicides over our coastal zone, killing native species such as burrowing shrimp, and denuding the coastal zone of grasses that serve as nurseries for young Chinook salmon and help feed our shorebirds.   A shellfish industry that has physically disturbed our shorelines and dispersed plastics and other foreign materials.

As will be described below, there is good reason to believe that the degradation of our coastal ecology by the shellfish industry has undermined the Chinook salmon population and thus harmed the food source of the Orcas.

Although our Orca population spends much of summer and fall in our local waters (the Salish Sea), they range from Monterey, CA to southeast Alaska during the winter and spring (see below).  Thus, food availability in nearby locations, such as Willapa Bay, is important.


Aquatic coastal grasses, such as eelgrass, play an essential role for fostering Chinook salmon.  There is a deep literature documenting the importance of such grasses for supporting juvenile salmon (examples here and here). Young Chinook salmon make use of eelgrass to hide from predators, and to rest and feed while on their migration from freshwater to the sea.

The Eelgrass Meadow by Diana Bressler.   The habitat that the shellfish industry is destroying

The shellfish industry finds that aquatic grasses are a hindrance to their non-native shellfish operations and thus have sprayed herbicides on a massive scale over coastal areas such as Willapa Bay.  And they have done this with the support of the Inslee administration.

Stunningly, two members of the governor's Orcas taskforce, Department of Fish & Wildlife Director Phil Anderson and State Representative Brian Blake,  pushed through approvals to allow the shellfish industry to kill Willapa Bay eelgrasses with the herbicide imazamox from 2011 to 2014.


Large scale spraying began in 2014 under a five-year permit. Applied without state monitoring, and spreading throughout the bay at lethal toxicities, most eelgrass is gone from this coastal estuary, home to iconic Pacific Northwest species including including Chinook salmon, Chum and Coho, herring, eulachon, steelhead, cutthroat trout, sturgeon and migratory waterfowl.  Salmon populations and migratory duck and geese levels have plummeted. In 2018, zero spawning Chinook were found in the Bear River, tributary to Willapa Bay.  The significant and likely permanent loss of Willapa Bay eelgrasses is very likely a cause.

Before and after spraying

At a recent hearing held by Rep. Blake on the request of the shellfish industry to spray pesticides over Willapa Bay, resident Ross Barkhurst described what the defoliation of eelgrasses has done to Willapa Bay (view his testimony here, go to 1hr 9 minutes):

“We’ve seen, since we started spraying eelgrass, we’ve seen Chinook salmon, chum salmon, waterfowl, the eelgrass that the waterfowl eat and the herring spawning mass--drop precipitously. They show no signs of coming back.”

Eelgrass provides critical habitat for young Chinook salmon

So we have the shellfish industry destroying critical habitat for Chinook salmon, the key food source of Orcas.

This has to stop. And it is extraordinarily disturbing that the current state administration is doing nothing to deal with the problem. Or that some of the media has not taken the time to examine this issue. 

Finally, let me note that the local shellfish industry is also pushing to spread a neurotoxin, imidacloprid, over Willapa Bay and Grays Harbor to kill native burrowing shrimp, an important food source of a number of native species (such as sturgeon and gray whales). And again, they appear to have the support of those in the Governor's office.

Let me end by noting that there is an excellent new book that describes the profound negative impacts of the shellfish industry on our coastal areas:  Toxic Pearl.  This book is available online (Orca Books, Amazon) and in many local bookstores.  Anyone worried about our local environmental, Chinook and Orcas should read it.

And then contact your state representatives and the governor to demand the end of spraying herbicides and pesticides over our state waters.


Should I Let AI Write My Blogs?

I spend a lot of time thinking about and writing my blogs.   Could AI apps do the work for me?   Could any of you tell the difference? Well,...