August 31, 2022

How Serious is the ARk Storm (Catastrophic Flooding) Threat Along the West Coast?

The media was abuzz last week with stories about a greatly increased threat of a massive flooding event along the West Coast, termed an ARk Storm.  The immediate stimulus of this apocalyptic vision was a recent paper by Xingying Huang and Daniel Swain in the journal Science Advances.


This article suggests that global warming has already substantially increased the probability of West Coast catastrophic flooding events and that the potential for such flooding will be profoundly enhanced by the end of the century.

In this blog, I will describe some serious problems with this study, which greatly overstates the threat.  And I will show you the actual trends of heavy, prolonged precipitation.

What is an ARk Storm?

This term denotes a record-breaking, extended, unimaginably heavy precipitation event along the West Coast (mainly California) that produces catastrophic flooding.  It represents a dual play on words. First, the story of Noah's ark in the bible, with global flooding after extended (40 days and nights!) heavy rain. And second, an atmospheric river (an AR) event that has an extended (like 1000 years or "k") return time.

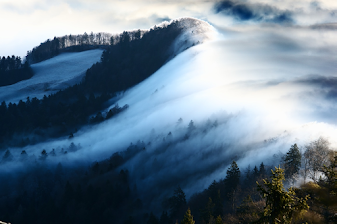
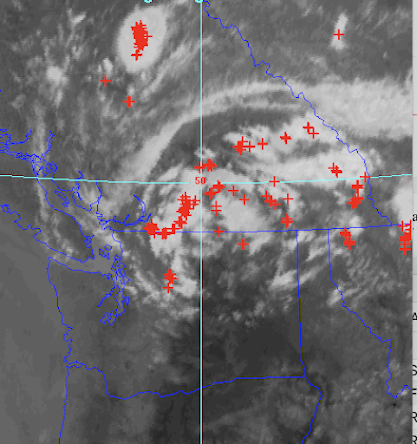
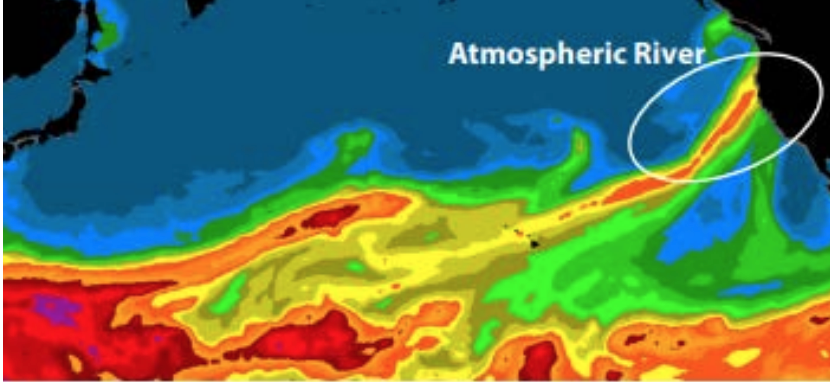
Atmospheric rivers are plumes of moisture that are associated with virtually all of the heavy precipitation events along the West Coast (see a satellite picture of one below).  Also called a Pineapple Express event in our region. Think of them as a meteorological "firehose" that dumps huge amounts of rain when it hits the terrain of the western U.S.


The only ARk storm in the historical record occurred during December 1861/January 1862 in California, over a period of about 30 days.  2-3 feet of rain fell over much of central California, with even more in some mountain locations, due to roughly a half-dozen extreme atmospheric river events.  This heavy rain was accompanied by above-normal temperatures, melting snowpack,  and a relatively wet period prior.

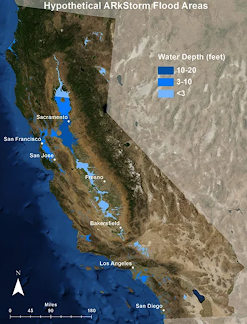
Larger areas of the interior of California were flooded (see estimated flooding extent below). There was extensive loss of life and damage to buildings and farms.


This kind of extreme, extended flooding event in California has occurred many times before, with evidence provided by layers of sediments in the coastal zone.   Such events appear to occur every few hundred years.

The Huang/Swain paper, based on global climate model simulations, downscaled to consider local variations using a high-resolution regional model, claims that the probability of such extreme events has already been greatly enhanced by global warming and will become far, far more probable later this century.

As you can imagine, such end-of-the-world clickbait is honey to the media bears and there have been dozens of stories on this paper during the past several weeks.  Unfortunately, there were serious problems with the paper and reality does not appear to agree with its estimates.

Let me demonstrate this to you below.

As I noted above, the Huang/Swain research is based not on observations but on an ensemble (collection) of climate model simulations.  Regrettably, they made a serious error by using climate models forced by a far too aggressive global warming scenario (RCP8.5), which is generally considered by the peer-reviewed literature to be unrealistic (too much warming).  Models driven by RCP8.5 also tend to poorly simulate the critical El Nino/La Nina cycle (also called ENSO).

RCP8.5, which makes the most draconian assumptions about fossil fuel use,  produces about twice as much warming as is reasonable.  And since atmospheric water vapor content goes up exponentially with temperature,  the use of the wrong scenario (with too much warming) is a very serious problem looking a precipitation impacts.  They should have used RCP4.5.


Another problem with this paper is their claim that the most extreme precipitation events in California occur in El Nino years.  This is inconsistent with observations:  neutral years (neither El Nino nor La Nina) are the most extreme precipitation years in that state. El Nino years are associated with more run-of-the-mill heavy precipitation events in southern California.

Inconsistency with observations

According to their model results, the frequency and amplitude of big, multi-week precipitation events should already have been increasing (see a reprint of their Figure 5a below).

Observations do not show that.   There is no evidence of an increase in heavy precipitation events or even changes in annual precipitation in California.     Which implies something is wrong with their model simulations.

                                      From Huang and Swain 2022


Let me prove this to you.    

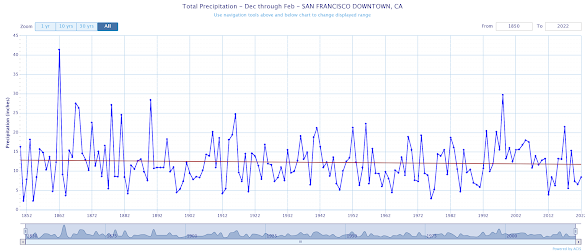
Below is the annual precipitation in San Francisco going back to 1853.    You can see the enormous annual precipitation for 1862.    Note that there is no upward trend during the next 150 years!!  In fact, it is slightly down (there is a linear trend line in red).


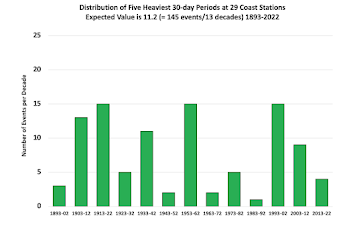
Professor John Christy, of the University of Alabama Huntsville and the Alabama State Climatologist, has put together the best long-period precipitation data set in existence for the West Coast.  As shown in the graphic below that he provided to me recently (below), there is no increasing trend in either 30-day extreme precipitation events over the past 130 years.  The same is true of two-week extremes.   During the past 50 years, global warming should have become significant.
 
There is no increasing trend of wettest 30-day events along the West Coast.  Graphics courtesy of Professor John Christy

A More Realistic View

The Huang/Swain paper makes big claims about global warming driving major increases in the potential frequency of huge ARkstorm precipitation events in California.

Unfortunately, there are major problems with their paper, including the assumption of an unrealistic increase in greenhouse gases.  Their simulations compare poorly against observed trends that show no increases in ARk-like or heavy rain events.

So what do I think is the truth of the matter? (and I have published extensively in the peer-reviewed literature on the impacts of global warming on heavy precipitation along the West Coast)

Let us base our projections on assuming that greenhouse gases will follow the more realistic RCP4.5 scenarios.  With advancing energy technology, the RCP2.6 scenario, might be even better.


Assuming RCP 4.5, annual precipitation will not change significantly for the West Coast during the remainder of the century, probably with a small upward trend.   Global warming will result in the very heaviest atmospheric river events increasing by 10-20%.  So all else being the same, BY THE END OF THE CENTURY, the potential for ARk storms will increase by that much.  

But remember, it takes more than more moisture to produce an ARk storm: you need not only record-breaking atmospheric rivers but to have multiple ones, all hitting the same area.  In short, there must be many extremely unusual "fire hoses" occurring in a short period and hitting the same geography.

And there is more: to have a record ARk flooding event you need to have a large pre-existing, ready to melt, snowpack in the mountains, which will lessen under global warming.  And an antecedent wet period.

No wonder it is rare to get an ARk event!  A lot of moving pieces.  And for most of the pieces, there is no reason to expect enhancement by global warming.


Furthermore, California has a massive storage capacity for water in its reservoir system, something that did not exist 100 years ago.  This can help buffer the next ARk storm.

And there is one more consideration:   reality is not following the predicted extreme precipitation increase projected by the climate models. Thus, it is quite possible that the models are overdoing the impacts of global warming.     I am a modeler, read the papers, and have been at endless seminars on climate model performance.  Trust me, these models have major problems and many deficiences are in the area of clouds and precipitation.

August 28, 2022

The Final Heatwave of the Summer? When does the threat disappear?

 Even with cool temperatures this weekend, the specter of more warmth is on the horizon.

But is this the end of the threat of real warmth in our region?   

Let's start with the forecast.    Another ridge of high pressure will build over the West Coast on Monday and Tuesday, as illustrated by the upper level (500 hPa pressure, about 18,000 ft) map for Tuesday at 5 PM.  The red indicates higher than normal pressure, the blues and purples below normal (troughing.

The latest National Weather Service National Blend of Models temperature forecast for Seattle indicated highs in the upper 80s on Tuesday and Wednesday before an extended cool-off to more seasonal temperatures around 80F.  Importantly, lows will reliably decline into the 50s, ensuring a good night's sleep.


As apparent to all of you, the nights are getting longer, the days shorter, and the strength of the sun's rays is ebbing.   Eventually, we simply won't be able to get into the 80s and 90s anymore.   

But when?  What does climatology tell us?  

To assist in this analysis, let's look at the climatology of temperatures on both sides of the Cascades for late summer and early fall (August 1- November 15, see below).  Each plot below shows the record highs (reds) and lows (cyan) and the average high/low range (brown shade).  I also plotted this year's temperatures (blue bars) and noted the 80, 90, and 100 F levels with dashed lines.

For SeaTac Airport, temperatures have gotten above 90F many times in August and early September, but never after October 1.  Highs above 80F have occurred through mid-October.    

The bottom line, the threat of above 90F in western Washington will be over in a month, with little chance of temperatures exceeding 95F after Sept. 1.


For the Tri-Cities (Pasco shown below), getting above 100F is no big deal in August, but becomes unprecedented after the first week of September.  Reaching into the 90s has occurred many times in September, but become unprecedented in October.  October is a very month in eastern Washington.

The bottom line:  Based on the current forecasts, it appears that after mid-week, there is probably little chance of Seattle exceeding 90F for the rest of the year.  And after Friday, little chance that Richland will exceed 100F for the remainder of 2022. 


Reminder: I will be teaching ATMS Atmospheric Sciences 101 this fall.


Like last year, I am teaching atmospheric sciences 101: a general introduction to weather and climate, this fall. You can learn more about the class on the class website. I talk about everything from the basics of the atmosphere to weather prediction, thunderstorms, hurricanes, and local weather to global warming and climate.

I will be teaching the class in person at the UW, but will also make it available over zoom. Thus, folks can take it remotely.

If you are over 60, you can take the class through the ACCESS program for a very nominal charge (something like $15). Last year I had over 100 folks do so.

If you are a UW student looking to learn about weather or a non-student interested in the topic, I welcome you to join me this fall. My first class is on September 28th.

Have You Been Censored by the Seattle Times?

I have become aware of a serious problem at the Seattle Times:  they have been censoring people who have left comments with a different viewpoint on climate change than theirs, with their actions based on accusations of "climate misinformation."   If you have been censored by the Seattle Times, including removal of comments or locking of accounts, please let me know through email or as a comment on this blog (I will not reveal your identity).

This is a very serious issue and reflects a disturbing attitude at our local newspaper.

August 26, 2022

A Mild Weekend, One Last Warm Period, and the Microclimates of the Northwest

 My podcast today starts with a very pleasant weekend forecast, with temperatures in the west in the 70s; 80s over the Columbia Basin.   But one more warm period is ahead, with highs climbing into the mid-80s by mid-week.


The latest forecast for Seattle shows probably the last upper-80s temperature period for the rest of the year.

The second half of the podcast is about microclimates--with large temperature variations in short distances.  I provide some dramatic examples from last week and tell you a bit on how they occur.


To listen to my podcast, use the link below or access it through your favorite podcast service.


Some major podcast servers:

 HTML tutorial HTML tutorial
Like the podcast? Support on Patreon 


August 25, 2022

Our Washington Coastal Water Temperatures are Warmer Than Normal. Why?

 The latest NOAA map of coastal water temperatures along the southern Washington coast shows temperatures above 61F (16C)...see below.  Cooler water is found along the Oregon and California coasts.  Much warmer water is found offshore.  At Ocean Shores or Long Beach, you could almost go into the water without a wetsuit.

How do these temperatures compare to normal?  Below are the anomalies (differences) from climatology (or normal conditions) of the sea surface temperatures. Warmer than normal by 2-3C along the coast and the warmth extends offshore. Cooler than normal along the California coast.


Before I explain why, I wanted to mention that late August is the time of typically warmest temperatures along our coast.  To illustrate, here is a plot of climatological sea surface temperatures at Ocean Shores, WA from the excellent website, Weatherspark.  The typical highest ocean temperature is on August 28th at 58F, compared to the lower 60s today.


So why are water temperatures warmer than normal this year?   A key issue is that the upwelling of cold water from below the surface is weaker.

And why is it weaker?  Because the normal high pressure offshore has been weaker than normal during the past months.  

High pressure offshore results in northerly winds (winds from the north) along our coastal zone. These winds blow on the ocean surface, and because of the rotation of the planet, this results in water currents being directed offshore.  To make up for the lost water, cool water comes up from below.


High pressure offshore....known as the East Pacific High-- is associated with northerly winds along the coast (see schematic).


During the past month, an unusual area of low pressure was positioned off the Oregon coast, something shown by the difference in pressure from normal for the past 30 days found below.  This resulted in weakened northerly winds, less upwelling of cooling water from below, and warmer than normal coastal temperatures.  

Now you know.

Sea level pressure difference from normal during the past month


August 23, 2022

A Lightning Vortex East of the Cascade Crest

 There was quite a lightning fest east of the Cascade crest today, with an impressive vortex of thunderstorms producing massive amounts of lightning.

The lightning flashes for the ten minutes ending 5:20 PM  tonight were amazing (see below, with clouds shown as well), with lightning circling around the vortex centered near Omak, WA.  Just wow....


The visible satellite image a few hours earlier shows the vortex and the numerous associated thunderstorms (each producing a blob of clouds).


These thunderstorms produced more than lighting, as illustrated by precipitation totals for today (Tuesday)...see below.  Some locations got over a half inch....a lot with a tenth of an inch or more.


The origin of this impressive vortex of clouds and lightning is an upper-level low.   Below is the map of 500-hPa heights (like pressures at 18,000 ft) around 5 PM (the winds are shown as well).  The low is centered near the WA/Canadian border, northwest of Spokane.


This low is not going anywhere fast.  Here is the forecast for 5 PM Wednesday.  A small shift to the southeast.


So you can expect a return of the thunderboomers on Wednesday!   To illustrate, below is the predicted clouds from the very high-resolution UW WRF model for 5 PM Wednesday.

Mama mia!  A lot of thunderstorms over the eastern quarter of Washington State!


Finally, tonight I was taking a long run with my dog around Magnuson Park in north Seattle and I saw a towering thunderstorm over the eastern slopes of the Cascades--some as high as 35,000 ft


August 21, 2022

More Climate Misinformation from the Seattle Times

If the nation is going to deal effectively with anthropogenic global warming, citizens must be provided with accurate information about the climate and how it is changing.

Unfortunately, the Seattle Times does not believe in communicating the facts but frequently provides deceptive, false, or exaggerated information.   

Last week, a story--These areas of WA are likely to get hotter--but people keep moving there-- is a good example of the kind of problematic "journalism "coming out of the Seattle Times. 


I will show you the deceptions in my blog below.  Perhaps it takes a magician to show you the details of the deceptive "dark arts" of another.  How information can be presented in a misleading way.

The claim of this Seattle Times story is that there is an influx of new residents into areas (Tri-Cities) that will see a lot more severe heat waves during future decades.

How foolish of them!  is the implied message.

The material in the article is not from some peer-reviewed research published in some prestigious journal.   No...it is based on a report Hazardous Heat by a climate activist NGO called the First Street Foundation of Brooklyn NY.  

The key graphic in the Seattle Times article is shown below, presenting the increase in the number of days above 90F during the next thirty years.  As noted in the caption, this graphic is based on "models from the NY-based nonprofit First Street Foundation."


Wow.  A HUGE increase in heat around the Tri-Cities, with  OVER TWELVE more days above 90F.  The center of the influx of new residents. 

The Columbia Basin will be a virtually Hades of Heat according to this work, with most of it experiencing more than 9 more days above 90F.

How could people be so foolish to move into this region?,  implies the Seattle Times.

Image courtesy of the Seattle Times

But there is more to notice in this figure.  Most of western Washington will only see 1-4 days above 90F, much less of a problem.

Some areas have no change (gray areas), including the north Cascades and even scattered regions in eastern Washington.  This seems very strange...why would global warming skip these regions?

How did the First Street folks get these results?  They started with global climate models driven by increasing greenhouse gases, and then did "statistical downscaling" to provide the higher resolution maps of temperature change.

What is really going on?

As I read the Seattle Times article and reviewed the First Street Hazardous Heat document, the problem with this "research" was immediately evident.  Let me show you the "dark arts" used.

I went to the Climate Explorer website and plotted the climatological mean high temperatures during summer (this was for 30 years ending 1990).   

Mama Mia! It looks a LOT like the Seattle Times plot of the change in the number of days above 90F during the next 30 years!

Temperatures are warmest in the lower elevations of the Columbia Basin.  Also warm in the Willamette Valley, with lesser warm temperatures snaking into the SW Washington.


This general pattern, locked into place by terrain and the land-water contrasts of the region, was evident in a map of the mean maximum temperatures for the last 60 days this summer (see below).


So according to the Seattle Times and First Street, there is going to be a huge increase in above 90F in just the regions that are already warm.   

So global warming is going to avoid most of western Washington but really hit hard in the regions that are already hot.  

This is simply nonsense.   Folks moving to the Tri-Cities are not being ignorant and foolish.  Let me prove this to you.

The Fallacy in the Seattle Times Story and the First Street Report

It is not an accident that the ST/First Street figure shows a big increase in 90F days where it is already hot.  IT HAS TO BE THAT WAY.  Such a figure tells you almost nothing about climate change.

But it is a good example of how picking an arbitrary threshold (in this case 90F) and determining how often you exceed it, is a totally flawed approach.  Let me show you.

Imagine if global warming increases the temperatures over the entire region by 2F (very close to the warming over the past 50 years for the globe and the region).

So places that had lots of temperatures in the 88 and 89F range, hit 90F and are counted in the Seattle Times/First Street approach.   But cooler places, WITH THE SAME AMOUNT OF WARMING, but fewer temperatures of 88/89F, would show far fewer (or NO) transitions to 90F.

So the methodology automatically suggests more of a major global warming problem in warm areas, but little in cooler areas, even with the same or even greater warming in the cool areas.

Want more proof?

Consider one year:  2020.   Here are the number of days with high temperatures of 88 or 89F at Pasco in the Tri-Cities.  THIRTEEN days.


But for Hoquiam, on the Washington Coast, ONLY One.


So warming by two degrees over the whole region will give 13 more "dangerous" events at Pasco and only one at Hoquiam.

Thus, in the Tri-Cities, a location highly accustomed to heat and where AC is everywhere, a few-degree warming and thus more transitions across the 90F barrier are worrisome, while along the coast, where AC is rare, warming is of little note.

And to beat a dead horse, here are the annual high temperatures in the Tri-Cities (Kennewick).  No obvious upward trend.


You see why the Seattle Times story was so silly?  And deceptive.

But there is more.   The Seattle Times chose not to show another graphic found in the First Street report, a graphic that contradicts their storyline about the heat around the Tri-Cities.

First Street also analyzed the situation in a different way:   instead of using the 90F threshold, they found the top 2% warmest days historically at every location and then determined how the number of days warmer than that changed with global warming over the next 30 years.   These days are called "Local Hot Days".

The result is shown below.   A VERY different map compared to the one shown in the Seattle Times.  According to these results, the San Juan Islands will show the most warming with Whatcom and Skagit Counties right behind.  Ironically, these are some of the mildest, most temperate parts of the State.  No special warming for the Tri-Cities and eastern WA in this graphic!

Graphic courtesy of First Street Foundation

End Note

The Seattle Times has an extensive history of inaccurate and hyperbolic reporting on climate change.  With scary, unfounded headlines and poorly researched stories, they are failing to accurately inform local readers about this important topic.

The folks that should care most about this poor journalism are those most concerned about climate change.

Society can not properly deal with this issue if the true nature of the problem is not accurately described.   How can we adapt to climate change if people don't understand the true threat?   Hype and exaggeration not only turn people off from dealing with the issue but politize it in a way that can lead to division and inaction.

And hype/exaggeration damages the most psychologically vulnerable.


August 19, 2022

A Good Weekend Ahead But More Heat in Our Future. Plus, a Primer on Northwest Humidity

After a week of warmth and humidity, temporary relief is here...at least west of the Cascade crest.

My podcast starts with a very pleasant forecast for the next four days over the western lowlands, but with a note about increased heat mid-week (see forecast temperatures for Seattle below).

East of the Cascades, temperatures will hover around 100F (see forecast for Tri-Cities below)


In my second segment, I talk about humidity in the Northwest.  Why was it so sticky last week?  What controls our humidity? All is revealed in the podcast.

To listen to my podcast, use the link below or access it through your favorite podcast service.


Some major podcast servers:

 HTML tutorial HTML tutorial
Like the podcast? Support on Patreon 


Should I Let AI Write My Blogs?

I spend a lot of time thinking about and writing my blogs.   Could AI apps do the work for me?   Could any of you tell the difference? Well,...