April 30, 2020

Not All Olympic Convergence Zones Are Located over Puget Sound

In this blog I talk a lot about the Puget Sound convergence zone, in which air moves around the Olympic Mountains and converges over Puget Sound, producing a band of clouds and precipitation somewhere between Everett and Seattle (see figure from my NW weather book)


But sometimes, when the wind approaches the coast from a more southwesterly direction, the convergence line can shift northward, producing a line of precipitation from roughly Port Townsend to Bellingham.  This is exactly the situation that occurred this morning.

The radar image at 6:46 AM this morning shows the story, with moderate (green) to heavy (yellow) rain in a band stretching to the northeast.  Was really raining hard in parts of Bellingham and in the hills to the northeast of town!


The visible satellite imagery about an hour later is pretty dramatic--you can see the cloud band stretching from the Olympics northeastward and profound rainshadowing north and south, with essentially clear skies in the lee of the mountains of Vancouver Island and from north Seattle southward.


I am proud to report that the UW WRF model predicted this precipitation band in the run started 5 PM on Wednesday...check it out below (three hour precipitation total ending 5 AM today)


The precipitation totals from midnight to noon today shows the results of the convergence band with some of the hills northeast of Bellingham getting over and inch.


In fact, Heather Meadows at Mt. Baker enjoyed a torrent of 1.94 inches!


To get such a precipitation band, the low-level, larger-scale flow approaching the Olympics from off the ocean needed to be from the southwest, something confirmed by the winds around 5000 ft (850 hPa pressure) forecast by the WRF model at 5 AM.


Finally, I should note that with recent rains, the April total will not end up anywhere near record dry territory.  The first half of the month was bone dry, but recent rains have brought us comfortablly close (but still below) to normal (see Seattle's cumulative April rainfall below, cyan is normal, purple is this year):
More rain is coming, particularly on Saturday.  Sunday looks decent.


April 29, 2020

Still Flying Blind: Can Meteorologists Help Epidemiologists with Coronavirus?

Things are not going well these days regarding predicting the future of coronavirus in the U.S., with the epidemiological community, including critical government agencies, not succeeding in these important areas:
  • They do not know the percentage of the U.S. population with active or past COVID-19 infections.
  • They do not have the ability to quality control and combine virus testing information into a coherent picture of the current situation.  This is a big-data problem.
  • The epidemiological simulation models used by U.S government agencies or American universities have a poor track record in their predictions, with their quantification of uncertainty unreliable.

But there is a group in the U.S. with deep experience and a highly successful track record in predicting complex environmental threats.  A group that is masterful in taking observations, combining them to create a good description of reality, building and testing predictive models, providing uncertainty information, and communicating the information to decision makers for critical life-threatening situations.

You know these people meteorologists involved in the large U.S. numerical weather prediction community.  And perhaps meteorologists can help epidemiologists and the U.S. government to get a handle on the coronavirus situation.


Now don't take this blog as one uppity weather guy trying to give advice "outside his lane."    A published paper in the Journal of Infectious Diseases (2016), said much of the same, with the authors noting the huge similarities in the work meteorologists and epidemiologists do and suggesting that the epidemiological community is roughly 40 years behind the numerical weather prediction enterprise.  They observed that both epidemiological and numerical weather prediction models are attempting to simulate complex systems with exponential error growth, and thus have great sensitivity to initial conditions.

So perhaps the experience of meteorologists, who spend much of their time thinking about how to improve weather forecasting, may be relevant to the current crisis.

The First Step in Prediction:  Describing the Initial State of the System

To predict the future you need to know what is happening now. The better you can describe the initial starting point of forecasts, the better the forecast.

Meteorologists have spent 3/4 of a century on such work, first with surface observations and balloon-launched radiosondes, and later with radars and satellite observations.  Billions have been invested in the weather observing system, which gives us a three-dimensional observational description of atmospheric structure.  Big data.  And we have learned how to quality control and combine the data with complex data assimilation techniques, with the resulting description of the atmosphere immensely improving our predictions.  This work is completed operationally by large, permanent groups such as NOAA and NASA, with large interactions with the research community.


Contrast this to the unfortunate state of epidemiologists predicting the future of the coronavirus.

They have very little data on what is happening now.  They don't know who in the population is currently infected or has been infected.  They don't even know the percentage of the current population that is infected.   Without such information, there is no way epidemiologists can realistically simulate the future of the pandemic.  They are trying, of course, but the results have been disappointing.

What they do have is death information and limited testing of those that are sick, but that information is insufficient to determine the state of current and past infection in the community, or essential parameters such as transmission rate and mortality rates.

Obviously,  the U.S. needs massive testing of the population to determine how the virus has invaded our communities and who is now immune.  The lack of such testing is a terrible failure of multiple levels of government.


But just as big a failure is the lack of random sampling of the population to determine the percentages of infection and how that varies around the nation.

We do have enough testing capability to do this (remember national political polls only use thousands of samples,  not millions).  Why is the epidemiological community and our political leaders not calling for such intelligent sampling of the population?   With random sampling we would KNOW what is going on and not act out of ignorance (as we currently are muddling by).   Why is the media not baying about this?

Quality control is another major problem faced by the epidemiological community, which deals with multiple types of tests of various quality that need to be brought together to produce an integrated picture of reality.  Death information is unreliable, because of non-reports or problems with determining the primary cause of death.  Quality control is a difficult task, faced by the meteorological community as well, one that we have dealt with in our data assimilation systems (e.g., observations weighted by their past quality and sophisticated consistency checks).

Simulation Models

Starting with an initial description of the system one is predicting (the 3-D atmospheric structure for meteorologists, the initial disease state of the population for epidemiologists), simulation models are used to predict the future.

Meteorologists use complex, full-physics models comprised of equations that predict the future  evolution of the atmosphere.  Then we apply statistical corrections to make the forecasts even better.

Epidemiologists use three types of forecast models:

  • SEIR/SIR models is the most "traditional" approach, one in which the population is divided into different groups (susceptible, exposed, infected, recovered), using relatively simple equations to describe how folks move from one group to another, all of which have assumptions about how the disease is transmitted, the effects of social interactions and more. The UK Imperial Model is an example of this approach.
  • Statistical models that don't really simulate what is going on, but are really curve-fitting exercises, in which theoretical curves (often gaussians) are used to predict the future, adjusting the curves based on the evolution of disease in the past or at other locations.  There are many assumptions in this approach and they cannot properly consider the unique characteristics of the region in question. The UW IHME model is a well-known user of this approach.
  • Agent-based modeling actually try to simulate the community at an individual level and it is the most complex and computer intensive approach.   Although dependent on several assumptions (such as the transmission rates between individuals) this approach is the closest to the numerical weather prediction used by meteorologists. The GLEAM model from Northeastern University (and others) is an example of this.

The trouble is that none of these epidemiological models have proven particularly skillful and produce vastly different results, something noted in some of the media, social media,  and several new research papers.  The UW IHME model, often quoted by local and national political leaders, has been particularly problematic (this paper describes some of the issues), including the fact that its probability forecasts are highly uncalibrated.  The UK Imperial Model in mid-March predicted 1.1-1.2  million deaths in the U.S., even with mitigation (so far the U.S. death toll has been about 60,000).  Many of the coronavirus prediction efforts have evinced unstable forecasts, with great shifts as more data becomes available or the models are enhanced.


The poor performance of these models in predicting the coronavirus is not surprising:  the lack of testing and particularly the lack of rational random sampling of the population results in no viable description of what is happening now.  The favored IHME model is only based on death rates, not on the infection state of the community.   Can you imagine if meteorologists tried to predict weather only using data around active storms? Very quickly, the forecasts--even of storms--would become worthless.  The same happens with coronavirus.

You cannot skillfully predict the future if you don't have a realistic starting point.  Furthermore, some of the models are highly simplistic and not based on the fundamental dynamics of disease spread (like the curve-fitting IHME approach).

The U.S. has a permanent, large, well-funded governmental prediction enterprise for weather prediction, one that has improved dramatically over the past decades.  No such parallel effort exists in the government for epidemiological modeling.  Instead, University groups, such as UW IHME, have revved up ad-hoc efforts using research models.


The Bottom Line:

Our government and political leadership have been making extraordinary decisions to close down major sectors of the economy, promulgating stay-at-home orders, moving education online, and spending trillions of dollars. 

And they have done so with inadequate information.  Decision makers don't know how many people are infected or were infected. They don't know how many people are already immune or the percentage of infected that are asymptomatic.  They are using untested models that have not been shown to be reliable.  This is not science-based decision making, no matter how often this term has been used, and responsibility for this sorry state of affairs is found on both the Federal and state levels.

The meteorological community has a long and successful track record in an analogous enterprise, showing the importance of massive data collection to describe the environment you wish to predict, the value of sophisticated and well-tested models to make the prediction, and the necessity to maintain a dedicated governmental group that is responsible for state-of-science prediction.

Perhaps this approach should be considered by the infectious disease community. and the experience of the numerical weather prediction community might be useful.

April 26, 2020

Is Atmospheric CO2 Declining from the Covid Economic Collapse?

I have had a number of people ask me:  with CO2 emissions collapsing from the economic downturn, are CO2 levels no longer going up or declining?   In fact, a brief search on the web reveals some headlines that seem to be suggesting this:


The bottom line of this blog is this:  CO2 levels are not falling, and it is difficult to see much impact on the rate of rise.  And it will be a good opportunity to talk about some aspects of the variation of CO2 in the atmosphere.

Let's start by looking at the concentrations of CO2 in the atmosphere as measured by NOAA at its Mauna Loa observatory on the Big Island (below).  This is an excellent place to measure CO2--away from any localized sources.  CO2 is relatively well mixed in the lower atmosphere (both spatially and in the vertical) so the measurements at this observatory are highly reflective of global variations over time.

You will note that CO2 has risen from around 317 parts per million (ppm) in 1960 to around 413 ppm today and the rate of increase is accelerating.  Mankind is not doing much to slow the increase, that is quite clear.  If you look closely, you will notice CO2 levels going up and down each year, like clockwork.
To get a view of this annual variability, here is a plot of the month values (red dash lines), with the black lines showing the impact of averaging designed to take out the seasonal variations (the plot goes through March).  CO2 levels tend to peak in mid-spring and the decline until they reach bottom in October.  Buy why?
It has to do with the cycle of plant growth in the northern hemisphere, where most of the planet's vegetated land area is found.   During the late spring and summer, plants grow and pull CO2 out of the atmosphere for their use in photosynthesis. But during the late autumn and winter, plants shut down, with many losing their leaves.  Their consumption of CO2 drops enormously, while CO2 is released as microbes feast on dead material, releasing CO2.  And, of course, we contribute to this increase with greater heating using fossil fuels.

But let's get back to the impact of mankind using less fossil fuels because of the coronavirus.  China put on the brakes in January and February, followed by Europe, the U.S. and most of the remainder of the world.  The numbers are still coming in, but the declines are substantial, with U.S. petroleum sales down by roughly 30% (see below).


To get a better idea of the recent changes in CO2, here are the weekly Mauna Loa CO2 numbers (green lines) for the past two years (below).   Monthly averages are shown by the red lines.   No obvious slowing of CO2 increases.  Note, there is often a flat period from February through March.

I downloaded the CO2 data and plotted it in all kinds of way, such as one year changes, one month and three month changes, and more.  Nothing suggested a major shift in the upward trends in CO2, so stories suggesting otherwise are not supported by observations.

 In some ways, the lack of  change in the upward trend in CO2 is not particularly surprising.    There is a lot of natural variability that obscures the signal.   CO2 emissions have only declined for a few months and China is already coming back online.  And there is still plenty of fossil fuels being used for heating, air conditioning, and basic transportation systems (including trucks and trains).    CO2 has a long lifetime in the atmosphere, so decreasing emissions would only slow the rise a bit, never causing a decline.

In short, with the world coming back online during the next few months, the long-term influence of this drop in emissions will be very small.  It is also provides notice that only really huge declines in CO2 emissions, far greater that what is occurring during this lockdown period, will be necessary to really move the needle on global warming.

A sobering thought.

April 24, 2020

Two Strong Fronts Are Approaching

For those those worried about dry conditions, additional relief is on the way.

Two strong fronts are approaching for this weekend.

The first arrives Saturday morning and it is interesting to watch it get modulated and weakened by our mountains..  Let me show the the 3-h precipitation predicted by the UW model.

For the period ending 8 AM Saturday, you can see the front making landfall, with the precipitation just reaching Puget Sound.


Three hours later is has reached the Cascades, with the mountains locally enhancing rainfall.

 But then dramatic change in the frontal rain is evident (2 PM shown): as the front descends the eastern side of the Cascades, the downslope flow greatly weakens the front and its associated rainfall.

And by 5 PM the frontal rain has reached the Rockies, where it is enhanced .  Note the residual showers on the western slopes of the Olympics and Cascades well behind the front.  Quite typical.

 The total precipitation for the entire frontal passage (through Sunday at 5 AM) shows the overall story, with up to around an inch in the Cascades, nearly nothing on the lower eastern slopes of the Cascades and modest amounts over the Rockies.   Classic.


And then we do it all again, late Sunday and Monday morning (see precipitation forecast for 2 AM Monday).


With these two fronts, April rainfall will have recovered to be in striking distance of normal. 

The first front will have a sharp wind shift and decent winds, particularly over the coast and Northwest Washington--the UW/Seattle Windwatch guidance shows the story at 6AM Saturday, with some gusts above 40 mph.
Enjoy the fronts....and Sunday looks like the best day to get out...or at least as out as you can be these days.

April 22, 2020

April Showers Return

April showers have been celebrated in music and verse, and after a lapse in the April-shower department, it is evident that they have returned for at least the next fortnight.
When April showers may come your way
They bring the flowers that bloom in May

The forecast of the European Center model is enough to get a May-flower enthusiast excited, with 1-2 inches in the lowland and perhaps twice that in the mountains.   Southern California, sodden from unending precipitation during the past month, will dry out completely.


As indicated by the "plume diagram" showing precipitation at Seattle for the remainder of the month (this is from the National Weather eEnsemble system of 21 forecasts, the black line is the average of all of the predictions), there will be several light precipitation events.  Enough to keep things moist.  Flowers like that.

Our April shower regime is the result of the shrinkage and southward shift of the ridge of high pressure, which was protecting our region from Pacific weather systems.In the new configuration,  the Northwest is in the path of moderate,  moist southwesterly flow (see upper level map for next Tuesday to see what I mean), which will bring rain to the western side of the Cascades.


So when it is raining think about the upcoming flowers and next few lines of that famous song:

So when it's raining have no regrets
Because it isn't raining rain you know
It's raining violets


April 20, 2020

Aurora Last Night

Some lucky folks in our region viewed an impressive aurora last night and perhaps a hint of it might be visible tomorrow morning.

Here is a picture provided  by Greg Johnson of Skunk Bay Weather of the aurora at 3:39 AM, looking northward from Kitsap towards Whidbey Island:


Greg also provided a magnificent video of Monday mornings event:


This aurora was associated with a coronal mass ejection (CME) event several days ago, which resulted in a relatively high planetary K index (about five) last night (see plot below).


The simulated distribution of the aurora provided by the NOAA Space Weather Prediction Center, shows the core of the event over southern/central Canada.


What about tonight?

It will certainly be clear enough, but as shown in the figure above, the K-index has dropped considerably.  The latest Space Center forecast is for a decline  of Kp to 3 tonight...which might not lead to a decent aurora show.  Might check their webpage tonight for an update. 


Viewing a good aurora is a life-changing experience.


April 18, 2020

Why Outside Air is Safe and Park Closures Should End

During the past month, the fear of coronavirus had spurred political leaders to close parks and nature areas throughout the country.

In Washington State, all state parks and state lands managed by the Department of Natural Resources are closed through at least May 4.  Here in Seattle, all major city parks were closed last weekend and parking lots for city parks are still shuttered.  Picnicking, barbecuing, and any sports are illegal in Seattle parks.  In California, hundreds of state parks, including many major beach areas, have been closed, and parking has been blocked off for all state recreation facilities.


All of these closures are predicated upon the assumption that coronavirus infection is a serious threat in outside air and that virus spread is significant outdoors.  As documented in this blog, such an assumption is not consistent with the best science.  Furthermore,  there is strong evidence that restriction of public access to parks and natural areas threatens both the physical and mental well being of the population and thus is counterproductive.  Many politicians claim that parks must be closed to prevent large groups from gathering and spreading the virus.  As we will see, such worries appear to have little basis in fact.

Torrey Pine Beach north of San Diego Is closed 

Is Outside Air Safe?

After searching through the literature and talking to a number of doctors and researchers, I could not find a single paper suggesting significant outdoor transmission of COVID-19 or any coronavirus. But there is a huge literature and long historical experience suggesting that outside air is immensely safer than indoor air within constrained spaces.  Here are a few examples and some quotes from medical experts on this point:

  • Qian et al., 2020:   Examined 1245 confirmed cases in 120 cities in China and identified only a single outbreak in an outdoor environment, which involved two cases. 
  • Nishiura et al., 2020:  Transmission of COVID-19 in a closed environment was 18.7 times greater compared to an open-air environment (95% confidence interval).
  • Lidia Morawska, professor and director of the International Laboratory for Air Quality and Health at Queensland University of Technology in Brisbane, Australia.”: Outdoors is safe, and there is certainly no cloud of virus-laden droplets hanging around... Firstly, any infectious droplets exhaled outside would be quickly diluted in outdoor air, so their concentrations would quickly become insignificant. “In addition, the stability of the virus outside is significantly shorter than inside. So outside is not really a problem...It is safe to go for a walk and jog and not to worry about the virus in the air”
Influenza patients were moved into the sunny, outside air to promote recovery during the 1918-1919 pandemic.
  • There is deep experience during other pandemics that placing patients outdoors greatly enhanced their recoveries and lessened spread to others.  In fact, during some pandemics (like 1918-1919) open-air hospitals were built and patients were moved outside into the sun, with very positive impacts.  To quote one paper on the subject ("The Open Air Treatment of Pandemic Influenza", which documented the reduction of mortality and morbidity in the open air: "more might be gained by introducing high levels of natural ventilation or, indeed, by encouraging the public to spend as much time outdoors as possible." 
  • There is an extensive literature that ultraviolet radiation from the sun can quickly degrade the viability of viruses in the air (e.g., Schuit et al. 2020: The Influence of Simulated Sunlight on the Inactivation of Influenza Virus in Aerosols).  As noted by Lytle et al., 2005: "Sunlight or, more specifically, solar UV radiation (UV) acts as the principal natural virucide in the environment." Duan et. al. 2003 found that "UV irradiation can efficiently eliminate the viral infectivity"
  • A fascinating study of virus transmission in dorms at the University of Maryland compared students in rooms with poor ventilation, with those who kept their windows open all the time (Zhu et al., 2020).  Those with open windows had one-fourth the rate of respiratory infections. Some did complain of being cold, though.
  • Virus particles rapidly disperse in the open air as noted by Case Western Reserve University Hospitals infectious disease specialist Dr. Amy Edwards: "When someone coughs or sneezes, most of the virus drops to the ground within 6 feet pretty quickly. That’s why doctors recommend social distancing. If a few particles remained in the air, they would be killed off by UV light in the sun, or blown away by the wind"


I could quote a lot more literature and from additional specialists, but you get the point.  Being in fresh, outside air, particularly when the sun is out, is clearly a good place to lessen one's exposure to COVID-19.

The risk of transmission of COVID-19 is extraordinarily less in outside air compared to within buildings.   There is essentially no background concentrations of the virus in outside air.  Ultraviolet radiation from the sun is destructive to the virus.  They is rapid dispersion of any source of virus (e.g., an infected coughing individual) by the wind in the vast outside volume of air.  And there is a substantial literature that concentration matters:  the more exposure to viral particles the greater the chance of infection. Viral concentrations will be very low outside, if they are measurable at all.

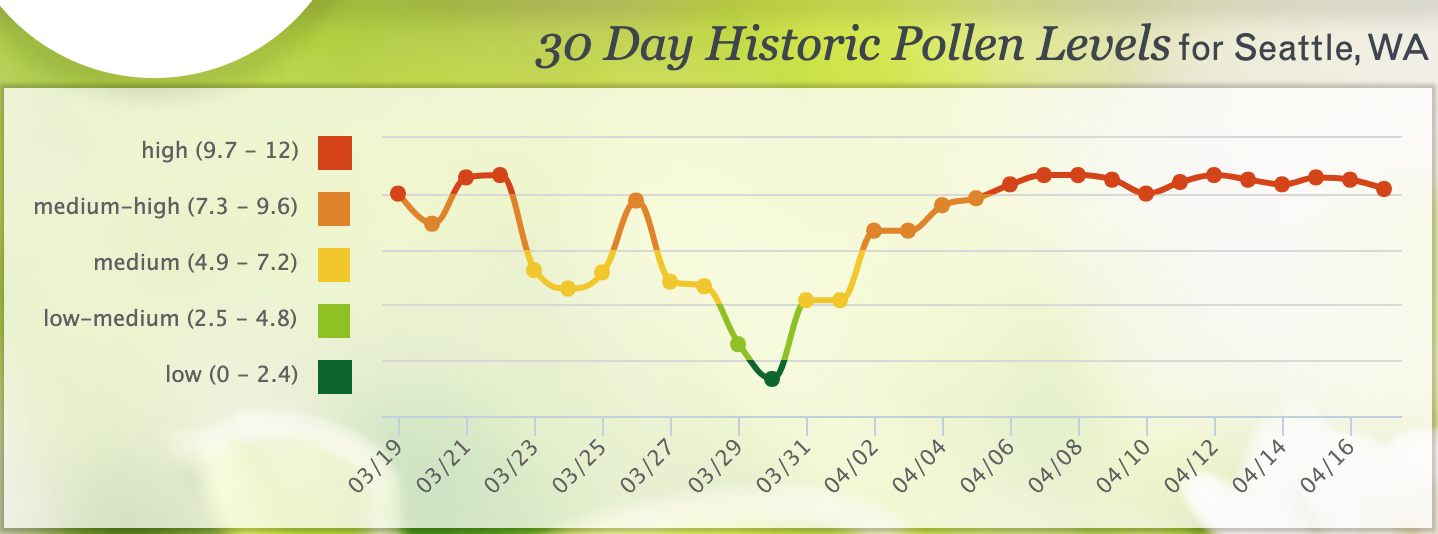
Another issue is humidity.   Viral transmission is degraded by high humidities and enhanced by lower humidities (check out this excellent recent review article: Moriyama et al. 2020);several papers suggest that relative humidities above 40% degrade transmission.   During the cool season, humidity inside building tends to be very low (check my earlier blog for an explanation), but outside humidities are generally much higher.  For example, below is a plot of the relative humidity in Seattle over the past three years.  Outside relative humidity only rarely drops below 40% around here.  Inside RH is often below 40% during the cool season.


Recently, there has been a lot of media attention regarding a simulation of particle dispersion from a coughing runner, with recommendations not to run directly behind him/her and particularly in the wake region behind the runner. There was some dramatic imagery (see below), but the risk from sick runners is really quite small.

First, there are not many runners coughing and sneezing while running--when someone is sick with the virus they have great fatigue and if they were asymptomatic carriers they would not be coughing! (Note:  there are some folks that cough after intense exercise).  Furthermore, the large virus-laden droplets tend to fall quickly and the smaller particles/droplets tend to follow the streamflow around an obstacle (that's you).  Most importantly, the droplets ejected from a sick runner would rapidly disperse in the free atmosphere and the UV radiation would work to lessen the viability of a virus.   Yes, there is a slipstream of air immediately behind a runner in which concentrations could be greater....but how many people are running immediately behind a sick runner? Even in the video, little of the particles reach the face of the runner following immediately behind.   Folks, this is a very small risk.


So let's get back to the policy decision to ban folks from parks and why it is illogical and contrary to common sense.

Hopefully, you are convinced that outside air is immensely more healthful with far less COVID-19 risk than the air we breathe inside of buildings.  You really want folks outside for that reason alone.

But what about social distancing?  If that is good, you want folks to spread out as much as possible. Thus, they should be ENCOURAGED to get their fresh air in vast open public spaces and particularly ones with lots of air motion (i.e. wind).


But yet that is exactly the opposite of what our political leadership is doing.  Here in Seattle, the Parks Department closed the largest parks in the city (like Magnuson, Lincoln and Discovery) last weekend, parks that afford great opportunities for social distancing (see map).  Many of these large parks (red X in the above figure) are near the water and experience stronger winds that are  particularly favorable for virus dispersal.  In contrast, the city left the smaller parks open, concentrating folks in small areas.  Just as bad is the closing of park parking lots, which forced folks to leave their cars outside of parks and to walk in narrow corridors (less social distancing) to enter the parks.

Magnuson Park was closed and everyone is forced to walk on the crowded path to the left.

In California, vast beach areas are closed, again forcing folks to stay indoors or crowd onto limited walkways.

All these park closures are based on fears of transmission within groups enjoying the parks.  But such closures do not make sense.   First, there is little evidence of viral spread in outdoor spaces, even when crowded.  Second, there is little evidence for such crowding in Washington State and California parks in other than the most isolated incidents.  I have been to several Seattle parks during the past weeks-- folks are generally careful and respectful, without large collections of folks in close proximity.  Obviously, park officials can make it clear that closely packed large crowds are not appropriate and that there will be giving warnings and citations if such crowds occur.   To put it succinctly, park closure is a solution in search of a problem that has never been shown to exist.  And it hurts exactly the people it is meant to help.

More Issues

Going to parks is extraordinarily good for physical and mental health.  Being outside exposes folks to the sun's UV rays that facilitate production of vitamin D, which bolsters the immune system and reduces the chance of infection by COVID-19 and other pathogens.  Recently, I got a call from a UW professor of medicine who is working on exactly this important relationship with COVID (he needed global UV/solar radiation data), confirming the above.   Vigorous exercise and even walking enhance the immune system, reducing chances of infection.  And exercise and fresh air have a very positive effect on mood, reducing stress and anxiety--both of which weaken the immune system,


And in a progressive city like Seattle, or in the progressive states of Washington or California, there are simple equity ideas that should be compelling.  Closing parks or making entry difficult hurts low income people the most.  Folks that live in small apartments or in crowded environments greatly enjoy the physical and emotional release of our wonderful large parks.  They are the ones who are most deprived by the park closings, both mentally and physically, in comparison to those with large homes and extensive garden areas.  And the closing of parking lots deprives the elderly and physically handicapped from the healthful conditions in our parks and the emotional salve of enjoying the outdoors.  I have noted the demographic shift in the park when the parking lots were closed.

In some ways, this is all about risk.  There is an extraordinarily small risk of catching COVID-19 while enjoying parks and natural areas.  I mean really, really small.   But park closures provide substantial risks that clearly threaten one's physical and mental health.  Our society is not particularly good in qualifying and acting upon risks, and the park closures are a prime example of this failure.

Sunset at Shoreline's Richmond Beach Park. 
Parking is closed and many cannot enjoy this view anymore

Governors Inslee, Cuomo, and Newsom have all stated that in dealing with the COVID-19 crisis it is essential to "follow the science."   It is time that they follow their own advice, reopening all the parks and nature areas, including the restoration of all parking facilities and access.

__________________________________________________

Addendum: A few commenters (and some politicians) have said that the parks should be closed because a few individuals did not practice sufficient social distancing in their evaluation.   So should everyone be punished and denied access to the parks because of a very small minority (the overwhelming number of park visitors are not gathering in groups)? 

Such communal punishment seems something out of a non-democratic society.   Plus, the dangers of isolated groups in the outside air is totally speculative and not based on any evidence.   Consider the situation on the highways.  Because some people are speeding and endangering others, do we stop EVERYONE from driving.   Of course not.  We warn them and give them tickets.   We can do the same thing in parks.

PSS: There are reasonable measures that could be done in parks, like closing active playgrounds and perhaps the bathrooms.  Places where many people are physically touching the same objects.


April 17, 2020

A Very Dry April with Extraordinary High Pollen Levels: But Change is Coming

April in our region has not only included "dry storms" of desiccated air and lots of sun.  Not surprisingly this month has been extraordinarily dry in terms of precipitation, with Seattle only receiving .01 inch this month.

Some folks are already asking me about drought---but as we will see below, such worries are premature. 

Let's start with the percentage of normal precipitation for the past two weeks, which is a study in contrasts.  Portions of the Northwest have received less than 25% of normal, while southern California have been crazy wet, with a large area being hit by 800% of normal.  You read that right.
Los Angeles and San Diego have been like Seattle in January.  Obvious this is good for delaying the wildfire season in a large portion of the Golden State.


Although April has been dry in the Northwest (because the weather systems have been going into California), our long-term precipitation is generally fine.  For example, below is plot of the accumulated precipitation at Seattle over the water year starting October 1 (purple is observed, cyan is normal).  Almost exactly normal right now.  That is why our plants look green and happy--the subsurface moisture is ok.
This dry spell was timed perfectly with the release of tree pollen in our region to provide a tree-pollen storm during the past two weeks (precipitation reduces pollen concentrations in the air).  Take a look at the values from pollen.com for Seattle, shown below.  Yikes.  It has been very high for the past week or two.  Miserable for those afflicted with allergies.


But relief is on the way....eventually.

The latest European Center (EC) model runs are insistent that rain will return in the second half of April. 

 The high resolution EC forecast (see below, from the wonderful weatherbell site) shows substantial rains during the last week of the month  (green bars are rain)--about 1.1 inch in total.  Temperatures will fall as well, mainly back into the upper 50s, which is normal.


A more regional view, looking at the average of the EC ensemble (running the forecasts many times, each a little different) for the total accumulated precipitation through May 2, shows a return to the normal pattern, with several inches (2-4) over the western side of the Northwest and drier conditions over California.   So enjoy the beautiful weather today, by the end of the month cloudier, cooler, and wetter conditions will return.  And thus suffering from tree pollen allergies can expect relief.


Should I Let AI Write My Blogs?

I spend a lot of time thinking about and writing my blogs.   Could AI apps do the work for me?   Could any of you tell the difference? Well,...