July 31, 2015

A Real Surprise: FEWER Acres Than Normal Have Burned over the Northwest This Year

The media has been giving incessant coverage to it this year.    The wildfire risk would be far greater than normal  and start earlier  because of the low snowpack.  That fires were ravaging the Northwest or that we were "burning up" because of drought and high temperatures.


But then there is the truth:  So far we have had one of the most benign fire seasons in years, with far LESS acreage than normal burning over our region.

Documentation of the situation is secured from the Northwest Interagency Coordination Center of the Bureau of Land Management, who graciously provided the graphs shown below.  Here is the cumulative acres burned over the Pacific Northwest (Oregon, Washington) starting on January 1. The blue line is what has occurred this year.  The dashed grey line is normal.   The blue dashed line is their forecast.  You can see that far less acres have burned this year than normal.


But what about the number of fires?   It seems like every day the TV news shows a fire starting near I5, I90, or some other roadway.  As shown below, this story is different.  There have been more fires than normal.   A lot more.   But most of these fires have been relatively small flashy grass or range fires that quickly burned out or are accessible to fire fighters.  There have been very few big fires.

Weekly acres burned?  Again, generally below normal, except the one week we had thunderstorms roll through.

The lack of big fires has been obvious to anyone looking at our skies.   Visibility (as shown by the Space Needle Cam on Thursday) has been quite good.  Not much smoke around (except the period we got smoke from British Columbia).


And the high-resolution MODIS satellite image on Thursday only show two modest fires (one near Lake Chelan).

So how can this be?   How can have the warmest summer in a half century, one with the lowest snowpack in recent history and far drier conditions than normal for months, have SO FEW FIRES?

Let me tell you what I think is going on--many are reasons I provided in my blogs earlier this summer when I warned about hyping the threat of an early and more severe fire season.

Reason Number 1: We have had far less lightning than usual.

 Historically, lightning initiates a significant percentage (perhaps half) of Northwest fires, particularly in remote terrain where fire control is difficult.   This year we have had much less lightning than normal because there have been far fewer thunderstorms.

Why less thunderstorms?   For the same reason we have been much warmer and drier than usual:
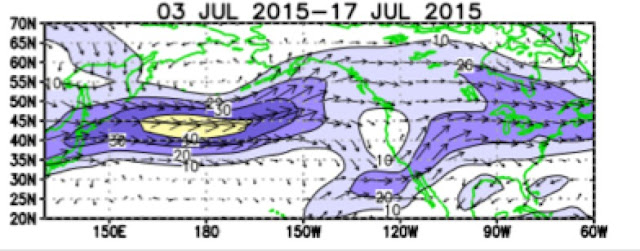
because there has been an unusually persistent ridge of high pressure over us.   You want proof?

 Here is the upper level height anomaly (difference from normal) at 500 hPa (about 18,000 ft).  You see the red area right off our coast?  BIG positive anomaly.  That means unusually strong high pressure right offshore and it extends over our region.  Such high pressure is associated with sinking air over us and a lack of clouds, precipitation and thunderstorms.

So the feature than made us hot and dry, worked against there being a wildfire initiator:  lightning.  I think this is the main reason for our meager wildfire season so far.

Reason 2:  Lack of Strong, Gusty Winds

Few things rev up a fire more or makes it spreads rapidly than strong gusty winds.  On the eastern slopes of the Cascades such strong winds often occur when an upper level trough moves through, resulting in a transition from hot to cooler temperatures.  Upper level troughs are often preceded by lightning as well.  This year we have had very few upper level troughs moving through because we are stuck with the anomalous ridge of high pressure.   So fires that have been started have not been "juiced" by strong winds.

Reason 3:  Effective Governmental Response

State governments and the Federal Government (e.g., Bureau of Land Management, Forest Service) have not been sitting idly by.  According to my friends in the wildfire business, there has been a particularly effective and robust response to fires this year.  And the fact that many of the fires were relatively accessible (often human initiated) made the fires easier to get at and stop.

Local governments (like the State of Washington) have promulgated burn bans in public lands and some municipalities banned fireworks.  This has helped.

All of these efforts have limited the number of fires and reduced the size of fires that did get started.


As an aside, it is interesting that the situation is similar in California:  less acres, more fires.

We are not out of the woods yet

The surface "fuels" of our region are very, very dry.   Our temperatures have been extraordinarily warm, with this summer being the warmest on record at many locations.   In fact, today we broke the record for the number of days in the 90s (ten).  The old record was 9 days.

If an active lightning period occurs, there is the potential for lots of fire starts, and potentially some in remote areas that would be difficult to deal with.  The latest forecast shows continued warmth into Sunday and then a major shift with a trough moving into our region, with precipitation and, yes, some lightning.  An upper trough will be parked off our coast much of next week (see upper level map for next Thursday at 4 AM) and that will bring cooler temperatures and the risk of thunderstorms.


The wildfire folks will need to get ready.  And any of you living at the wildland/urban interface should be prepared.  After this week, we expect the ridge to return.


July 29, 2015

Crazy Warm Temperatures over Southwest Oregon and Northwest California

How often do you see temperatures of over 100F at a coastal location, with cool ( roughly 50F) water close at hand?   Well today for one!  Let's head down to the southwest corner of Oregon, near Brookings.   This is a region often called the Banana Belt of Oregon for having "tropical" temperatures any month of the year.

Here is a map showing you today's maximum temperatures (F) over SW Oregon and NW California. Over 100F AT THE COAST at Brookings and at Gold Beach, just to its north. As shown by the sea surface temperature chart below, the water temperature was about 12C (54F) and the air temperatures were not much warmer over the water.   Some folks leaving Brookings harbor would go from torrid to chilly in a few minutes.  Warm temperatures (100F and more) were found around Medford (a well known heat hole) and as far north as the southern Willamette Valley.  But the really nutty heat was over coastal NW California, where a number of locations got over 110--with one hitting 117F!


Let's zoom in a little closer for these two hot coastal locations.  First, Brookings. Lots of 101 and 102F readings, with a location up in the hills reaching 108F.


Northwest California?  Here it is.  The purple colors are above 110F.   Some folks' marijuana crops are going to be awfully wilted there.  One location had 111 F near the water.


So why these crazy warm temperatures?  First, the air over the region is very hot---very near record breaking in the lower atmosphere.   I can prove this, by showing you climatological temperature data from the radiosonde (balloon-borne weather instruments) at Medford, Oregon (see below, courtesy of the NOAA/NWS Storm Prediction Center).  The black line shows the average temperature for each day  at 850 hPa (around 5000 ft) and the red line the extreme highs (daily records) at the 0000 UTC (5 PM) sounding time for this elevation.   The grey dot is today.  Very close to a daily record. Far above normal.
But the warm air aloft is not enough to give crazy warm coastal temperatures.   The cool, dense air would like to move in and displace the warm air over land.   You all have heard of sea breezes, driven by the differences of temperature between water and land.  For your reference, here is a schematic of the sea breeze.


So why didn't we see a super sea breeze that would have prevented the coast from seeming like the Sahara desert?   Something stopped the cool ocean air from pushing in, at least for a while.

The answer is strong lower atmosphere offshore flow driven by larger scale atmospheric circulations,   To demonstrate this, here is the vertical sounding (produced by a radiosonde balloon) at Medford, Oregon at 5 AM this morning.  I know this is kind of techie....but stay with me.  The vertical axis is height (in pressure), with 700 indicating about 10,000 t.  Temperature (red line) and dew point (blue line) with height are shown.   The winds are shown by the blue barbs.   Between 900 hPa (around 3000 ft) and 650 hPa (around 12,000 ft) the wind were easterly (from the east), pushing warm air towards the water.

But wait, there's more!  The coast areas of SW Oregon and NW California are very mountainous and thus air moving eastward would descend as it headed to the coast.  Sinking air warms by compression, since it is going from lower pressure aloft to higher pressure at low levels.   Thus, not only is marine air prevented from moving in, but the air reaching the coast is superheated by descent. No wonder some coastal areas got very warm.

The sea breeze, driven by the huge temperature gradients along the coast, did develop later in the day, resulting in a battle of meteorologically epic proportions occurred at some coastal locations, with huge temperature changes.  Here are some samples of the temperature and humidity at Brookings Airport and at Klamath, California.

Brookings Airport
 ______________________________________________________________________________
Klamath California

Both coastal locations had sudden drops in temperature and rapid rises of dew point during in the afternoon as the sea breeze won the battle.  Further inland, the offshore flow remained dominant.

Few areas of the world have such cold water next to such warm land.  We live in a land of contrasts.  Enjoy!

July 27, 2015

Will the Northwest Have A Water Problem This Fall?

Today, the city of Seattle announced a water advisory and asked folks to be careful with their water usage.  The reason is clear:   the city's reservoir levels are well below normal and dropping rapidly (see graphic).  

The origin of the plummeting water levels is no mystery:
  1. record-low snowpack, resulting in less streamflow during the late spring and summer
  2. dry conditions during the same period
  3. MUCH warmer than normal temperatures the last few months, resulting in enhanced evaporation from the surface and greatly increased water usage.
Fortunately, the city has some back-up sources of water, such as wells near Seattle-Tacoma Airport, and extra pumps at Chester Morse reservoir for increasing "low-water" capacity.

But the assumption is that rains will come back in the fall, preventing a serious water shortage.  But what if the fall is unusually dry? We don't have the multi-year storage like California.  Could we have a problem?

I starting thinking about such questions as I looked at the latest seasonal forecasts, particularly since the latest numerical predictions are for an extremely dry fall.  

Let's start with the latest forecast from the National Weather Service's Climate Forecast System (CFS) model. I will show you the precipitation anomalies (difference from normal) for Sept to November and December through February.

As you can see for yourself, the forecasts are for the fall to be dry and winter to be VERY dry.
 Winter temperatures? Warmer than normal (see graphic)
OK, that is just one U.S. seasonal forecast system.  How about the North American seasonal forecasting system (NMME), averaging more American and Canadian seasonal forecasts?  Here are the precipitation anomalies for November through January from this system: much drier than normal.
And there is an international seasonal prediction systems as well (IMME).  Here is the precipitation anomaly forecast for the same months.  Same story.....dry.

You will note that all of these forecasts are not only dry around here, but far wetter than normal in California.   This is a typical El Nino pattern, especially for the strong events.  And it looks like we are going to have a very strong El Nino in place this fall and winter.  So strong that we are already seeing the effects of El Nino on our weather this summer (southern CA has been unusually wet the past few months and we have been unusually dry).  This situation will save California, providing real relief for their multi-year drought.

Keep in mind that drier than normal for us does not mean no rain.  Clouds and rain will return, but conditions should be perceptibly drier and warmer than normal this fall.  Our reservoirs will get very low before the serious rains return.   And I worry about next summer.  Drier and warmer than normal conditions will result in another low snowpack year, although probably not as extreme as this year.  Why do I say this?   The warmth next year will probably not be as crazy hot as last year.


Seattle water managers are watching the situation carefully and I suspect they will soon ratchet things down another notch, restricting the amount of water used for irrigating lawns. Time to let our grass go brown.  Next winter, regional water agencies, like Seattle's SPU will have to be very careful to save as much water as possible for use next summer.

One final thing.   Forty years ago, our ability to make seasonal forecasts was basically non-existent and we didn't understand the implications of El Nino.  Today, we have useful guidance.   We have come a long way.

July 26, 2015

Seattle School Board Races

An important election is coming up for Seattle School Board members, one that will decide whether there will be a functioning majority that will be able to keep the district moving forward.  Three school board directors will be selected and fortunately the choices are quite clear.
First, in district 2, in which no incumbent is running, there is an extraordinary candidate:  Rick Burke.  If you want our district's children to have a good math education, Rick is your clear choice.  He has lead the Seattle group of Where's the Math, co-founded the Seattle Math Coalition, and has played a leading role in the successful upgrade of Seattle's elementary school math curriculum.  He has been PTA co-president, has had three children in Seattle public schools, and is a high-tech professional.   I have known Rick for years and have been ceaselessly impressed with his leadership skills, focus, hard work, and excellent people skills.   He will become a leader on the board.

Rick Burke

In district 6 the best choice is Marty McLaren, who has served on the board since 2011. I know Marty well, having worked with her for years to improve math education in the Seattle district. Some of you may remember that she sued the district with her own money when it choose extremely poor math books for our children. Then as a school board member she worked to correct the situation and today Seattle's elementary school children enjoy a decent math curriculum. If elected, one of her priorities will be to revamp middle school math...and I bet she will succeed.

But Marty has achieved many things during her first term. When Jose Banta, decided to leave our district for California, she was one of the majority that voted to put Larry Nyland in place to replace him. Nyland is probably the best superintendent the district has had in decades. Competent, approachable, and deeply knowledgeable about the region and district.  Importantly, Marty is supported by teachers. Jonathan Knapp, president of the Seattle Education Association, said that McLaren is the one person on the school board who “will listen to educators,” noting that she was a teacher. He said she’s the one person on the board who can help get to consensus to fix problems, instead of “grandstanding.”

Marty believes in listening, Of showing respect for others, even when she disagrees with them. And she now has deep experience and knowledge of the district. The board needs some members that are listeners and who can build cooperative relationships with the school administration.    Marty has been very successful in this role.  It would be a major mistake to replace her.

Marty McLaren

So there is  a clear choice for Seattle voters.  Elect Rick Burke and Marty McLaren and there is a good chance that the district can maintain its impressive movement with improving academics, increased enrollment, and smoother functioning district administration.   Midde school math will get fixed.  If you live in Seattle, please vote for them.


July 24, 2015

Finally! Arid Western Washington Gets Relief

It is strange to say this, but it seems strange to see rain reaching western Washington.

Stranger yet, it will be occurring during the climatologically driest period of the year (see plot below of average daily rainfall, which shows the dip to a minimum during this time)


The last month or so has been startling dry.   Here is the plot of the observed and climatological rainfall at Seattle Tacoma Airport since June 5th.  A few hundredths of an inch in June--we are down by roughly 2 inches. A trace (less than .01 inch) in July.   Sahara in Seattle.

Fortunately, the latest radar image (below) is reason for joy for many parched Northwesteners, folks that have had moisture envy of our brethren down in southern CA, of all places.  And it will be a potent tool for those fighting local wildfires.  Associated with an approaching Pacific front, moderate rain is now falling over the NE Olympics and southern Vancouver Is.  It is raining in Vancouver (see cam below).


Today, this front will slowly move through the region, reaching Seattle this afternoon and tonight.   Here is the predicted 24h precipitation totals ending 5 AM Saturday. SW British Columbia, the Olympics and the northern Cascades get the most--roughy a half inch.  The Puget Sound area will only get some light rain later today....not that much (see more detailed map below)


But this is just the appetizer.  On Saturday, a weak upper-level disturbance will move though, bringing light showers (see 24h precip ending 5 AM Sunday).  More over the southern Cascades.


The main event will be on Sunday as a robust upper level trough pushes into us (see upper air map for Sunday AM).   Goodbye big ridge of high pressure.


And here is the 24- precipitation ending 5 AM Monday (both wide and close-in view).  Extensive light rain, with particularly heavy amounts in the north Cascades and Olympics.


For most, this will not be a big rain event...but nearly all in the mountains and west of the Cascade crest will get some light rain.. Temperatures will drop back to the mid 60s to low 70s over the weekend.

The only problem?   There could be lightning on Sunday.  And guess what...the pesky ridge comes back quickly...pushing us back into the 80s and into dry conditions.

July 22, 2015

Cooler, more seasonal weather for the next week

We are now entering a magical period for all Northwest residents:  the climatologically driest period of the year (last week of July and first week of August).

The time of year to schedule outdoor weddings and major outdoor receptions.

But ironically, we will cool down over the next week and showers will be felt by many.


Now, a bit of an admission...when I want to get a quick forecast without looking at any data, I often turn to weather.com.   They have a very sophisticated model post-processing system that combines a lot of model forecasts and observations using an advanced statistical system to provide a really excellent forecast for most locations.  The quality of their forecasts over the NW has been confirmed by verification at my department and by a firm that runs a web site:  weatheradvisor.com. Weather.com forecasts are generally more skillful than the National Weather Service (BUT KEEP IN MIND THEY HEAVILY USE NATIONAL WEATHER SERVICE MODELS AND DATA)

Here is their forecast for the next 10 days for Seattle.   For the next week, lots of temps in the 70s. Very typical, but the chances for showers increases late Friday and on into the weekend as an upper trough moves through.  My apologizes to all brides with outdoor weddings.

The second thing I often look at is the output from the joint U.S./Canadian ensemble (many forecast) system (NAEFS), which provides uncertainty and probabilistic information.  Here is the output for Seattle.  Cool the next week, plenty of clouds, and the chance of light rain.

Good weather to keep the fire danger down.

And then my next step is to look directly as a variety of model output, starting, of course, with the UW high-resolution WRF model.  Here is the forecasts of precipitation for the next two 72h periods.  With the east Pacific ridge replaced by upper troughs moving into BC, we see some rain extending from Seattle into British Columbia.  So you want cool and damp?-- go north. Warmer and drier, head to Portland and south.  California should dry out for a while.


So after endless heat and drought, some minor relief is in the bag.   But next week our old friend the ridge of high pressure rebuilds.  And temperatures back in to the 80s.

And what do I check after looking at more models?  That will be a future blog....


July 20, 2015

Northwest is Toast, While Southern California Floods

Southern California is usually dependably uber-dry during July, helping make it the "golden state."   But not this year.    While the Pacific Northwest has been very dry this summer, southern California is enjoying lots of rain, leading to localized flooding and even the destruction of part of Interstate-10.  The Los Angeles Angels' had their first rainout in 20 year, the San Diego Padres' had the first rainout since 2006, and Los Angeles enjoyed the wettest July day (.36 inches) in 130 years.  July rainfall records are falling all over CA.


Let's explore what has happened and why.   First, take a look at the percentage of normal rainfall during the last month.  Some places in southern CA had over 800% of normal (which is admittedly a small amount).   And Washington and western Oregon have been MUCH drier than normal (but admittedly we generally don't get much this time of the year).  Our long range models very skillfully predicted this pattern months ago.   Very impressive.

To get a different perspective, here is the precipitation over  the past seven days over southern CA--very wet for this time of the year, with several locations securing daily or monthly 24-h records.   Some locations in the mountains got hit by roughly 3 inches.

The last 24-h....more rain!  Here are the 24-totals ending 11 PM Monday over southern CA.  A number of mountain locations enjoyed more than an inch.  All this rain is very welcome and helps lessen the fire danger, as well as reducing water needs for irrigation.

So what is going on?  Why is southern California hugely wetter than the Pacific Northwest?   During the last few days, the precipitation has been the result of the weakening Hurricane Dolores.  Two days ago, the moisture advancing ahead of the storm brought thunderstorms and rain to Monterrey and the central coast (see below)


And today, as the weakened low center of Dolores was just offshore of Southern CA, moisture streamed over the southern CA coastal zone.    Why was Dolores able to come so far north?   One reason is the unusually warm water over the eastern Pacific this year.

There is substantial evidence that the most important cause of the southern CA precipitation is the surging El Nino, which tends to bring stronger upper level flow into the region.   Here are the upper air (200 hPa) wind anomalies (differences from normal) for the past two weeks.   Stronger than normal westerly and southwesterly flow into the upper Baja and the  SW U.S.  A split flow west of the Northwest.  Classic El Nino signal.

The El Nino is rapidly strengthening....this may well be an historically strong event.   California needs to prepare for a wet winter and we need to be ready for a boring one.


Should I Let AI Write My Blogs?

I spend a lot of time thinking about and writing my blogs.   Could AI apps do the work for me?   Could any of you tell the difference? Well,...