December 12, 2024

Power Outage Prediction Maps for the Friday/Saturday Storm

6 PM.  Storm becoming more threatening to Seattle northward.  Update at 8:15 PM

As a new service of this blog, I will indicate the areas where powerlines might be damaged by the approaching storm.  You can't say you don't get cutting-edge products on this site. 😊 

Perhaps the forecasts might help local utilities pre-position necessary assets.

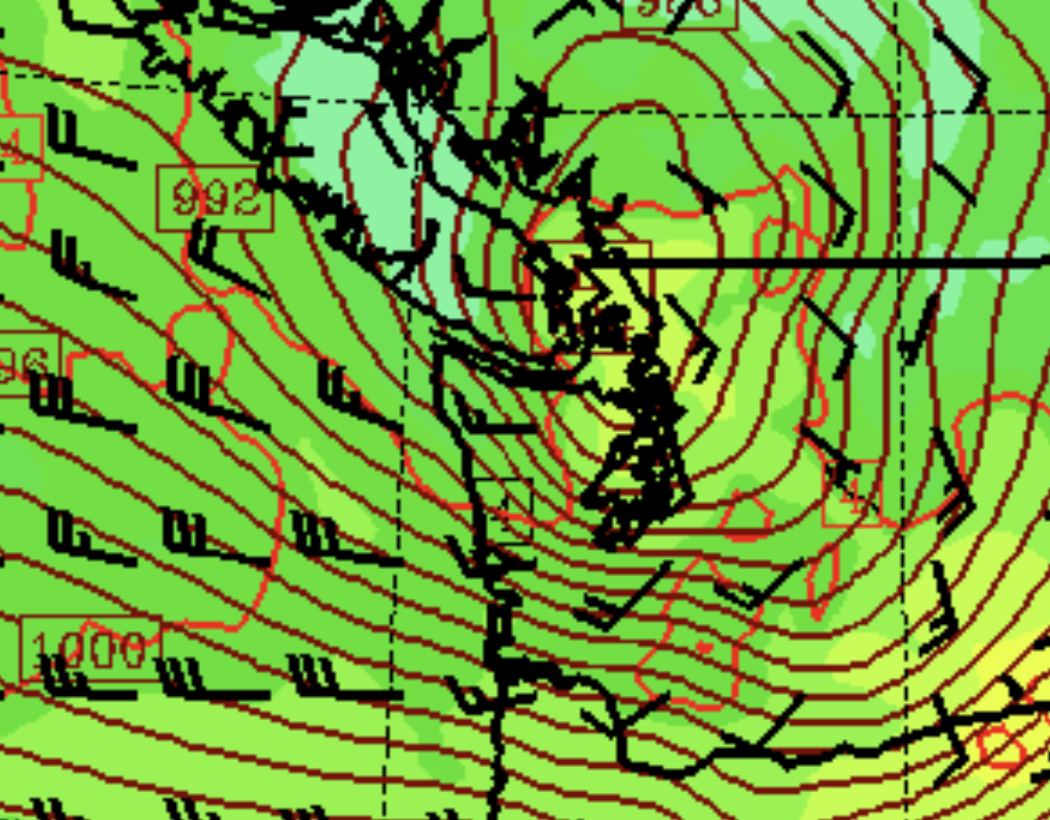
The latest European Center sea-level pressure forecast is for a very respectable 977 hPa low with a ring of strong winds wrapping around it (shown at 4 AM Saturday, winds in knots). 

 No, this is not some doomsday machine and, no,  it is not a BOMB CYCLONE.  I will not hype this storm like some amateur sites and certain local media.


Now the serious part....where will the power outages be, if any? 

 My general experience is that power outages during December and January generally get started when gusts surge above 40 mph (35 knots).   Definitely, some losses when gusts exceed 50 mph (43 knots), and expect lots of blackouts when winds surge above 60 mph (52 knots).

Of course, there are subtleties. Outages early in the fall require less wind to damage trees and, thus, the powerlines. Unusual directions (like the easterlies of Nov. 19) do more damage.

But with all that said, let's examine the prediction winds of the best local model around (the UW super-high resolution WRF model).   I will show you some new graphics that we have developed, showing the strongest wind prediction over a period.

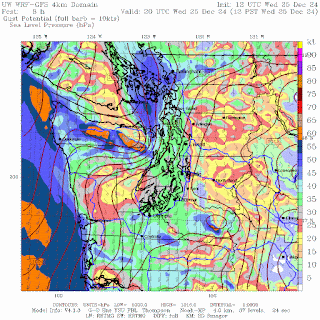
For the period through 4 AM Saturday, there is potential trouble on the Washington coast and northwest Washington (see below).   I particularly worry about Sequim to Port Townsend to central Whidbey Island).  The San Juans and Bellingham could see some flickering lights.  Some modest potential for the western foothills of the Cascades but NOTHING LIKE Nov. 9.


Extending the period through early Sunday morning, we see an enhanced risk over NW Washington and along the coast.  Potentially strong downslope winds on the NE slopes of the Olympics....but few people live there.


Here in Seattle, it will get blustery, but I don't expect a lot of wind damage.   

A good source to check is the City of Seattle WindWatch website (a project of my group), which shows the strongest winds over the city from a variety of forecast sources (below).    A max gust in the low 30s mph looks like a good bet.   Those of you in Seattle who bought generators during black Friday/Monday will probably not get a chance to use them.


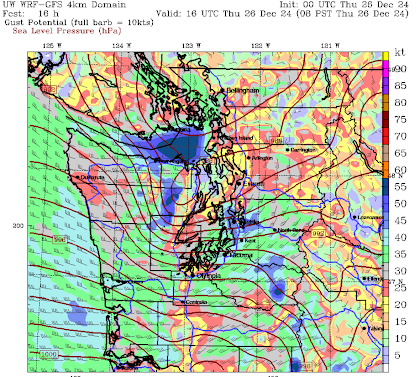
The strongest winds over the northwest interior of western Washington will probably be on Saturday morning around 10 AM.  Below are the forecast gusts at that time.

If you are in purple or blue, charge your batteries.  Red....you might have some issues.

Enjoy.

Announcement
_________________

I will hold a special online zoom session at 10 AM on Saturday for Patreon supporters.  I will discuss the storm and answer your questions....assuming my power does not go out!


December 11, 2024

A Major Cyclone Will Approach Our Coast But Not a Repeat of November 19

A very strong, rapidly developing, midlatitude cyclone will approach the Northwest coast on Friday and move through on Saturday.

Fortunately, the wind situation will be far less threatening in the interior compared to the November 9 event.  This blog will explain why.  But big waves may cause problems on the northwest coast.

Let's start with the predicted sea level pressure and surface wind gust map at 10 AM Friday morning.  

Pretty scary looking, with a 979 hPa low-pressure center.  Strong winds (up to 60 knots) will occur in a ring around the low center.  An associated occluded front will be hitting the Oregon coast with even stronger winds at this time.

By 7 PM on Friday the low will move northwestward and strengthen slightly to 977 hPa. 


Overnight the system will weaken and move across northern Vancouver Island.

Importantly, this will change the orientation of the isobars, producing a large north-south pressure difference and strong winds over NW Washington,

Over western Washington, the winds will evolve in three acts.

In the first, shown at 1 PM on Friday, strong winds (blue colors) will occur along the coast and over the waters of NW Washington.  Strong downslope winds will occur on the lee (NE) side of the Olympics. Moderate (20-35 kt) easterly winds will descend the western slopes of the Cascades, but their strength will be NOTHING like November 19th.


In stage two,  shown at 1 AM Saturday, the coastal winds will weaken, although still strong on the northern WA coast.  The downslope easterly winds will have ended and winds will pick up over Puget Sound.

In stage three, northern Puget Sound winds (from roughly Seattle to Bellingham) will strengthen with gusts reaching 30-40 knots from the Sound.   A few branches may fall and I expect a few minor power outages.  Nothing significant.  Winds will fade later in the day


This event will represent a typical mid-winter blow.

The most serious impacts may be the waves and high water levels on the Washington Coast.

The strong winds acting on the Pacific should produce substantial wave action on our coast and Vancouver Island.  The latest NOAA WaveWatch3 prediction is for significant wave heights of 20-30 ft.

That will be on top of some higher-than-normal astronomical tides (see below for La Push/Quilayute):

Clearly, some potential for coastal flooding on the northern Washington coast late Friday and Saturday.


December 08, 2024

Poor Vegetation Management and Windstorm Power Outages: A Frustrated Meteorologist Complains

 One of the great frustrations of being a meteorologist is to see a major event nearly perfectly forecast, yet with massive impacts on society.

It is frustrating to be concerned about global warming and seeing our region unable to keep the lights on for over a million people, some for 2-5 days. Without reliability, a transition away from fossil fuels cannot be made.

I have blogged several times about the major easterly wind event on November 19, which resulted in over a half-million homes losing power.    This event was nearly perfectly forecast several days ahead.....so there is not much more my discipline can do.


Brave, resilient individuals who restored power, some working for 12-36 h without rest, are the heroes of this story.

The villains?   Perhaps utility companies that were complacent about clearing trees and branches from the powerlines.  Utilities that did not invest in underground wiring when needed.

Let me show you some examples...and you be the judge.

Large areas in Seattle were out of power for 3-5 days, resulting in spoiled food, folks forced out of their homes by cold, and closed businesses.

For example, major Seattle City Light powerlines in northwest Seattle along Sand Point Way NE  (between NE 70th and NE 95th) frequently fail because of the lack of trimming of branches that extend above the powerlines.   Multiple branch failures on these lines blacked out northern Magnuson Park, Inverness, Inverness Park, Sand Point Country Club, and Mathews Beach on November 19, affecting thousands of Seattle residents.

Even today, there are large sections of Sand Point Way NE where branches extend over the powerlines (see below)....the next power outage is ready to go!


Vegetation management outside of Seattle, mainly in areas for which Puget Sound Energy is responsible, is even worse.   A few of thousands of examples are shown below

South of Issaquah

Mercer Island....find the powerline!

If this region is really serious about moving to a dependency on electricity, the power grid needs to be much more reliable.   Either bury power cables or initiate a massive program of tree trimming and removal.  Meteorologists are doing our part... utilities must do theirs.


December 06, 2024

Front versus Cold Pool

 It may be the most noteworthy battle since Gozilla versus Kong.


For over a week, a formidable pool of cold, dense, cloud-laden air has settled within the Columbia Basin (see visible satellite image from Thursday).

The cam at Mission Ridge ski area this morning looked down on the cloudy miasma that covers the Columbia Basin.


With a deck of low clouds in place and little solar radiation reaching the surface, the surface air temperatures in the Columbia Basin have been startingly constant, holding in the lower to mid-30sF.

As an example, here are the temperatures at Grant County Airport near Moses Lake.    A week of near-freezing temperatures without sun.   Not very pleasant.


Widespread freezing temperatures led to substantial surface icing around the Columbia Basin, with some collisions.
 Winds have been very light in the cold, dense air in the Columbia Basin, resulting in virtually no power generation from all the wind turbines--and that is for a WHOLE WEEK.
To show this, here are the generation numbers from Bonneville, with green being wind plus solar (obviously very little solar, considering the time of year and the clouds).


One reason that the cold, moist air at low levels is so stable is that it was surmounted by a very strong inversion (temperatures warming with height).  Inversions act as barriers to vertical air motion and suppress vertical mixing.

The vertical sounding (from a balloon launched radiosonde) at Spokane yesterday shows a strong inversion from around 3500 to 6000 ft, with an increase of around 14 C ....that is 25 degrees F!!  

So we had a Godzilla inversion.

Only a mighty meteorological Kong can hope to destroy it.

And that Kong is a strong Pacific front, with notable winds and lots of precipitation.

I will now show a series of high-resolution forecasts, providing surface (2-m) air temperatures, sea-level pressure, and near-surface winds.

This morning at 7 AM, there was lots of cold air east of the Cascade crest of Washington.


At 1 AM Saturday morning, a Pacific front with a strong wind shift is right off the coast (the blue line shows the frontal position), with cold air still over the Columbia Basin.


The front had moved across Washington State by 1 PM Saturday (below), with strong winds over eastern Washington.  The cool air (blue colors) is gone.  


Frontal Kong will win the battle.
  

To demonstrate this, here is the forecast temperature plot for Pasco (actually many forecasts, with the black line being their average).  Rapid warming to well above freezing around 10 AM on Saturday.


The front will also bring Kong-sized precipitation with large values (2-6 inches of liquid water) expected in the mountains (see total through 4 PM Sunday shown below)


Much of that water will fall as snow at the higher elevations.


December 04, 2024

When will the SuperInversion End?

During the past few days, a very strong inversion has formed in the lowest few thousand feet.

So strong that I call it a SuperInversion.

A SuperInversion is characterized by an increase in the vertical of more than 20°F in 2000 ft or less.

To prove we had a SuperInversion in place, consider the temperatures above SeaTac Airport this morning at 10 AM (below).  Approximately 32F near the surface but roughly 53F around 2200 ft. A 21F INCREASE.  Clearly a SuperInversion.


Consider the situation at Mount Washington, near I-90 and above Chester Morse Lake.  56F at the top and lower to mid-30s at the base.   Several hikers emailed me today about spring-like temperatures on top of local peaks.  


The cool low-level air was associated with dense fog, which developed overnight as the Earth emitted infrared radiation to space.    Let me show you remarkable images from the Seattle PanoCam on top of the Seattle SpaceNeedle.

Yesterday (Tuesday) at 4 PM, the skies had cleared in Seattle.


With the sun down, the Earth's surface cooled by emitting infrared radiation to space.  The air was cooled to saturation (100% relative humidity) and fog and low clouds were evident by 8 PM.


And by midnight it had deepened further


And in the early morning hours deepened more


And then was higher than the Space Needle


Homes in the hills above Bellevue, roughly above 1000 ft, were just above the fog, as shown by the picture below. 


Picture courtesy of Kristi Benda.

The inversion was so strong that it acted as a lens producing a superior mirage in which objects and clouds are shifted higher in the sky and distorted (see below, purple arrows show the mirage.  It isn't really there!).


Picture courtesy of Peter Benda

Tomorrow morning will be a repeat.

But the days of the SuperInversion and low-level clouds are numbered.  A fairly strong cold front will move through on Saturday (see surface map for 1 AM on Saturday, blue line is the front).  The strong low-level winds will result in mixing that will scour out the low-level cool air and remove the warmer air aloft.

Inversion over.   I will miss it.


December 03, 2024

The Fog Bowls of Washington State

 The visible satellite image this morning around 10 AM is impressive, with low clouds and fog enveloping the lowlands of Puget Sound, the Willamette Valley, and the entire Columbia Basin.

The clouds are associated with cool, dense, moist air trapped within the lower elevations of regional basins.

The cold air is quite shallow.   I can demonstrate this with the temperatures at SeaTac around noon today (below).  Temperatures were in the 30s near the surface, while lower 50s were observed above roughly 2200 ft.

A strong inversion, with temperature increasing with elevation, was evident between them.

Or consider the radiosonde (ballon-based) temperatures at Salem, Oregon, within the foggy Willamette Valley (see below, temperatures in °C, 0 is freezing, 10C is 50F), 900 hPa on Y-axis is around 3200 ft).  This is from 4 AM this morning.

The right line is temperature and the left line is dewpoint.  A cool, saturated sub-freezing layer near the surface is below a very strong inversion where temperature increases by about 15C (27F) over about 1000 ft. 


These are wonderful days for hiking in the local foothills.   Consider Tiger Mountain near Issaquah.  Frosty and cloudy when you start but in the 50s with bright sun at the top (around 2500 ft).

Inversions are very stable features, meaning that they suppress vertical motions.   Because of this, they can act as a lid for low-level pollutants from fireplaces, wood stoves, and other sources of particles, resulting in declining low-level air quality.

If you would like proof, take a look at the air quality situation near the surface around noon. Orange and red colors are the worst, green is good.

Notice the excellent air quality at high elevations above the cloudy murk.

If you want to see further proof of how temperatures increased with height this morning, consider the minimum temperatures today around Bellingham and Mount Baker (see below).  

Below freezing and icy around Bellingham, but in the low 40s at higher elevations.


This kind of dry, frosty lowland pattern during the winter is associated with a ridge of high pressure aloft (see upper-level, 500 hPa map at 4 PM below).  Red indicated much higher heights than normal.


With high pressure aloft, near-surface winds are light and there is strong sinking aloft, causing temperatures aloft to warm by compression.  A lack of clouds with ridges allows the surface to cool by emitting infrared radiation from the surface.

This is our fog producer.

December 02, 2024

Make American Weather Prediction Great Again!


U.S. government weather prediction once led the world.
That is no longer true. 

NOAA/National Weather Service (NWS) global numerical weather prediction, once the world leader, is now in third or fourth place.  And very far behind the state of the science.

National Weather Service official weather forecasts are far less skillful than private sector predictions, such as Weather.com or AccuWeather. 

The U.S. has the largest and technically most proficient weather research community and spends more than any other nation or collection of nations on weather prediction, yet official U.S. government forecasts are lagging behind other nations and the potential of the technology.

The cost of such inferior forecasts is substantial, resulting in unnecessary economic damage and loss of life.

This blog will describe the problem and how we can regain leadership in a few years if only the necessary reforms and reorganization steps are made.

I should note that I have published extensively on this topic in the peer-reviewed literature, have been a member of several national committees on this subject, and have testified in Congress regarding U.S. weather prediction.

The Proof

There are many ways to demonstrate that U.S. government weather prediction is lagging.

ForecastAdvisor.com evaluated providers of weather forecasts for many cities around the U.S.  The situation in Seattle is representative (see below).  The National Weather Service (NWS Digital Forecast) greatly lags behind the leaders, with the WeatherChannel being number one.


U.S. global prediction by the National Weather Service (NOAA) lags substantially behind the world leader (the European Center), as shown below, and is not catching up (red is European Center, black is NOAA).   In fact, the U.S. is also behind the UK Met. Office and the Canadians as well.


Most people get their weather from smartphones today.   That forecast does not come from NOAA or the NWS.  For example, Apple iPhones used to provide the WeatherChannel forecast but now Apple does it itself combining forecasts from many sources.  

Machine learning approaches to weather prediction are exploding and have been shown to be more skillful than traditional global models.   The European Center has aggressively developed this technology and provides operational machine-learning forecasts.   
NOAA has no operational machine-learning forecasts and the American people are not enjoying the substantial benefits that would result from a more aggressive use of this promising technology.

Why is U.S. Government Weather Prediction Lagging?

The reasons are fairly clear:
  • The U.S. numerical weather prediction effort is divided, with NOAA, the U.S. Navy, the U.S. Air Force, NASA, and the Department of Energy all funding substantial efforts.   Resources are sub-optimal at each agency and uncoordinated.  All substantially lag the European Center in forecast skill.
  • The capabilities of the large U.S. weather research community are not sufficiently applied by government efforts.   This is particularly true of the university-based National Center for Atmospheric Research, which has developed an advanced global prediction model that is not used for global prediction by NOAA or other agencies.  
  • NOAA/NWS has grown a large inefficient bureaucracy for the management and development of numerical weather prediction.   Responsibilities are divided and duplication is extensive.
                          Too many cooks spoil the broth


How U.S. Weather Prediction Could Rapidly Become the Best in the World

The European Center is currently the best, but there is little reason why US weather prediction could not be much better.   Quite honestly, it is fairly clear what needs to be done.

After working on this issue for years and talking to dozens of weather-prediction scientists, and being further informed by off-the-record conversations with NOAA, Navy, and Air Force weather personnel, let me describe how rapid progress could be made.

(1)   Reduce or eliminate duplication of effort.   
        U.S. resources should be concentrated in one national developmental effort.

(2) U.S. numerical weather prediction research and development should occur in one national center, outside of NOAA or any other Federal agency.
        The key development and testing efforts should not be dominated by any one agency and should be outside of the Federal government to allow flexible hiring and firing of personnel.  The U.S. weather research community, including American universities and the National Center for Atmospheric Research (NCAR/UCAR) should be key participants.  Major private sector players should also be invited to participate. 

One group or individual should be given responsibility for success in weather prediction and nothing else.  They should be removed if not successful.

(3)   Sufficient computer and research/development resources should be made available
    In the past, grossly insufficient computer resources have been available for development and for running weather prediction models in the U.S.   In contrast, the European Center possesses vastly more computer resources.  Massive computer resources have been available to the Department of Energy and other agencies for other efforts---weather prediction needs similar priority.


(4) An organized effort to comprehensively improve weather prediction models needs to be made.

    Current U.S. weather prediction models have major flaws and there is no rational, comprehensive program to perfect them

The benefits of improved weather prediction to the American economy and for saving lives/property are profound and numerous.  There are obvious steps, such as running global models at high resolution (3-km grid spacing or less), and machine-learning-based prediction, that are guaranteed to provide rapid improvement in forecast skill.    Effective organization and reduction of duplication and waste may well SAVE money.

Better forecasts at a reduced cost.  That is what is possible.

After two decades of working on this issue, I and others have become somewhat pessimistic about the U.S. government's ability to deal with the failure mode that NOAA and other agencies have found themselves in.  A recent NOAA administrator told me of his frustration in trying to make progress, with his efforts stymied by middle-level bureaucrats more interested in turf than serving the American people.

But now, with the new administration's DOGE program, headed by Elon Musk and Vivek Ramaswamy, perhaps there is a chance that the wasteful and ineffective current approaches by NOAA and other agencies will be addressed.  This situation is EXACTLY the kind of government failure mode that DOGE should take on.
Finally, let me note that the above does not represent a criticism of scientists and developers in NOAA, DOD, NASA, or other agencies.  

I know many of them personally and most are motivated and technically proficient.  The problem is ineffective and poorly structured efforts in Federal agencies, with some administrators apparently content to foster duplication and waste, with little concern for the importance of excellence in weather prediction.

Power Outage Prediction Maps for the Friday/Saturday Storm

6 PM.  Storm becoming more threatening to Seattle northward.  Update at 8:15 PM As a new service of this blog, I will indicate the areas whe...