May 31, 2023

Wind Speed "Hot Spots' In Eastern Washington Produced by Gaps in the Cascades

This has been a very windy period over portions of eastern Washington due to a large pressure difference across the Cascades (higher pressure to the west, lower pressure to the east).

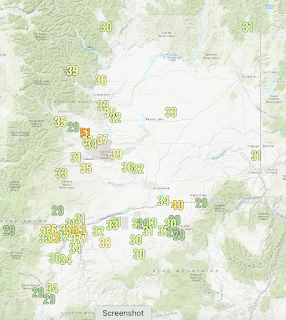
The maximum winds today since midnight  (see below) reached 51 mph near Ellensburg.  Winds were mainly strong near and downstream of Ellensburg and east of the eastern terminus of the Columbia River gorge.


A model forecast for this afternoon shows the two main wind plumes over eastern Washington.  One east of Cle Elum and Ellensburg and the other downstream of the Columbia Gorge (stronger winds shown by the blue and greenish colors).


So why are the strong winds in eastern Washington localized?

It has to do with the variable height of the Cascades and specifically two lower areas in the north-south barrier.  Below is a terrain map for Washington and northern Oregon, with the green colors representing lower elevations.  Note there are two lower regions across the Cascades:  a near-sea-level Columbia Gorge between Oregon and Washington, and the "Stampede Gap" region of the central Cascades (with lowest elevations around 3000 ft), which also includes Snoqualmie Pass.

 Both are indicated by red arrows.


When a large pressure develops across the Cascades, with higher pressure to the west and lower pressures to the east, winds surge through these gaps, creating two major westerly wind swaths over eastern Washington.  A minor wind swath can also be produced downstream (east) of Stevens Pass.

The winds exiting these Cascade gaps strengthen during the evening after the daytime heating in eastern Washington causes the pressure to fall there (and thus increasing the pressure difference across the Cascades0. To illustrate, below are the winds forecast for this evening (in mph)...a lot more greens in eastern Washington, which means stronger winds.


With cool/high pressure to the west of the Cascade crest the last few days, the pressure pattern has been very favorable for consistent westerly winds over the wind turbines of eastern Washington, producing consistently high wind energy availability (see the Bonneville statistics below, wind plus solar shown by the green line).


As noted in my earlier blog, the total of wind and solar is roughly one-third of the demand
 (red line).  Hydro generation (blue line) has been allowed to decline because of the bountiful wind energy.

The latest forecasts suggest the west side will warm and wind energy will thus decline substantially over the next few days.

May 29, 2023

Unusually Cool Weather in the West Means Lots of Wind Energy in the East

 This is a good time to charge up your electric car...particularly during the evenings.

The reason?  

Unusually cool weather is forecast for the next few days in western Washington and Oregon.  Seattle will be firmly into cool, marine air the next few days, with highs only reaching the LOWER 60s.

In contrast, it will remain warm over the Columbia Basin, with 80s for the first part of the week, climbing into the 90s by week's end.

This pattern is very favorable for producing healthy westerly winds along the eastern slopes of the Cascades and across the wind farms east of the Cascade crest.

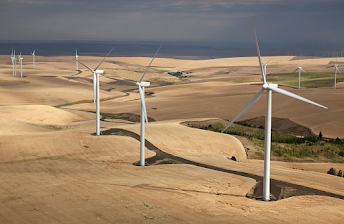
Taken by Jeffrey Katz

The sea level pressure (solid lines), surface winds, and low-level temperature (colors) forecast for 2 PM Tuesday (below) show the story.  High pressure and cool temperatures (green) offshore, warmer temperatures (orange and red colors) east of the Cascade Crest.  You will notice a large pressure difference across the Cascades, which will produce strong winds over the east of the barrier.

A similar, but attenuated, version of this situation was in place today (Monday) and winds were gusting to 30-40 mph around Ellenburg and other eastern slope locations (see max gusts on Monday below).


Even stronger winds will occur on Tuesday and Wednesday.    The result will be lots of wind energy generation.  The Bonneville Power summary shows increasing wind generation the past few days (green line)...getting to roughly one-third of demand (red line).   Will do even better tomorrow and Wednesday.


Wind energy generation in our region is unfortunately out of phase with demand.  When we have mild temperatures--and little need for AC-- there is lots of wind energy.  But when we really cook, wind energy is quite small since the westerly winds are absent then.

The cool temperatures in the west won't last forever.  The latest forecast suggests that we will warm up to near-perfect temperatures in western Washington by next weekend.


And relatively toasty (upper 90s) over the Columbia Basin


May 27, 2023

Rapid Snowmelt has Filled Local Reservoirs

 In mid-April, Washington State snowpack was near normal, while snowpack to the south was well above normal.

Then Washington experienced much warmer than normal temperatures in late April and May, as illustrated by the temperatures at Olympia below (normal highs are shown by the purple line)

The result of the warmth was a massive melt-off of the Cascade snowpack that has surged into local reservoirs, filling them to normal levels.

For example, consider the Yakima Reservoir system, so important for eastern Washington agriculture (see below).  Over two weeks of May, the reservoirs went from below-normal to normal levels.


Or take Seattle's situation.  Just like the Yakima reservoir system, with a very fast increase to normal levels during the past month.


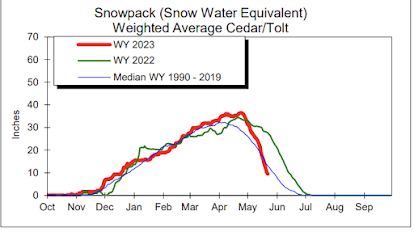
Seattle's snowpack in the watershed feeding its reservoirs is shown below.  Wow.  A precipitous decline!


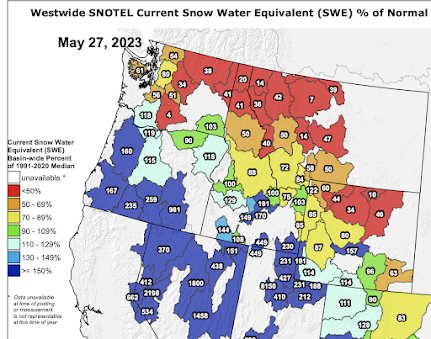
To really appreciate the snowpack decline, below are the last snowpack percentiles around the Northwest. Down to 35% or less in areas of eastern Washington.  But bountiful snow remains over southern Oregon and south.


The key issue has been temperature:  while Washington has been MUCH warmer than normal, California has been normal or colder than normal (see the proof below)


This pattern (warm north, cool south) has been very favorable:  it has slowed the melting of the massive snowpack over California, preventing disastrous flooding and potential damage to reservoirs/dams over the Golden State.

The forecast for the next ten days?  

You won't believe it.  More of the same (see the European Center forecast, showing the prediction temperature anomalies from normal for the next ten days).  Warm north, cool south.  Again.


California is going to be saved from major flooding, which is very good news.

May 25, 2023

What does it mean when you see "Castles in the Sky"?

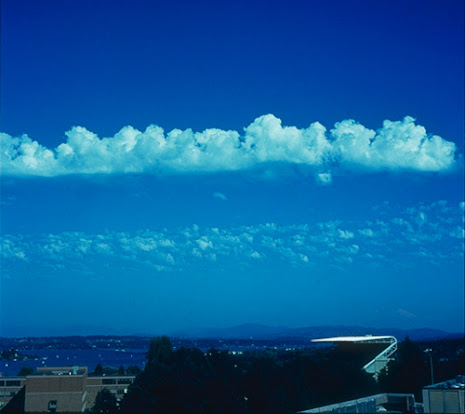
During the last week, we have seen a number of beautiful examples of mid-level cumulus convection, technically known as altocumulus castellanus, or less technically known as castles in the sky.

The sky on Saturday evening in north Seattle was stunning.

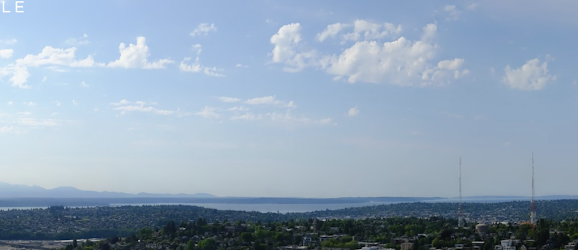
And earlier that day one could view cumulus cells forming several thousand feet above the surface (image from the Seattle PanoCam).


Below is a nice example of such clouds near the UW taken by cloud expert Art Rangno decades ago.


Altocumulus castellanus clouds provide potent hints about what is happening in the atmosphere, as well as potent information for short-term forecasting.

Let me tell you about it.

Altocumulus castellanus clouds generally form between 6000 and 20,000 ft and indicate mid-level instability:  the tendency for the atmosphere to mix vertically, driven by large differences in temperature with height.

We call such instability convection, and if there is sufficient moisture, the upward motions produced by the instability result in cumulus clouds.

If you ever prepare hot cereal, you have viewed convection in your saucepan, with the oatmeal moving up and down, driven by the heating at the bottom.


Large-scale upward motion associated with an approaching weather system can help initiate and support the mid-level convection--so the existence of altocumulus clouds provides a strong hint of potential weather action in the future.

The altocumulus clouds aloft also indicate mid-level moisture, which is also helpful for thunderstorm formation.  Furthermore, when convection associated with surface heating extends upward to reach a layer of castellanus clouds, deeper, more intense convection and thunderstorms can occur.

Storm chasers in the midwest often look for altocumulus castellanus clouds as a favorable sign for future severe thunderstorm development, and many Northwest thunderstorm events have been preceded by "castles in the sky."


But no matter what, such clouds are often extraordinarily beautiful. 

More like an exquisite impressionist painting than a meteorological phenomenon.


__________________

Note:  I will do a special online Zoom session this Saturday (May 27th) for my Patreon supporters.  Will talk about the summer wether forecast and answer your questions.

May 23, 2023

Are the Large Alberta Fires the Result of Climate Change?

During the last few weeks, large fires have initiated and grown over northern Alberta, resulting in massive smoke plumes (see the image below from one week ago).   Here in Washington State, we experienced a few days of smoke aloft from these fires last week.


I have received a number of emails asking whether such Alberta fires are unusual for this time of the year and whether global warming (climate change) could be the cause.

In addition, several media outlets have published headline articles about the topic, suggesting that human emissions of greenhouse gases were the main cause.


It turns out that reality is more complicated.   

May is typically the biggest month for Alberta wildfires, there is little upward trend in Canadian wildfires, and anthropogenic greenhouse gas emissions are a very small part of the story.

Canadian Wildfire Statistics

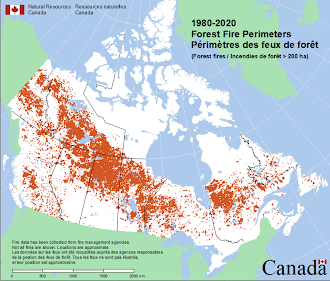
Based on an official Canadian government wildfire database, here is a map of Canadian wildfires from 1980-2020.  Alberta wildfires are generally found over the northern half of the province, which includes large areas of boreal forest and grassland.


What is the long-term trend of Canadian wildfires?  Increasing due to global warming?  

Perhaps surprising to some, the answer is no (see below).

For all of Canada, the number of fires is DECREASING, and there is no obvious trend in the area burned.


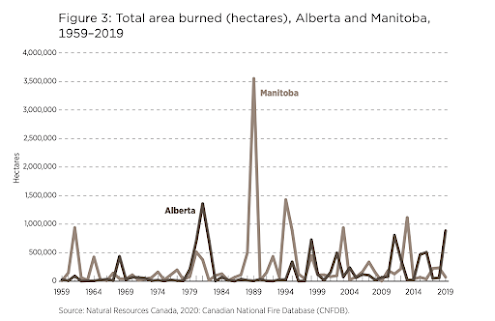
What about Alberta, where the current batch of wildfires are burning?

Lots of variability but little upward trend (see below).  The biggest fire was in the early 1980s.


The lack of a long-term trend in wildfires is important:  one WOULD expect an upward trend if global warming/climate change was a significant contributor.

Some folks have argued that having big Alberta fires in May points to global warming.  They suggest that it is warming so fast that wildfires are occurring early!  

But folks making such claims need to look at the data.  Historically, May is the month of the most frequent wildfires in Alberta.  (a graphic from a paper on trends in Alberta wildfire below).
     

Furthermore, many of Alberta's great wildfires occurred in May, such as the huge Fort McMurray fire in early May 2016 and 2011 Great Slave Lake fire of 2011.

But why is May such a big month for northern Alberta wildfires?

It has to do with surface fuels.  After a long, cool/wet winter, there are a lot of dead fuels (e.g., dried grass, annuals) from the previous year that are on the ground after the snow has melted.  Such light fuels dry very quickly during the first warm weather and are ready to burn in early May.

But the optimal burn season is limited in time.  Only a few weeks later, there is a greening of the surface vegetation (grasses start to grow, annuals sprout leave) and such greening REDUCES the flammability of the surface fuels.  Which side would you expect to burn in the picture below?


There is a short favorable May window for large Alberta fires before the greening.    But to take "advantage" of it you need favorable drying conditions, which are associated with a strong, upper-level ridge of high pressure over the region.  And strong winds and lightning are favorable as well.

Furthermore, rainfall peaks during the summer (see monthly precipitation in Edmonton below).


The setup for the fires earlier this month was nearly perfect. In early May, an intense ridge of high pressure developed over southern Canada (see a plot of the difference from normal heights at 500 hPa pressure below for 1-15 May). Red and orange indicate MUCH higher than normal pressure in the lower atmosphere (around 18,000 ft).

Such high pressure resulted in intense drying and warming that helped dry the surface vegetation before greening occurred.  There is no evidence that such a pattern is the result of climate change.
There were periods of strong, dry winds in early May due to the large pressure gradient at the edge of the high pressure at lower elevations (see example below on May 6).  Strong wind is a primo accelerator of fire.


You can understand the situation by looking at the observed weather at Edmonton Airport from late April to early May (below).   Rainy and around 60F in late April, then rapid warming and wind on April 30th with a jump to 85F on May 1, followed by 86 and 88 on May 3-4.   

Perfect weather to dry out the surface fuels, followed by lightning at the high pressure shifted eastward.  Human ignitions are also distinct possibilities.


In summary, there is little evidence that the Alberta wildfires represent a climate event.  

Intense drying weather occurred exactly when the surface fuels were most vulnerable before greening.  May is typically the month of the biggest Alberta fires for a reason and the smoke that reached the Northwest aloft from the fires was simply the result of a favorable wind pattern aloft (easterly flow), not the results of a slowly warming planet.

__________________

Note:  I will do a special online Zoom session this Saturday (May 27th for my Patreon supporters).  Will talk about wildfire meteorology and answer your questions.

May 22, 2023

Northwest Weather Workshop Online


Several of you have asked me about viewing the presentations at the recent Northwest Weather Workshop. 
 

Well, you can!

The meeting was recorded and if you want to view any of the sessions, feel free to check out the zoom links below.   

The agenda is found below and here: https://a.atmos.washington.edu/pnww/index2023.php?page=agenda


Friday, May 12


https://washington.zoom.us/rec/share/GGu7tIz75jrev8WV0A2b88xxBr8DZoVw03meJzhsnFyb45Dd8AkNP7-Kq6Aop5xq.v63DWYCddGskqgFl?startTime=1683919622000

Saturday, May 13

https://washington.zoom.us/rec/share/LVLwZWkxHGJz3kZXYYjxLWtTbD_XrjPSJD_rqILiBDqnnAF_XEw4RJ37Y92N04al.DDK6krV5QUZSJ5cO?startTime=1683990927000


Northwest Weather Workshop 2023

Sponsored by the NOAA/NWS, the University of Washington, and the Seattle and Portland Chapters of the American Meteorological Society.  Online.

Friday, May 12, 2023

1:00-1:10 PM    Welcome and Meeting Details

Special Presentation

Session 1:  Heavy precipitation and atmospheric rivers over the West Coast

1:10-1:30 Summary of west coast atmospheric rivers of 2022/23F. Martin Ralph Director, Center

 for Western Weather and Water Extremes (CW3E) - UC San Diego

1:30-1:45  The Great West Coast floods of 1861-62 compared to last winter – what’s the

 difference? Larry Schick Center for Western Weather and Water Extremes (CW3E)

1:45-2:00 Usage of Satellite data to detect heavy precipitation and flooding events in British

 Columbia and California. William Straka III, CIMSS/NOAA/LEO

2:00-2:15 PNW Water Year Impacts Assessments.  Karin Bumbaco and Crystal Raymond,

 Office of the Washington State Climatologist, CICOES, University of Washington

2:15-2:30  Development of an Impact Based Storm Rating Scale for Decision Making in a         Warming World:   Demonstration using Major Extratropical Cyclone-Atmospheric River         Storms between 2020-2023.  Melinda M Brugman, Alex Cannon and the         ARkSuperStorm team

2:30-2:45 Coastal Flooding in Western Washington and the December 2022 event. 
        Kirby Cook, Science and Operations Officer

2:45-3:00 What we have learned from the Olympic Mountains Experiment (OLYMPEX) about         precipitation processes in complex terrain. Lynn McMurdie, University of Washington

3:00-3:30 PM  Refreshment Break

Session 2:   Snow and Avalanche Forecasting

3:30-3:45  The Meteorology of Avalanche Forecasting. Dallas Glass
        Deputy Director- Avalanche Forecaster, Northwest Avalanche Center

3:45-4:00   Impact-Based Decision Support Service Ahead of Record-Breaking Pacific Northwest Cascade Snowfall, Charlotte Dewey, National Weather Service, Spokane,         Washington

4:00-4:15   The Surprise Portland Snowfall of Feb 22...What did Satellite Products and

         Analysis Show. Sheldon Kusselson, Cooperative Institute for Research of the         Atmosphere (CIRA)/Colorado State University      

Session 3:  Wildfire Forecasting and Smoke

4:15-4:30  Tracking wildfire smoke with lidar-ceilometers.  Phil Swartzendruber, Puget Sound         Clean Air Agency  

4:30-4:45   Update on our Geostationary GOES-R Capabilities for Tracking Fires and Smoke.         Mike Stavish, Science and Operations Officer, WFO Medford

  4:45-5:00 Research Support for Crisis Strategy Prescribed Burns. Marlin Martine, Brian         Potter, Andy Chiodi, Joel Dubowy, Aaron Rowe, Vaughn Cork, Steve Bodnar, Ernesto Alvarado Sim Larkin, Susan O'Neill, Tony Bova

6:00-9:00 Workshop Banquet at Ivar’s Salmon House, Seattle

Banquet Talk: Mathew Dehr, Meteorologist, DNR

Washington's Outlier Wildfire Seasons and Events: A climate and weather perspective.

6:00-7:00 PM Icebreaker – no host bar

7:00-8:00 Buffet Dinner

7:45-8:30 Presentation

Saturday, May 13, 2023

9:00-9:10AM  Welcome

Special Presentation

9:10-9:25  Future Directions of the American Meteorological Society.   Dr. Brad Colman, President, American Meteorological Society

Session 4:  Northwest Climate and Weather

9:25-9:40  Extreme Weather Events in WA State: Variations and Trends. Nick Bond and Karin

Bumbaco. Office of the Washington State Climatologist, CICOES, University of Washington

9:40- 9:55 Observed and simulated characteristics of down-valley flow within stratiform

         precipitation over the Olympic Peninsula. Robert Conrick, Joe Boomgard-Zagrodnik         (presenter), Lynn McMurdie

9:55-10:10  Why was the June 2021 Heatwave so Severe?  Cliff Mass, David Ovens, Robert

         Conrick, and John Christy.

10:10-10:25 Future Climate Simulations for the Salish Sea Using Dynamically Downscaled

         Atmospheric Projections/ Eva Gnegy. UBC - Dept. of Atmos Science1; Fisheries and         Oceans Canada (DFO)2


10:25-10:55  Refreshment Break

10:55-11:10        Regional Climate Modeling.  Eric Salathe, UW Bothell

11:10-11:25        A recap of the Feb 22, 2023 Portland SnowstormTyler Kranz, Lead         Meteorologist, NWS Portland

Session 5:  Regional weather prediction and communication

11:25-11:45   The UW Dawgcast.  Shannon O'Donnell, KOMO TV and UW

11:45-12:00 Update on the Northwest WRF Modeling System.  David Ovens and Cliff Mass

12:00-1:00 PM Lunch

1:00-1:15   Managing a Weather Social Media Site,  Justin Shaw, SeattleWeatherBlog

1:15- 1:30   National Weather Service Social Media Outreach.  Logan Johnson, MIC, and Jake DeFlitch, NWS Seattle

1:30-1:45  Weather Support at Alaska Airlines.  Michael Snyder, Alaska Airlines

1:45-2:00  The High-Amplitude Gravity/Wind Event of May 2, 2013.  Anthony Edwards,

        Atmospheric Sciences, University of Washington

2:00-2:15  Rotating Convection Near Terrain.  Steve Businger and Terrence J. Corrigan Jr., University of Hawaii.

2:15-2:30 PM.   Video Weather Highlights, 2022-2023.  Greg Johnson, Skunk Bay Weather
May 20, 2023

Meteorological Role Reversal: Much Wetter East of the Cascade Crest

It is simply unnatural.

Contradictory to local weather wisdom.  Contradictory to the normal state of affairs.

But it's true. 

For a number of days, it has been much wetter east of the Cascade crest than over western Washington and Oregon.
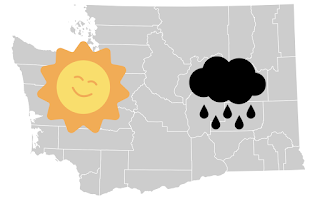
Consider the total rainfall over the past three days (see below).  Numerous precipitation reports on the eastern side of the Cascades and only a few precipitation events over western Oregon and Washington.


Most of the precipitation over eastern Oregon and Washington was the result of convection--thunderstorms.  To show this, here are the lightning strikes on Wednesday and Friday.


Day after day, fairly intense thunderstorms have developed over the high plateau of eastern Washington and along the eastern slopes of the Cascades.  To illustrate, here is the radar image from 5:30 PM today (Saturday), with red indicating very heavy rain.   

Wow.   Lots of serious thunderstorm activity east of the Cascades.


Why so much wet action east of the Cascades, while western Washington has been dry?

Good question.

As illustrated by the upper-level map for Wednesday at 8 PM, we have had a weak ridge of high pressure/heights over us.  This feature steers away approaching Pacific storms and fronts, working against rain in western Washington.    This pattern has also resulted in weak onshore flow, that has brought cooler marine air into the lowlands west of the Cascade crest.


Such low-level cool air is bad for producing instability and thunderstorms.  Thus, western Oregon and Washington have had few boomers. 

But eastern Washington and Oregon, have the Cascades to block the problematic cool air, leaving the door open to thunderstorms.   Low-level warming is aided by the high pressure, which facilitates a large change in temperature with height---good for thunderstorms.  And the warming of the surface by the sun is very strong now--also helpful for thunderstorm generation.

Tomorrow's model precipitation forecast suggests more of the same for eastern Washington and Oregon.  Western Washington should be cooler and cloudier on Sunday as the influx of cool, marine air increases.

Finally, all this rainfall on the eastern side of the Cascades, plus the melting of an ample Cascades snowpack (thanks to the cool spring) has led to a startlingly fast rise in the reservoirs feeding the Yakima River system (see below).  Good water prospects for agriculture.


El Nino is Rapidly Collapsing

 It's finally happening.    The pesky El Nino, with warmer than normal surface waters across the central and eastern tropic Pacific, is ...