September 30, 2022

How has hurricane prediction skill changed? And a very warm, dry weekend ahead.

There has been a great deal of interest in hurricane prediction this week with the landfall of Hurricane Ian, so this week's podcast discusses progress in hurricane forecasting. 

The story is a nuanced one.  Hurricane track prediction has gotten much better over the past decades, with position errors at 72h decreasing by roughly 75%! (see below)

But on the other hand, the intensity forecasts, although improved, have not advanced anywhere as much as the track predictions (see below).


In my podcast, I explain why the difference in skill between track and intensity forecasts, telling you about some of the challenges.

And I also talk about the forecast for Hurricane Ina.  The European Center and UKMET office models did far better than the U.S. model for the 3-6 day forecast, but amazingly BOTH forecast a major storm in the area NEARLY TEN DAYS OUT (see below for the proof).

US Model 20 day forecast

European Model 9 days out

And in the first segment, I provide the forecast. Warm, dry, and nearly perfect for any outdoor activity. Yes, this is one of the warmest, driest early falls on record.

And it is not over yet.  Details in the podcast.

To listen to my podcast, use the link below or access it through your favorite podcast service.


Some major podcast servers:

 HTML tutorial HTML tutorial
Like the podcast? Support on Patreon 


September 28, 2022

European Models Provide Far Better Forecasts than U.S. Models for Hurricane Ian

European weather prediction models proved to be substantially superior to U.S weather prediction systems predicting the track of Hurricane Ian.

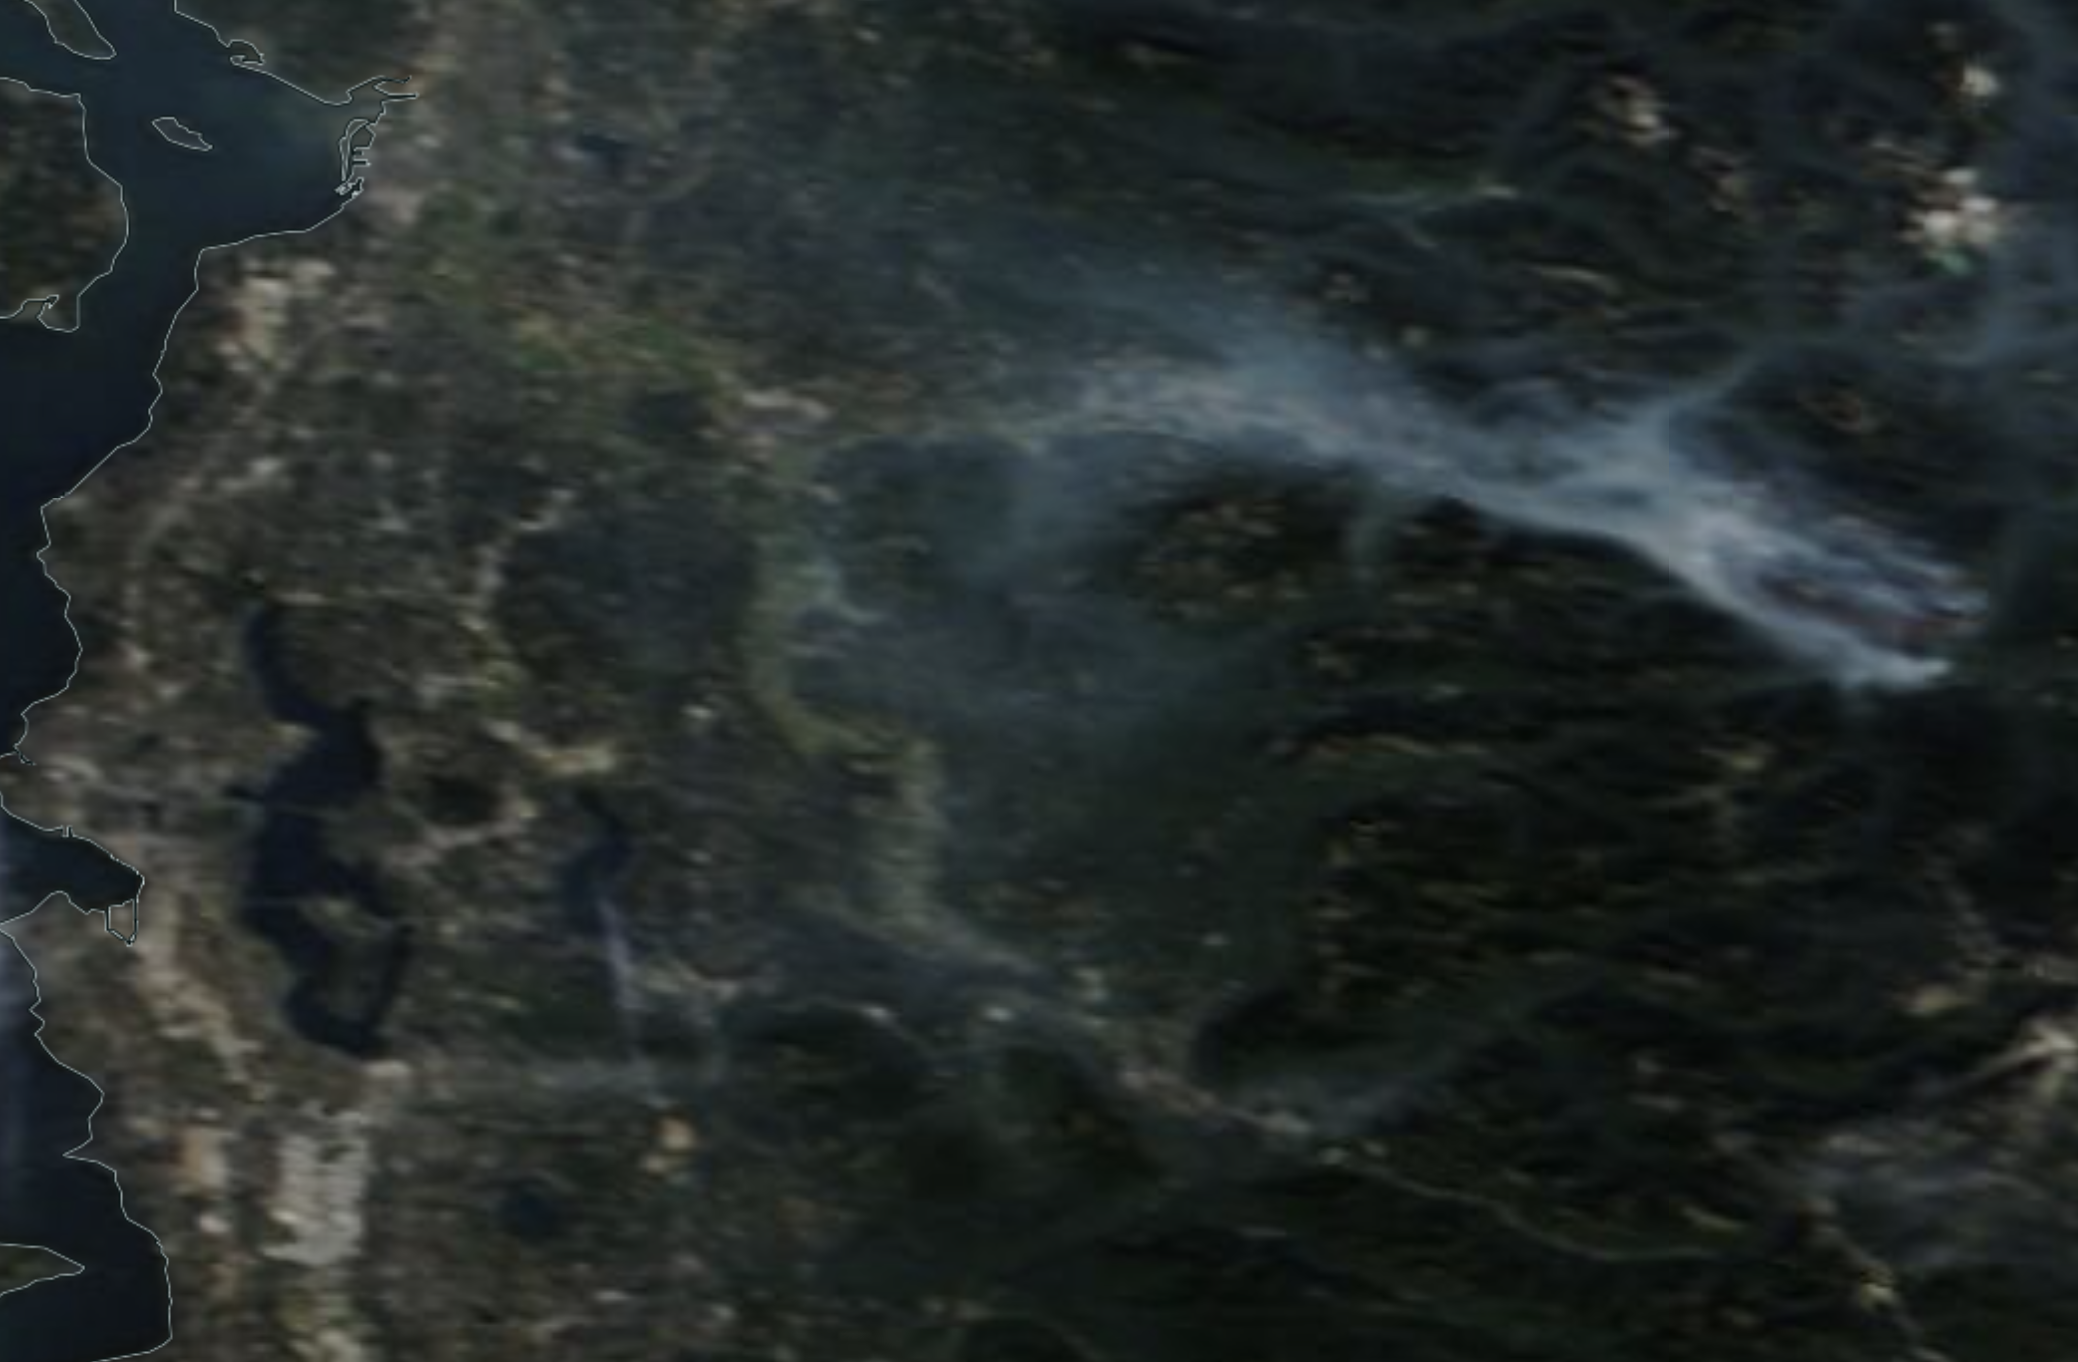
Weather radar image near the time of Ian's landfall on the 
west coast of western Florida today.

This is an issue I have blogged about and written papers about in the past, with the most well-known past case being Hurricane Sandy in 2012.  

And it reflects the decline of U.S. national weather prediction skill versus leading international centers--a situation that is a national embarrassment and must be fixed.

Let me show you the unfortunate details for Hurricane Ian.

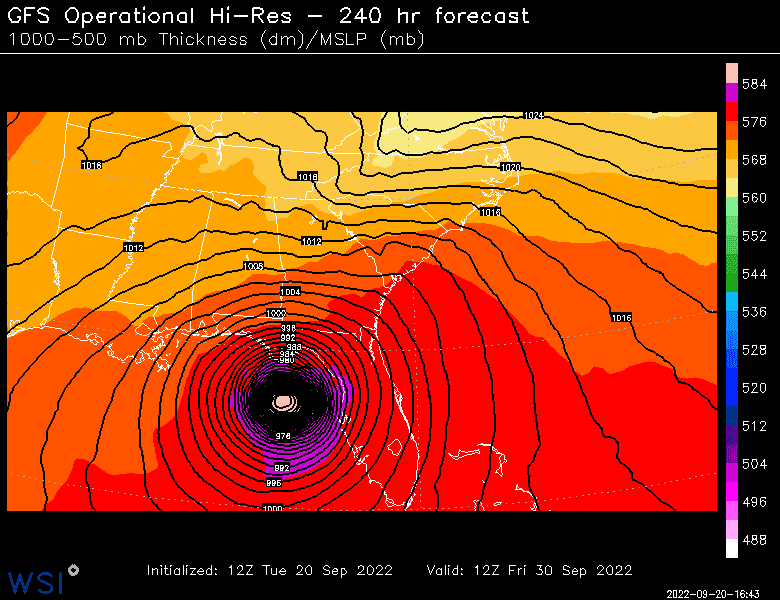
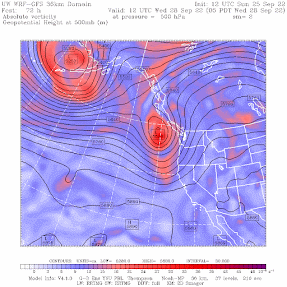
I will start with a graphic of forecast track error by Professor Brian Tang of the University of Albany (website here).  This figure presents the track error (in km) for various forecast lead times.

The main US global model (the GFS) is shown by the dark red color (AVNO), while the leading weather prediction center in the world (the European Center) is shown by blue (ECMF).  The high-resolution US hurricane models (HWRF and HMON) by purple and cyan, and the official forecast (with human input!) by the black line.

For the short-term forecasts (24 or 48 hr) everyone was on the same page.

But look at the extended forecasts (96 and 120 hr)!  OMG.  The European Center was the clear winner, with roughly HALF the track error of the US global model.

Furthermore, it is very concerning that the U.S. high-resolution hurricane models (HWRF and HMON) had even larger track errors.

 High resolution doesn't do you much good if you get the storm in the wrong place!

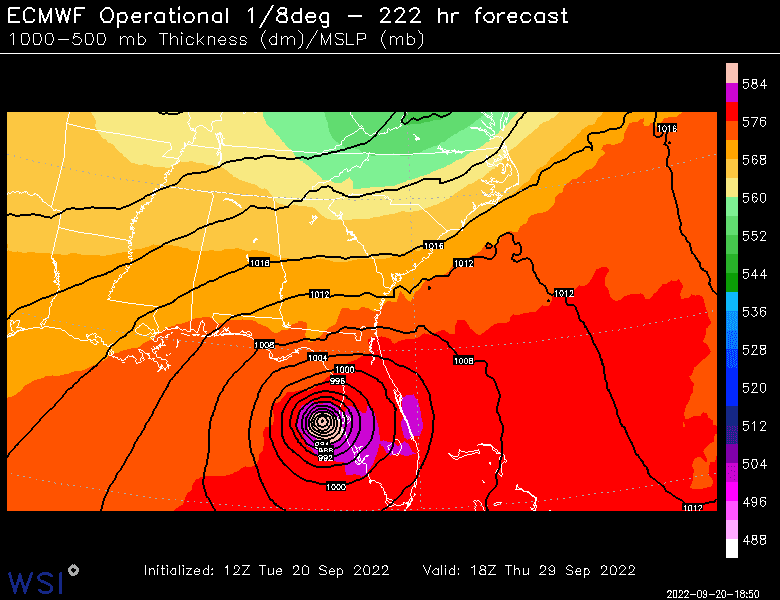
Let me show you the problem spatially by presenting the tracks of the U.S. and European ensembles of many forecasts, with each forecast providing a track of the storm.  

Below are the forecasts starting at 0000 UTC 25 September (Saturday at 5 PM PDT), with the black lines showing you the mean track of all the forecasts).  (imagery courtesy of weathernerds.org)

The European Center forecasts were very good, suggesting landfall on the central and southern western coast of Florida.  South of Tampa.  Quite close to the actual landfalling position (as shown by the radar image above)


In contrast, the US GFS ensemble was displaced much more to the west (which was wrong).  Much more spread (uncertainty).  The U.S. forecasts were MUCH more threatening to Tampa, since a storm making landfall north of Tampa could push water into the bay.


As a result of the problematic U.S. forecasts, the media went nuts talking about a catastrophic storm surge in Tampa, with calls to evacuate hundreds of thousands of people.  And people down the coast were not warned of a serious threat.


I wish this was an isolated case, but it is not. 

U.S. global weather prediction is not as good as some major international centers, and the cost to the American people is enormous (can you imagine the costs of all the evacuations in Tampa, for example).

The U.S. has the largest and best weather research community in the world. We spend more on weather prediction than anyone else.  Yet, our forecasts are not as good as others.  And a shadow of what we are capable of.

I have written a new paper describing the origins of the problem.  It is a problem of organization, of duplication of efforts, of no one group or individual being responsible, and a lack of a coherent system for improving our weather models.  

And it will take the active intervention of Congress to fix it.

September 26, 2022

Was This the Driest Summer in Northwest History?

A dry Pacific Northwest in July and August is the normal state of affairs, but this year was particularly arid.

Some media outlets have claimed this is Seattle's or the region's driest summer on record.  Is that true?

Let's find out.  

At Seattle's SeaTac Airport, this summer (June 21-September 21) was the driest in a record doing back to the late 1940s (.50 inches).  2017 was right behind (.52 inches).  


What about a nearby station with a longer record (Kent), going back to 1912?  That is shown below with a trend line.  2022 was the driest summer on record but some came close in the 1925-1945 period.  The trend shows a slight decline (maybe a half-inch) over 110 years.  The very small long-term trend will turn out to be important.


What about east of the Cascades?   This is important because of the agriculture there and the frequent wildfires.   A different story from the west.  

Spokane (going back into the late 1800s) was dry but six other years were drier.

And Kennewick, also with a record going back into the late 1800s, was not exceptionally dry at all, with 29 years more arid.


So what can we conclude?  Western Washington was exceptionally dry this summer. The driest on record for many stations.  But there is only a minimal trend toward more dryness west of the Cascade crest.   Eastern Washington had a dry year, but it wasn't exceptional.

Let me stress, there is only a slight trend toward drier summers in our region.  

That is important, because if climate change is the cause of the dry conditions you would expect to see a long-term trend.  If a very dry summer like this year was caused by climate change, there would be a long-term trend towards much drier summers.  There isn't.  

What do climate models suggest?   Here at the UW we are running high-resolution regional climate models driven by a collection of global climate models.  This is the gold standard of such work.

Here is the prediction for summer precipitation (in this case June-July-August) for Seattle and Pasco driven by a VERY aggressive increase of greenhouse gases (the RCP 8.5 scenario) for 1970-2100.  Climate models suggest VERY little change in summer precipitation through 2022 for either station.  For Seattle, there is a slight decline in precipitation by 2100.  Virtually no change in the Columbia Basin.

So what should you conclude from all this?  

We had a very dry summer in western Washington.  But there is little overall extended trend, but plenty of variability that is probably natural in origin.   This is supported by climate model simulations that show little change in summer precipitation even with large increases in greenhouse gases.


________

Atmospheric Sciences 101

Like last year, I am teaching atmospheric sciences 101:  a general introduction to weather and climate, this fall.  You can learn more about the class on the class website.  I talk about everything from the basics of the atmosphere to weather prediction, thunderstorms, hurricanes, and local weather to global warming and climate.

I will be teaching the class in person at the UW, but will also make it available over zoom.  Thus, folks can take it remotely.

If you are over 60, you can take the class through the ACCESS program for a very nominal charge (something like $15).   Last year I had over 125 folks do so.

So if you are a UW student looking to learn about weather or a non-student interested in the topic, I welcome you to join me this fall.  My first class is on September 29th.


September 25, 2022

The Rain Cometh

The number one question I have been asked the past few weeks is certainly this:  when will the rain return?

And I can answer that now: the middle of this week.

Today was another nice warm day, with the origin being a strong upper-level ridge over the West Coast (see upper level map at 5 AM this morning, below).  Yes, another ridge.

This ridge was associated with low level easterly flow that pushed more of the smoke from the smoldering Bolt Creek fire into some communities on the eastern side of Puget Sound country (see noon satellite image below)


You can view the air quality implications wutg  the Purple Air map around 3 PM (orange and red are worst).   Not as bad as last week, but some haze is apparent on the east side.   Some have smelt smoke.


Tomorrow will be the last warm day in the sequence.   Everything changes on Wednesday, as a moderate upper-level trough moves in (see upper-level map at 5 AM Wednesday).  And it won't be the last.


Light rain is forecast for Wednesday into early Thursday, with much cooler temperatures.  The map below whows the 24-h totalys ending 11 AM Thursday.    Typical early fall precipitation event.


It will dry out for a few days after that and then another system is expected next Tuesday (see 24-precipitation ending 5 AM Wednesday)

The summer has been drier and warmer than normal, something I will discuss in a subsequent blog.  Enjoy the warmth while you can....


September 23, 2022

The Perfect (Smoke) Storm and the Weekend Weather Forecast

Here in Seattle, the smoke was amazingly thick on Wednesday morning, only exceeded by the extreme event of Sept. 2020 and equaled by the smoky period in summer 2018 (see small particle levels at Lake Forest Park over the last 5 years ago).


The intense smoke was associated with a dying fire (Bolt Creek) in the Skykomish Valley.  

How could this be?

The explanation is found in my podcast (see below).  The "perfect storm" of meteorological conditions.

And talking of perfect, consider the weather conditions over the Northwest this weekend.

ANOTHER ridge of high pressure will develop over the West Coast this weekend (see upper level map , 500 hPa--about 18,000 ft late Sunday below).  And you know what that means.... warmth and sun.


But this time of the year we can't get really hot...so highs will only get into the upper 70s in the west.  Nearly perfect.  It won't last though...cooler temperates for mid-week, but little rain in the forecast.  My podcast goes into the details.


To listen to my podcast, use the link below or access it through your favorite podcast service.


Some major podcast servers:

 HTML tutorial HTML tutorial
Like the podcast? Support on Patreon 


September 21, 2022

Air Quality Worsens Over Puget Sound this Morning

 I walked outside this morning in north Seattle around 6:45 AM and the smoke smell was very strong.   The expected worst (and last) day of the smoke is here and it is nasty.

The Seattle PanoCam this morning at sunrise clearly showed the shallow smoky miasma over the city.  Even the tops of some of the tall buildings are above the worst of it.  


 The calibrated Purple Air air quality sensors this morning shows the plume of terrible surface air quality exiting from the Skykomish Valley from the Bolt Creek fire, which then heads south over Seattle.   Purple colors indicate truly bad air quality.   Red is just bad.    The plume is relatively narrow...head east or west and you can get out of it.


The Puget Sound Clean Air Agency has a ceilometer in Marysville that shows the vertical structure of the smoke plume at that site (which is a bit north of the worst of it).  The graphic (shown below) shows that the worst of it (yellow colors) was down low and moved in last evening.  Yuk.

The latest high-resolution visible satellite image around 7:30 AM really shows the smoke from the Bolt Creek fire exiting the Skykomish Valley and spreading out over northwestern WA:


So what is going on and when will it stop?

The Bolt Creek fire is really not spreading but is smoldering in the interior.  This has gotten worse during the past few days as temperatures have risen and relative humidities have plummeted.   

Here is a plot of the relative humdity and moisture content of small dead fuels at the nearby Johnson Ridge RAWS site.  Yesterday, relative humidity dropped to around 10% and fuel moisture to roughly 6 %.

These are favorable conditions for fire.


The fire-favorable conditions have been driven by easterly (from the east) flow that unforunately pushes smoke into western Washington as well.

And the clear skies aloft and longer nights allow cooler/smoky air to settle into lower elevations and not mix vertically.   That is why conditions worse overnight.

But there is good news ahead.  Solar heating today should help mix the smoke through a larger volume of air reducing surface smoke concentrations.

Tonight, the pressure difference across the mountains will reverse, and cooler ocean air will move into the west.

Smoke time will be over for western Washington.  Unfortunately, that is not good news for the eastern slopes of the Cascades.

To illustrate, here are the near-surface smoke forecasts (from the NOAA HRRR smoke system) for this morning and tomorrow morning.  Good for Seattle, bad for Leavenworth.


So if you are sensitive to smoke and leave in Puget Sound.....wait a few hours before taking that walk or run.  If you are living in east Washington....you better get your exercise in today....


September 19, 2022

Smoke Plume from the Bolt Fire Invades Western Washington

A narrow plume of relatively dense smoke from the Bolt fire has been pushing into western Washington the last few days.

And today may be the worst of the period.

The 11 AM surface air quality network run by Purple Air shows the smoky air (red colors are the worst) moving westward out from Steven Pass highway into Everett and north Seattle.  I can smell the smoke here at the UW.


The high-resolution visible satellite image this morning clearly shows the plume of smoke following through the relatively narrow Skykomish River valley and spreading out as it hits the lowlands.


Near sunrise this morning, the smoke plume was apparent looking northward by the Seattle PanCam.

Although not spread horizontally, the Bolt Fire is still smoldering and burning internally, producing significant smoke, as evident from WSDOT cams on Route 2.


The meteorology is interesting.

Cool air produced by the longer nights drains into river valleys (like the Skykomish) and then jets out into the lowlands, injecting the smoke into populated areas each morning (see plots of the amount of particles in the air above Monroe, WA the past few days).  Later in the afternoon, increasing mixing by convective mixing (produced by surface heating) tends to dilute the smoke concentrations.


The meteorological "problem" is that we have a very weak pressure pattern over us right now, with little clean, onshore flow (see weather map for this AM, showing sea level pressure).


Tuesday won't be much better, but the pressure pattern should change on Wednesday afternoon, with much more onshore and northwesterly flow moving in.


September 18, 2022

Major Alaska Storm, Unusual Rain and Low Pressure ove Northern California, and Dry Northwest. Are They Connected?

 There is a lot of weather happening in the eastern Pacific.

First, an unusually powerful low-pressure center, with intense rain and hurricane-force winds, is hitting northwestern Alaska (see surface pressure map at 11 AM Saturday).  A deep, 963 hPa low center.   This storm developed out of Typhoon Merbok, which underwent extratropical transition:  converting from a tropical storm to a midlatitude storm.

This storm will weaken rapidly today as it moves into the Arctic.

And then there is the upcoming California event.  By this morning at 5 AM, a very significant low-pressure center will develop west of the Bay Area and will hang out there for a few days.

As a result, there will be relatively heavy precipitation over northern CA, particularly for this time of the year: 1-2 inches in some places (the total precipitation through Wednesday morning is shown below).


Such an event is very well timed to lessen the chances of autumn wildfires in the area and to damp down the fires that are burning today.  But Washington State will be relatively dry.

The interesting thing is that the Alaska Low, the previous Typhoon Merbok, and the California low/rain may well be all connected.

The typhoon moving northward interacted with the midlatitude jet stream...the current of strong winds moving west to east.  Near the jet stream, the typhoon joined forces with a weaker low-pressure area to create the superstorm that hit Alaska.

The superstorm pushed warm air in front of it, helping create a ridge of high pressure off our shores, which in turn helped to produce a low off California.

Sort of like tugging a long rope, producing all kinds of waves downstream (see image below).


Let me show you the developing situation!

Here is an upper-level map (500 hPa, about 18,000 ft) Saturday night, with the color indicating the difference from normal (purple and blue means lower pressures/heights than normal, red/orange is above normal--ridges or highs). You can see the very strong low approaching Alaska and a ridge of high pressure to its east.


But by this morning (Sunday), the low off California has revved up and is just as unusual (if not more so) than the Alaska low yesterday.  On Sunday, the Alaska storm was rapidly declining.


I could show you more technical diagnoses of the connection, but perhaps that would be overkill.

There is a problem with the low going south of us....on the north side of the low there is easterly (from the east) winds, and such winds will temporarily bring back some smoke into western Washington (see the forecast below for 3 PM tomorrow).

Sorry.  But most of the smoke will be high elevation and our air quality should stay decent.

______

I will be giving a talk in Portland at OMSI on the great Columbus Day Storm and Modern Weather Prediction Technology on September 24 at 10 AM (this is free).  Professor Wolf Read of Simon Fraser University will be joining me.  The 60th anniversary of the greatest storm to hit the NW in over a century will be on October 12.

For more information:


Reminder: I will be teaching ATMS Atmospheric Sciences 101 this fall.

Like last year, I am teaching atmospheric sciences 101: a general introduction to weather and climate, this fall. You can learn more about the class on the class website. I talk about everything from the basics of the atmosphere to weather prediction, thunderstorms, hurricanes, and local weather to global warming and climate.

I will be teaching the class in person at the UW, but will also make it available over zoom. Thus, folks can take it remotely.

If you are over 60, you can take the class through the ACCESS program for a very nominal charge (something like $15). Last year I had over 100 folks do so.

If you are a UW student looking to learn about weather or a non-student interested in the topic, I welcome you to join me this fall. My first class is on September 28th.


Should I Let AI Write My Blogs?

I spend a lot of time thinking about and writing my blogs.   Could AI apps do the work for me?   Could any of you tell the difference? Well,...