November 29, 2021

The last atmospheric river in the series. Will Seattle break the November precipitation record?

The third atmospheric river in a sequence will be directed towards our region tomorrow.

Examining the situation, I was impressed by the rate at which this atmospheric river will be moving moisture into our region.  

Specifically, the integrated water vapor transport (IVT), the product of water vapor and wind speed, is predicted to reach extraordinary levels tomorrow morning off our coast (see figure below).  Blue is high.  Purple levels are quite unusual, as is the great north-south extent of this moisture plume.   

It is also coming almost from due west, rather than from the southwest as was true of most of the moisture plumes this fall.

And the moisture/water vapor "river" of this event extends THOUSANDS of miles across the Pacific (see below).  Essentially from the Philippines to our door.


This event will bring substantial precipitation to the regional terrain of Washington and Brtish Columbia, and with the moisture plume's west-east orientation, will bring one of the most extreme rain shadow situations you have ever seen.   I will show you.

The precipitation for the 24 h ending 4 AM Wednesday is predominantly over southwest BC and Northwest Washington, with huge contrasts (see below).  

Virtually nothing over the lowlands from Olympia to the San Juans, as air descends the coastal terrain.  There is one exception...a narrow Puget Sound Convergence Zone feature over Seattle.  Precipitation increases over southwest Washington where there is less high terrain to the west...and thus less rain shadowing.


3-7 inches perhaps on the western side of the mountains of Vancouver Island and the Cascades of southern BC.  The North Cascades and Olympics get a piece of it.

But nothing east of the Cascade crest until the Rockies and Blue Mountains.

Super rain shadow event, while the potent atmospheric river is hitting southwest British Columbia quite hard.  There will be a dry break on Wednesday.

This has been a wet November, but we won't beat any records in Seattle.  So far we have 10.14 inches....very respectable, but 2006 had 15.63 inches.  We won't come close to that.


But we ARE winning the first-place laurels for September through November rainfall, for which we are slightly beating 2006 and some other years (see below).  No wonder lawns are full of moss.


November 27, 2021

The Great Atmospheric River Irony: Simultaneous Extreme Precipitation and Extreme Dryness

Life is full of ironies and contradictions, and our weather situation of the past month is a wonderful example.

A series of atmospheric rivers have moved into the Northwest this month, bringing above-normal precipitation on the western slopes of the Olympics and Cascades.

Ironically, the SAME conditions that produce bountiful precipitation on the western slopes of our mountains cause drying over the downwind and lee slopes, resulting in profound rainshadows.   Huge precipitation contrasts reign.

But to understand why this is true, you must understand the nature of atmospheric rivers.

As I have mentioned in many blogs, atmospheric rivers are associated with plumes of large amounts of moisture from the tropics and subtropics that project into the midlatitudes.   For example, a well-defined tongue of moisture will be heading into our region this afternoon and overnight, as shown by a plot of such moisture at 10 PM tonight.


This is a plot of integrated water vapor (IWV), which is the total water vapor in a vertical column from the surface into the stratosphere.

But moisture is not enough to produce heavy precipitation.  You need to lift the air to saturation and to continually bring in new moisture.

That takes wind.  Wind can bring in more moisture.  And strong winds pushing up mountain slopes produce the upward motion that converts water vapor into precipitation.

Thus, meteorologists who need to evaluate the precipitation-producing potential of atmospheric rivers also plot the product of water vapor and wind, a quantity known as integrated water vapor transport or IVT for short.   

Below is the plot for 1 PM today, with blue colors indicating the largest values.  Wow...a potent atmospheric river is approaching, one that is moving huge amounts of water vapor towards our region (note the arrows indicate the direction and magnitude of this water vapor intrusion).


Strong atmospheric rivers in our region are generally associated with strong southwesterly flow (winds from the southwest).  A NOAA coastal radar wind/temperature profiler at Astoria shows the increasing winds today, which are increasingly from the southwest (see below, yellow and red colors indicating stronger winds).  The profiler is a type of weather radar that can provide wind speed, temperature, and more above a location. 


The strong southwesterly winds will produce massive precipitation on the western sides of our regional terrain.   But as this strong flow descends the northeast side of the Olympics and the eastern sides of the other region terrain, the air will sink, producing warming and declining relative humidity.   Such sinking air is unfavorable to the production of precipitation, resulting in a rainshadow.

Consider the forecast precipitation totals over the next 48 hours (below).  Precipitation ranges from 8-10 inches over "favored" locations on the upper windward slopes to virtually nothing near Port Townsend on the NE side of the Olympics.   Heavy upslope precipitation on one side, little precipitation on the lee side. 


Let me put it another way: there will be a roughly 100 to 1 ratio between precipitation on the western slopes (10 inches) compared to the downslope/rain shadow area near  Port Townsend (.1 inch).   A very small area may have a 500 to 1 ratio.  

And we have not even mentioned the dry conditions in the sinking zone east of the Cascades.

The strongest atmospheric rivers often have the strongest rainshadows, with their powerful winds being a key contributor.    

And there is another story regarding atmospheric river events:  a huge contrast in wind speed and direction that occurs as they interact with our terrain.  But that will wait until a future blog.


November 25, 2021

Atmospheric River Update

The first of three plumes of moisture (atmospheric rivers) is upon us and moderate rain is currently observed along the coast (see radar at 8:30 AM).  If you are living in the interior of western Washington, NOW is the time to head out for some Thanksgiving exercise.  Rain will move in later this afternoon.  If you are in Oregon, you have the whole day.


This first plume of moisture is associated with the first "atmospheric river" in a sequence of three. You can see the "river" in the satellite-based atmospheric water vapor image shown below. Lots of water vapor over the tropics, with thin tendrils of moisture heading into the midlatitudes, including one approaching our region. As I have explained previously, when such moisture is forced upwards by our terrain, moderate to heavy rain results.

The media has recently discovered this term (atmospheric river), often hinting (or stating) that they are deadly or unusual.    

Let me clarify things.  Atmospheric rivers are normal features of the earth's atmosphere that have been known for a very long time, but were previously called other names (such as the warm sector jet or water sector moisture plume).   The image above has six atmospheric rivers, and a similar image over the Atlantic (below) shows two.
Like anything else, atmospheric rivers vary in strength, location, and longevity.  And if even a modest one gets stuck over a region for a period of time, unusually heavy precipitation totals can occur (such as happened earlier this month over Northwest Washington and southwestern British Columbia.

Let's examine the latest forecasts for our region.  The predicted accumulated precipitation over the 24-h ending 4 AM Friday....the total of the first atmospheric river...... is shown below.

The moisture is coming in from the southwest, so the western slopes of the Olympics, Cascades, and Vancouver Island mountains get quite wet, with totals reaching 2-3 inches.  But Puget Sound and Portland are rain shadowed, generally getting less than an inch.   But if you really want to be dry, head to the lower eastern slopes of the Cascades, where the descending flow will prevent any rain.  

Yes, you can stroll around Vantage or Yakima without a worry about getting wet.


A closer view reveals the profound rainshadow to the northeast of the Olympics.   Wow.  A spot south of Port Townsend should be essentially dry for the period.  No wonder so many folks retire there.  Palm Springs in western Washington.


Friday afternoon and Saturday morning should be dry over the region.  An opportunity to work off some of Thanksgiving excesses.

The next front/atmospheric river will spread precipitation over the region Saturday night and Sunday.  

To illustrate, here is the 24-h precipitation ending 4 PM Sunday.   More precipitation than the Thanksgiving storm, with 5-8 inches at some mountain locations.   But again, profound rain shadowing, particularly over Yakima and Portland.   And unfortunately, little precipitation in California where is it acutely needed.


What about the real rivers?

Below is the latest flooding forecast from the NOAA/NWS river forecast center.  The biggest predicted problem will be the Skagit River, where a moderate flood is predicted, with a minor flood on the Nooksack.


To give you more insight into the situation, below is the river stage level and discharge rate at the Skagit River near Mt. Vernon.  Time is on the x-axis and the current time is shown by the vertical line.  You will notice three peaks in the river level, the first on Saturday from today's atmospheric river and then a larger peak on Monday from the weekend event.   The red horizontal line shows the major flood level..which is barely reached.   We are not going to be close to the November13-16th event, which is also evident in the plot 


The same is true of the Nooksack River, which caused so much trouble recently.  The second event will bring things up to a major flood level, but not nearly as high November 16-17.  Can be thankful for that.


Enjoy Thanksgiving.  I have to start cooking!


November 23, 2021

THREE Atmospheric Rivers Heading Our Way

Washington State and southern Brtish Columbia have experienced a very wet fall so far, with the atmospheric river of last weekend causing substantial flooding over Northwest Washington and the lower Fraser River Valley.

But mother nature is not done with us...we should not expect weather forbearance, considering that Thanksgiving week is climatologically the wettest, stormiest period of the year.

Meteorological ground zero, so to speak.

And to make the message clear:  not one, not two, but THREE significant atmospheric rivers will affect our region during the next seven days, with southern British Columbia getting the worst of it.

Let me show you the predicted distributions of atmospheric moisture from the UW WRF modeling system.

First, Thursday morning, with a potent atmosphere river of subtropical moisture aimed for northwest Washington State and southern BC.  A wet turkey day.  Sorry.


By Saturday night ANOTHER atmosphere makes landfall in the same place! 


And Tuesday afternoon an EVEN STRONGER atmospheric river takes aims on southern British Columbia.


How much rain is expected?  I will show you the accumulated totals through three times during the next week....and don't continue if you are meteorologically squeamish.

Through 4 PM Thrusday  there is up to five inches in the mountains of southwest BC and northwest Washington.  Puget Sound will get wet, but somewhat rain shadowed by the Olympics.

The total through 4 PM Saturday is more serious, with totals approaching 10 inches over the windward slopes of the mountains of Vancouver Island and the northern extension of the Cascades.

And by 4 PM Tuesday, things are getting serious with more than 10 inches over extensive areas of southwestern BC.  There is going to be flooding.  One good thing:  it appears that the North Cascades and Fraser River Valley will be out of the central plume of moisture--but wet enough.

And I have some soggy news to tell you about the future.  The latest extended forecast of the European Center through January 7 projects wetter than normal conditions (see below).  Sorry.  Of concern is the lack of precipitation in California... they acutely need it.


November 21, 2021

Were the Sumas Floods Caused by Global Warming? The Evidence Says No.

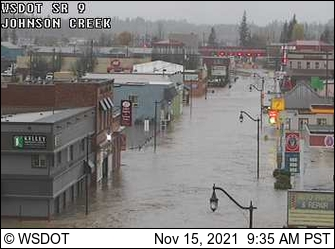
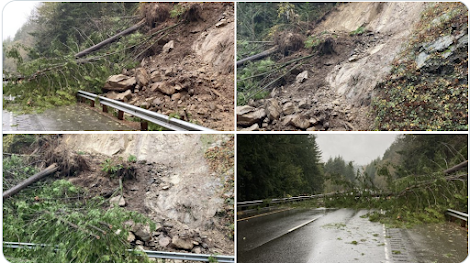
Last weekend there were highly damaging floods over Northwest Washington, with the town of Sumas and its vicinity being inundated by floodwaters.  Several landslides occurred, including some that closed  I5 near Bellingham.

Town of Sumas, 2021, WSDOT Photo

Within hours of this heavy rainfall event, politicians and the media were suggesting that this event was somehow unique and the result of global warming.

For example, Governor Inslee called the flooding an example of “a permanent state of attack by the forces of climate change.”   The New York Times claimed that flooding in Northwest Washington was caused by climate change (see below)


Similar claims were found in the Washington Post and the Guardian.  And, of course, the Seattle Times had several stories, supported by a slew of "experts" (such as a Simon Fraser Professor) stating that climate change contributed to the flooding.  

The truth is very different than these claims.   The Sumas area is extraordinarily prone to flooding and has experienced flooding many times before.   And as I will demonstrate below, there is no evidence whatsoever that global warming caused the heavy rainfall associated with this event.

A Flood-Prone Region

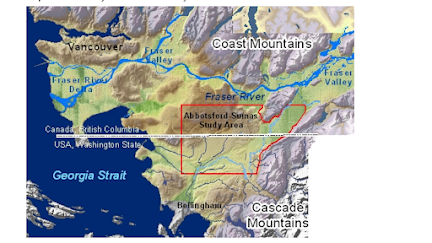
The town of Sumas is within the historical flood plain of the Fraser River, with an additional flooding threat from local rivers such as the Nooksack (see maps below from a 2005 report by Dr. Jacek Scibek and Dr. Diana Allen of Simon Fraser University)


Importantly there was a large historic lake near Sumas and Abbotsford (Sumas Lake) that was drained for use in agriculture.   In short, a low-lying, historically wet area that has always been prone to flooding.

Previous Flooding

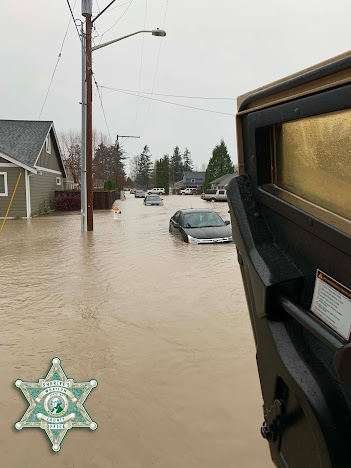
Flooding is not a new visitor to the Sumas area, which has experienced flooding many times during the past century.   The streets of Sumas was similarly flooded in February 2020 (see below)


And there were many previous major floods, including those in 1990 and 1951, to name only a few (see some more examples from the Whatcom County analysis of flooding events).  You build a town in a historical river delta in one of the wettest portions of North American, you can expect trouble.


To say that flooding in Sumas or the region is something new, unprecedented, or unique is simply not correct.  Those making such claims should have spent a little time examining historical floods of the region..

Global Warming And Heavy Precipitation

There has been a LOT of handwaving about the heavy precipitation during this event, claiming it was the result of global warming.  Or that it was greatly enhanced by global warming.

Yes, we had a major rainfall event, but to make a claim that global warming was the origin, it is necessary to demonstrate that there has been a progressive increase in heavy rain, something that would be a sign of a global warming origin.

Let's look at the data.  Karin Bumbaco, Associate Washington State Climatologist, graciously provided me with plots of annual maximum 24-h rainfall at Bellingham, WA, and at the nearby Clearbrook official climatological observing site, with the latter having a very long record (see below).  

There is NO HINT of a trend towards more extreme precipitation at either of these sites.  According to Karin, the big peak in the mid-1930s was from an error in putting two days of rainfall into one day.


Such a lack of evidence of global warming is consistent with state-of-science regional climate modeling, which found that climate models (driven by very aggressive increases in greenhouse gas emissions (RCP8.5) did not produce significant increases in 24-h maximum precipitation in the area over the past half-century (results for Bellingham is shown below). By the END of the century (not shown here), aggressive global warming will increase the heaviest precipitation...but that is in the future.

But wait! There is even more evidence against a global warming contribution to this localized heavy precipitation event.

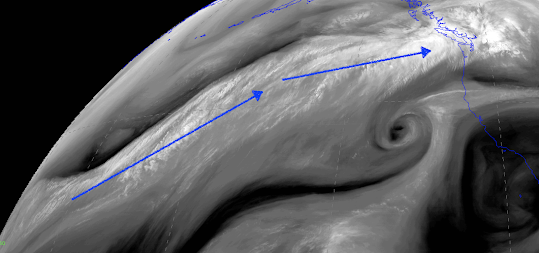
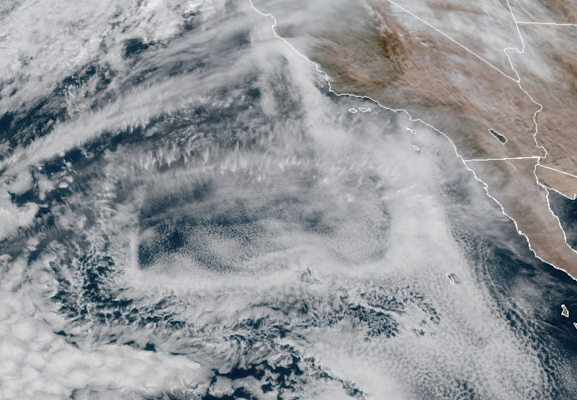
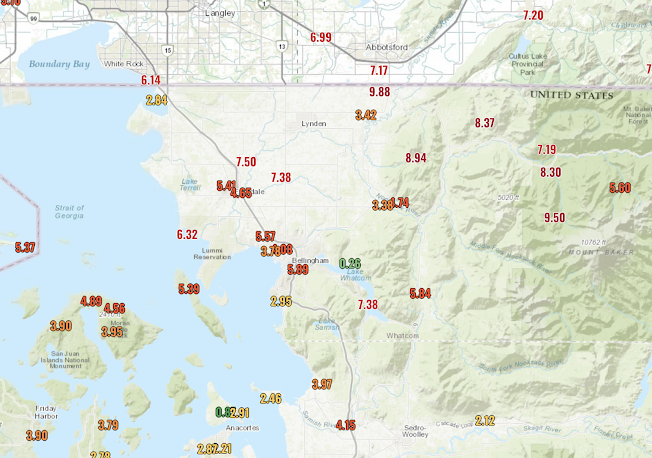
The origin of this event was a moderate atmospheric river, in which a narrow plume of water vapor was forced upward by our local mountains (see plot of water vapor at 4 PM last Sunday).


If global warming was important, then one would look for above-normal sea surface temperatures along the atmospheric river's path, which would provide additional moisture to the air.  

Below are the sea surface temperature anomalies (differences from normal) for the period leading up and including the atmospheric river in question.  It was cooler than normal immediately off our coast and near normal for virtually the entire path of the atmospheric river. With La Nina conditions, the water temperatures near the equator were BELOW normal.  No sign of a global warming contribution.


Forest Fires Did Not Contribute to the Flooding

In desperation, some of the global warming advocates are suggesting, without a shred of evidence, that the forest fires from last summer were contributing to the flooding.  Specifically, they claim that debris from the fires and less absorptive capacity of the burned landscapes resulted in more water and material entering the rivers.   

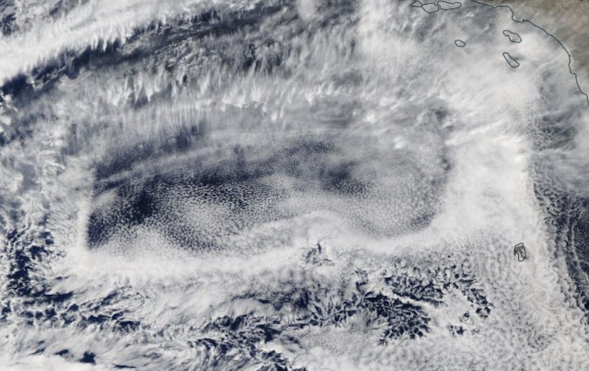
We can see how much of the land immediately around the flooding areas was burnt using NASA MODIS imagery (see below for October 31st, when it was clear).   Recently burned landscapes have a reddish hue  (I have indicated an example of a recent fire, east of the Cascade crest, with a red arrow.


It is obvious that there are no major burnt areas around the flooding area or the associated river basins that received heavy precipitation during this event.  So wildfire burnt areas did not make a contribution to these fires.

Snowpack

Another claim, as found in the New York Times, was that there was low snowpack (due to global warming) before the flood, leading to a reduced capacity to soak up the rainwater.  But that was not true:  the snowpack was well above normal prior to the event (USDA Snotel map a few days before the flood is shown below).   The snowpack was well above normal.....not exactly the kind of situation associated with global warming.  I mean MUCH above normal.

I should note that melting snow probably had little impact on this flooding event.  There are several papers (such as this one) that documents that rain on snow melting is very small compared to the rainfall itself.   Furthermore, there was little low-elevation snow before this event, which would be the most likely to contribute.

Epilogue

It is both concerning and problematic that some local politicians, local and national media, and even some scientists are willing to stretch the truth about the origins of this serious flooding event, suggesting a major contribution from global warming (frequently called "climate change".  

Society can not effectively deal with environmental threats when it is provided with hyped or false information.  And providing such false information, even in the hope of motivating people to "do the right thing",  has substantial ethical problems.

November 19, 2021

Dry Weekend and the Roadway Icing Threat: All in My New Podcast

The coming weekend will be unusual for the region:  it will be totally dry as high pressure builds over the region!

Sunday at 4 PM.  500 hPa heights (like pressure at 18,000 ft)

This dry period is particularly welcome, allowing Northwest Washington a period to dry out before more rain comes in next week.

But high pressure during fall can cause problems, allowing the surface to cool off to below freezing and allowing the possibility of roadway icing.

My podcast describes this threat and how you can be on the lookout for potential signs of ice formation.

You can listen to the podcast below or through your favorite podcast server.


Some major podcast servers:

 HTML tutorial HTML tutorial
Like the podcast? Support on Patreon Become a Patron!


My next blog will be on the Sumas/NW Washington flooding, examining whether global warming is the cause, as claimed by some media and politicians.

November 18, 2021

Shocking Cloud Pattern: Random Chance, An Unknown Phenomenon, or the Work of the Devil?

 Today I have gotten several emails from folks seeing an unusual, if not disturbing, cloud pattern in the visible satellite imagery.

I mean odd.

As shown below, you can see the object of concern.....a nearly perfect rectangle in the low clouds (mainly stratus and stratocumulus) due west of Baja California


Here is a closer view.   Wow.


What is particularly odd is that the box seems to nearly remain in place over time.  This is not normal.


We have some international experts on low clouds in the subtropics in my department. In the past, several have talked about human intervention to modify such clouds artificially as a tool to reduce global warming.

They assured me that no such experiment was going on and they could not explain this bizarre appearance.

The Guardian newspaper also emailed about it, asking if this feature is the result of global warming.  I assured them that there was no reason to expect that to be the case.  And Charles Mudede, the self-styled "Green Mussolini"  at the Seattle Stranger, also called, suggesting it was a "Wiccan rectangle."   He also noted that it could be related to "Lucifer's rectangle."    

You have to hand it to the Seattle Stranger staff, they are well informed in matters related to the devil and witchcraft.

The truth is that the cloud rectangle is probably just a random natural phenomenon: with enough time a strange geometric pattern is bound to appear.  

But you never know.....


November 15, 2021

Extreme Precipitation and Flooding in Whatcom County

 Extreme flooding forced by extraordinary precipitation has flooded the town of Sumas and other locales in Whatcom County.

Landslides closed I5 and some other roads, and sewage overflows are threatening some water supplies in the area.

The pictures are stunning.

Downtown Sumas was flooded this morning.


The nearby town of Everson is flooded.


And landslides closed I5 near Bellingham:


The Nooksack River achieved its all-time record river stage.

The cause of these terrible conditions is very wet autumn followed by extremely heavy rainfall over the weekend.  Let me show you.

Here are the 72 hr totals ending at 6 PM today.  A number of locations reported 8-10 inches...unbelievable... with 8.94 inches as Sumas Mountain and 9.88 inches near the international border.  Orcas Island, which is closer to the Olympic Rainshadow, got around 5 inches.


But what made this even so deadly is that most of the precipitation fell in a 24-h period on Sunday (midnight to midnight).   This is shown below for the Sumas Mountain observing site.  Around 7 inches in 24 hours.  Wow.


I am happy to report that weather forecast models accurately predicted this torrential rain, something shown by the forecast of accumulated rain made on Friday at 4 AM for the total through 4 AM Monday.  Not bad.   Pretty impressive rainshadow to the NE of the Olympics.


You see the yellow colors....those are the heaviest amounts.

We are going to dry out during the next several days, but the damage has been done.

We are now "enjoying" the wettest autumn on record for many locations in western Washington...but that "honor" should be lost with the dry period ahead.  But the ground is saturated throughout the region, and the WA State DNR's landslide warning system has areas of concern, particularly Whatcom County and along the coast (the other area with lots of rain).


Winds

And yes, we had strong winds today with the intense front, with gusts reaching 50-65 miles per hour in places.  Whidbey Island is essentially blacked out, with large outages in the South Sound and elsewhere (see below)


We knew all this was coming..... the big question is how society can learn to use the increasing weather forecasting prowess to protect life and property.

I have said this many times, but it bears repeating: the first line of defense against extreme weather is excellent weather prediction, which should allow us to prevent most loss of life and injury and reduce economic damage. 

Deaths from extreme weather are plummeting around the world and better forecasting is one of the reasons.  You would not know that from what you read in the Seattle Times and many other media sources, which play up extreme weather as an apocalyptic threat to the existence of humanity.

Announcement:

I will be doing a book signing and dinner event at Ivar's Salmon House in Seattle on Wednesday, November 17th (6 PM).  You can come just to purchase a book and get it personalized or you can stay for a special dinner, where I will be giving a weather talk.   More information on the event is found here.  You need to make reservations for the dinner (only 80 spaces available). And information about the new edition of my book is here.

Only about 10 spots are left, so if you want to go, reserve a place soon.


Should I Let AI Write My Blogs?

I spend a lot of time thinking about and writing my blogs.   Could AI apps do the work for me?   Could any of you tell the difference? Well,...