And when temperatures are plotted on maps, a warm bull's eye is often apparent around Yakima.
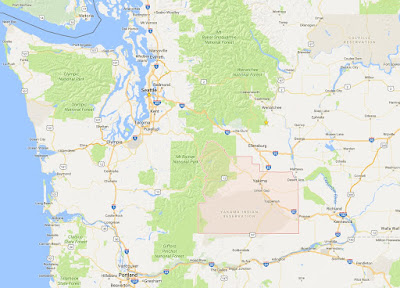
Let me show you. Here is a plot of the number of days over the last two years that the temperature exceeded 90F. There is a localized maximum (dark red) near Yakima (a map, with Yakima County indicated, is also shown for reference).

What about average minimum temperature? Another localized warm maximum around Yakima. In fact, Yakima has the warmest low temperatures in the state!

A plot of the high temperatures yesterday around the Yakima area, show the Yakima Airport (YKM) is warmer than any place else in the neighborhood (63).

So what is going on at the Yakima Airport? It is something of a mystery. The National Weather Service says they checked out the sensor and it seems to be calibrated ok. The Yakima instrument suite is typical of U.S. airports: NWS/FAA ASOS (Automated Surface Observing System).
Using Google Maps, there is an image of the airport area, with downtown Yakima to the north and east. The oval shows the location of the Yakima weather instruments.

And here is a blow up of the weather instruments area. The instruments are in a vegetated area between two runways.

So what is going on? The airport is relatively low, so that would contribute to daytime warmth, but not at night. The vegetation is dry, so it would warm up more than irrigated fields, but that doesn't explain the nighttime warmth. And besides, some of the cooler neighborhood weather instruments are on unirrigated land or in urban areas. The neighboring runways could warm up during the day and perhaps release heat at night.
The high resolution UW WRF model forecast for 5 PM Monday (below) does not suggest a warm bullseye over the airport--so it does not indicate some strange (but real) local weather feature.

There have been a number of reports (and publications) bringing into question the sensor used in the NWS ASOS stations: the H0-83 hydro-thermometer (see picture). These papers (example here) suggest a number of possible problems, including insufficient ventilation of the enclosure (the white object below).

So the origin of the warmth at Yakima is still not clear, but the reported start in 2011 does suggest some instrumentation issue.
Finally, this example explains something many of you have asked in the comments...why are there isolated warm and cool areas on the climatological maps I show (like the average maximum temperature map over the past two years below). The answer is probably bad sensors or unrepresentative locations (like a sensor near a building or over concrete). My discipline needs to do better.

Help Support Regional Climate Research at the UW
Society needs to know the regional impacts of climate change and the UW is building a regional climate modeling effort. With Federal funding collapsing, we are trying community funding approach. If you want more information or are interested in helping, please go here. The full link is: https://uw.useed.net/projects/822/home


I grew up in Ellensburg and still visit family there regularly. Yakima was always significantly warmer than Ellensburg(just 30 miles away), and still is every time I go there. In the winter or spring there is quite often a good amount of snow on the ground in Ellensburg, then you drive to Yakima and there is no snow and flowers are popping up. This is nothing new.
ReplyDeleteIf the temperature reports from this location are wrong, will that have a negative effect on weather forecast models? ie: will it make the weather forecast model output for that location less good? Is there some internal feedback mechanism in the weather forecast model that compares its output to the subsequent weather and feeds that information back into the local model?
ReplyDeleteThecatguy93---there is no doubt that Yakima is warmer than Ellensburg...that is not the question. The issue is YKM compared to nearby surrounding stations.... that seems to be an anomaly...cliff
ReplyDeletetypingtalker....one station at one level (the surface) should have little impact on weather prediction models....cliff
This doesn't address potential sensor issues, or why the airport registers higher, but we regularly drive through Yakima on our way to Wenatchee from the Columbia River Gorge. Yakima is ALWAYS warmer than towns in either direction. We've noticed that on our vehicle thermometers (3 different vehicles) over a period of the last 15 years.
ReplyDeleteAgain, that's not the sensor issue, but a weather issue we're always noticed that appears somewhat related to this.
I've driven passed YKM every day for 18 years. It is definitely hotter, windier and foggier there. I've watched dust-storms that hover over the runway, and fog that makes walking a challenge that only exists over the runways and hangars. I used to leave my driveway with the air temp showing sub-zero temps 2 miles north of YKM and see it go up to 6˚ at YKM then back to sub-zero as I arrived at work on S 3rd Ave in Union Gap about 1 mile away.
ReplyDeleteHow do the humidity readings at the airport compare to other local to Yakima areas? The area where the airport is located is fairly boggy.
ReplyDeleteI grew up and currently live in Yakima. Your post is a head scratcher. And always being interested in our local weather, mostly because the jobs I do, or maybe I do these jobs because of weather, I don't have an answer either.
ReplyDeleteFirst, you're not saying Yakima is the hottest place in Washington, but as of late, the temperature anomalies of the official station is significantly more than the surrounding communities. In all actuality, this is a great month to examine the situation. You could look back to this winter. We had snow on the ground from Dec 1st to March 1st. Snow on the ground is a good blank slate for observations because it covers a lot of urban & agricultural effects you often describe. But in the topographic bowl is which the station sits, it's subject to a lot inversions & uneven mixing of the surface, making it difficult to compare. In the summer, when the irrigation is turned on, vegetation is green, the sun is high, surrounding concrete gets hot, again makes it hard to compare.
Right now, the snow is gone. No leaves on the trees, no irrigation, consistent soil and vegetation growth (just some green grass) everywhere. Good sun angle, good mixing of the atmosphere but mostly stable, and the temperatures are still haywire. Pasco for the month is averaging 55.9 degrees. Its normal 59.1 degrees. Yakima for the month is 55.9 degrees, but our average, 56.2. This example has been ringing true for a long time now. That UW WRF map you posted is a masterful and almost a perfect example how the temperatures of this state are. In no way was it wrong in the forecasted highs except for one spot. Although if you do look close, you do see a little red speck through the gap, where the airport is located.
There has been urban development east of the site. Valley Mall Boulevard, a new four lane road, with a lot of car dealerships, a Costco etc. and typically when things like that are built, orchards are taken out. An orchard south of the site is gone. And another underestimation of local influenced weather is Ahtanum Ridge (maybe 1500')? runs east-west, and with a south wind like on Monday, will provide a micro scale "heat burst" of compressing dry winds of that particular spot. In fact, our predominately chinook winds from the S, SW, W, and NW, the lowest spot, which is the airport, should be the hottest. But why is it hotter than the lower valley, or so significant from the next reporting site?!?! Mystery it is.
Did they change the instrument or the sensor? Inquiring minds wonder and wander...
ReplyDeleteI suggest it's the urban heat island effect. Especially since it's near the tarmac.
ReplyDeleteHave them trade us some sun for some rain. I'm starved for it.
From the posts about it seems there is enough antidotal evidence here from people with experience in that area that this anomaly can't be easily explained by a faulty sensor or its bad siting. Maybe a good project for a student to take on.
ReplyDeletesurfacestations.org
ReplyDeletePoor instrument siting is rampant throughout the US. The instrument should not be that close to the runways for accurate temperature records.
I agree, today I drove around kykm weather station and my car showed 61 degrees the airport showed 60 degrees the weather station one mile to the northwest of the airport which usually shows lower was totally off, it showed 55 degrees, plus I drove on the freeways around Yakima and it was very windy the air was well mixed and my car showed 60 degrees most of the time that is why I know the weather station to the northwest is way off, oh check out the tpark weather station 2 miles to the Southeast,the night time lowes are about 9 degrees warmer than the kykm in summer,i know it is correct because I drove there early in the morning. The micro climate plays a huge role around Yakima
ReplyDeleteI meant I agree with Craig
ReplyDeleteJeffB said "Poor instrument siting is rampant throughout the US. The instrument should not be that close to the runways for accurate temperature records."
ReplyDeleteThis points out a conundrum of airport weather observations. ASOS stations may sometimes be poorly sited for generating regionally-representative data to be used in climatic records and in forecasting, but (assuming the sensors are calibrated and operating correctly), they should be providing the appropriate data needed for aviation operations and safety at the airport.
And this is why we keep having record warm winters/summers? Compiling surface temp data from airports seems insane unless you are studying airports
ReplyDeletePacked-Bed Thermal Storage. The grass (where the instrument package sits) is planted on a bed crushed rock. The instruments are probably accurate.
ReplyDelete"In 1932, the airport was improved by adding a 2,600 ft long gravel landing strip with a drainage system." https://yakimaairterminal.com/about/