January 31, 2015

Supersize Superbowl Storm and the Most Amazing Fog Picture I Have Ever Seen

Today is amazing weather picture day.

You want to see a HUGE storm that covers much of the North Pacific?  Here is an infrared satellite picture at 10 AM PST today.   The center of the low center is in the middle of swirling clouds south of the Aleutians, with the associated front extending to the Pacific Northwest.


Here is the 6-h WRF forecast verifying the same time (solid lines are isobars, lines of constant pressure, shading is temperature).  Wow..that is a BIG storm and a very deep one, with the central pressure of 956 HPa.


The forecast wind gusts at 7 AM this morning are scary, exceeding 70 knots (81 mph).


Big storm with strong winds means big waves.  Here is the forecast for the same time  (7 AM)  from the NOAA Wavewatch III system.  Waves at that time were getting to 11 meters (36 feet).

And now the most amazing fog-related picture I have ever seen, courtesy of  Shari Bradbury, a local professional photographer (her website is here).  This image was taken in downtown Seattle yesterday (Friday) around 9:05 AM.   You can hardly believe it is genuine.  Photoshop heaven?   I think it is real...what do you think is happening?


My theory is that we had some broken fog.   Sun was getting  in and reflecting off the glass of the tall building (the Russell Investment Center) and then illuminating the fog.  The structure of the illumination of the fog reflected the windows and variations of that side of the building.

Here are some other pictures of the building, you can see why two areas of light come off the building (with less windows in the center) and that the building is highly reflective.


There have been some other strange optical effects associated with this building, one of which would warm the heart of any Seattle resident:


Announcement

The Northwest Weather Workshop, the major annual meeting for those interested in Northwest weather, will take place February 27-28th in Seattle at the NOAA Sand Point Facility.

The draft agenda (which will change) is found here.

Registration is required.  For more information about the meeting and online registration, go to the meeting website.


January 29, 2015

January's Disappearing Snowpack

January in the Northwest usually brings a rapidly increasing snow pack in the mountains, as illustrated by the typical annual variation at Mount Baker (see below).

But this year, with warm temperatures/rain alternating with dry, high pressure conditions, our snow pack has been on a substantial decline.   

Let me demonstrate this to you.  Below are the NOAA snow depth analyses for December 29, 2014 and today (January 29, 2015).    A huge difference, with FAR more snow a month ago.   The Oregon Cascades have almost nothing on them today and the Olympic Mountain snow pack is hugely down.

The only place where the snowpack is comparable to last year is the northeast Cascades and northeastern Washington.

To really drive home the changes over the past month, let's compare MODIS satellite imagery for December 29th and today.  Over the Olympics, the differences are night and day (see below), with the low-level snow pack virtually gone in today's (the second) image.


Or take a look at the snow distribution over the central Cascades east of Seattle. (There are some clouds as well...they are less structured than the snow fields, which have a dendritic look--with no snow in the valleys).   A month ago, there was lots of snow in the Cascades that extended to relatively low elevations.  In contrast, today, the snow had pulled way back into higher terrain.


You really want to be impressed with the changes?  Here are the before and after satellite photos around Mt. Rainier, Mt. St. Helens, and Mt. Adams.  The low-level snow pack is virtually gone today, while there was plenty in late December.


Or how about the difference between the Mt. Rainier (Paradise) web cams on December 26th and today?  Can you tell the difference?


There will be some light snow in the north Cascades during the next 72 hours, but not enough to make a huge difference.  Here are the predicted snow amounts.  Virtually nothing in the Oregon Cascades, southern WA Cascades, and the Olympics,but the north Cascades and northeastern Washington get 1/2 ft or so.  Southeast BC gets a snow freshening. A pattern we have seen too many times before.


And according the the Climate Prediction Center the temperatures will remain warm over the western U.S. (see map).  Enough to make a skier cry. Thankfully, we have the Seahawks.


January 27, 2015

Forecast Lessons from the Northeast Snowstorm

The complaints swelled quickly this morning, both in the social media and the press:

National Weather Service forecasters had predicted two to three feet over New York City and adjacent suburbs for Tuesday and only about 8-10 inches showed up.

The city had been shut down overnight--travel banned on major roadways, mass transportation systems (e.g., subways) closed, schools and businesses closed--and all for a minor snow event!  A few samples from the press illustrates some of the commentary:


And then a National Weather Service forecaster even apologized for a  "blown forecast", something that doesn't happen very often.


Fortunately, NY Governor Cuomo had the right attitude!


And you had to expect that some global warming critic would use the forecast troublex to cast doubt on global warming predictions.

So what is the truth about this forecast event?   As I will describe below, although the forecast "bust" was not as bad as it might appear, it did reveal some significant weaknesses in how my profession makes and communicates forecasts, weaknesses that National Weather Service director Louis Uccellini says he recognizes and will attempt to fix.  

The general forecast situation was well understood and skillfully forecast starting on Saturday.   A low center (a midlatitude cyclone) would develop off the SE U.S. and then move northward up the East Coast--a storm commonly called a Nor'easter.  Here is a surface weather map at 4 AM PST this morning, when the storm was near its height.  In such a location, the storm can pull cold air off the continent while swirling in moisture from off the ocean.  The result is moderate to heavy snow to the west and north of the low center, as well as strong winds over the same areas.  Thirty years ago we could not forecast these storms with any skill. That has changed.


Although our models have been suggesting the development of a low center along the coast earlier in the week, it was not until Saturday that most of the models converged on essentially the same solution:  a low developing rapidly along the mid-Atlantic coast and developing into an intense low off of Cape Cod.  And that is what happened.

Virtually all of the models indicated that the precipitation (snow) would swing around the low, with a relatively sharp cut-off to the west of the cyclone center (see figure).


As the weekend progressed it was clear that although all the models had a similar idea, the position of the low center and associated precipitation varied.  The European Center (ECMWF) model, which did so well during for Superstorm Sandy and is on average the most skillful global model, was taking the low closer to the coast, pushing the heavy snowfall over the NY metropolitan area.  For much of the weekend, the National Weather Service's main high-resolution model, the NAM, did the same thing.   On the other hand, the National Weather Service recently upgraded global model, the GFS, was taking the center farther offshore, and predicted far less snow over NY City.   Here are the 30-h forecasts of the European Center and GFS models (solid lines are sea level pressure) valid 10 AM PST Tuesday...the difference in location is clear.


The Canadian and UKMET office models had solutions similar to the U.S. GFS.   

 NWS forecasters, mindful of the general superiority of the European Center model and comfortable with the workhorse NAM model, went with the European Center solution, which implied heavy snowfall over New York.  Their forecast on Monday afternoon was for 24-36 inches over New York city, eastern New Jersey, and into Long Island and Connecticut.  Not shown here are the heavy snows forecast for southeast New England.


The problem for the NWS was that they bet on the wrong horse and the low followed a track similar to that predicted by the GFS.  With the storm further offshore, the sharp gradient in snowfall moved eastward, resulted in NY City getting far less snow....roughly 10 inches in total.  

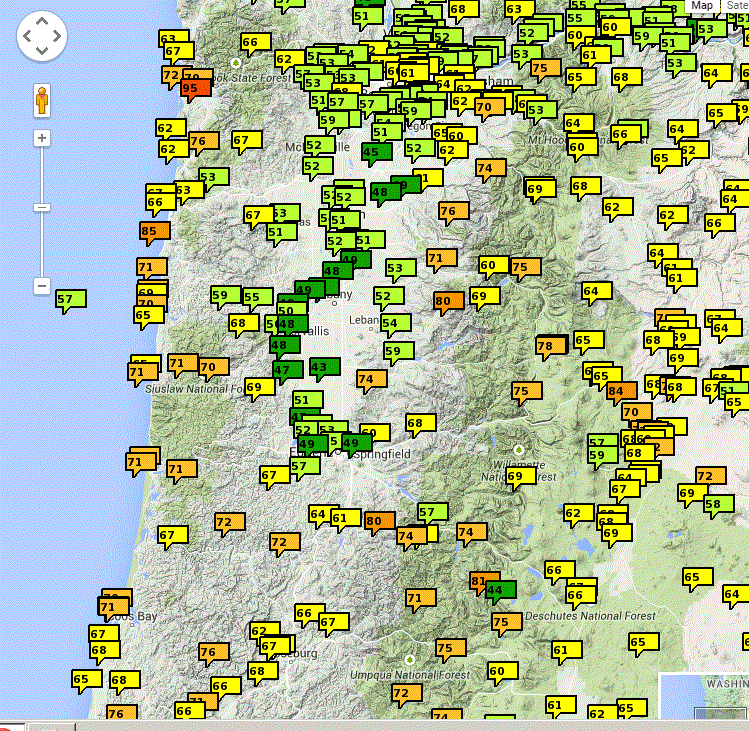
Here is the New York Times snow total map to see more details.  New York City got about 1/2 to 1/3 the predicted amount (although 10 inches is quite significant).  New Jersey got far less than predicted. But eastern Long Island and SE New England were right on target at 2-3 feet.


So there is no way one could call this forecast a major failure.  The NWS predicted a strong cyclone moving up the coast and they were right.  They predicted heavy snow over eastern Long Island and New England and were correct.  The snow forecast over New York was substantially overblown, but 9 inches is still a significant event.

But the forecast could have been much better and far more useful.  The forecasters failed to communicate the level of forecast uncertainty and did not change the forecast rapidly enough over New York when it was clear the storm was moving farther offshore.  And it reveals major deficiencies in how forecasts are made and communicate in the U.S.

Let me explain my logic.

National Weather Service (NWS) forecasters have the benefit of many weather prediction models, and in this case there was significance between them regarding the low position as it passed northward east of Long Island.

The European Center (ECMWF) model and the NWS NAM model had a more westward track and lots of snow over New York City.  

In contrast, the NWS GFS model, recently upgraded as new computer resources became available to the NWS, had a more eastward track and far less snow.  It is well known that the GFS is generally far more skillful than the NAM; in fact, many of us in the field believe the NAM should be retired.

The UKMET office model, number two in the world (after ECMWF), was like the GFS.
So was the Canadian global model.

So there was considerable differences among the major models, which suggested a lot of uncertainty over the exact location of the low center and the western edge of the heavy snow.

NWS forecasters also have large ensemble forecast systems, in which many different U.S. models are run with different starting points and model physics (e.g., how convection and clouds work).   These ensemble systems were  also indicating SUBSTANTIAL uncertainty in the snow forecasts over New York.  Let me show you.

Here are the snow total forecasts over New York from the NWS SREF (Short-Range Ensemble System) using forecasts starting at 09 GMT on January 26 (1 AM PST Monday).  These plots show the cumulative snow total predictions.  There is a HUGE spread in the forecasts. Some are as high as 35-40 inches while others are around 5 inches.  The National Weather Service at that time was going for 24-36 inches over NY, which is only achieved by a minority of the forecasts (perhaps 30% of them).


To put it another way, if these forecasts were equally probable (and they probably aren't), there was roughly a 70% chance that the official forecasts were too high.  Instead of predicting 2-3 feet, consider if that forecasters had said there was a 30% chance of more than 2 feet, a 35% chance of 1-2 feet, and a 35% chance of less than a foot.   No one would be writing critical headlines if they had done so and decision makers would have gotten far better information. And the fact that forecasters used terms such as "historic storm" was guaranteed to push the media into a feeding frenzy.

There is something else.  By late Monday, it was clear that the European Center and NAM forecasts were going wrong, and other U.S. modeling systems, like the newly operational High Resolution Rapid Refresh System (HRRR) indicated that NY would not get the big snow dump.  

Want to see it? Here is the HRRR 15 total snow accumulation over the Northeast ending 4 AM Tuesday.  Just a wonderful short-term forecast that verified well.   Such predictions were consistent in time and with virtually all modeling system initialized during Monday evening...the heavy snow predictions should have been dropped sooner.


So what needs to be done now to ensure this failure mode does not happen again?

First, the U.S. needs to enhance its ensemble forecast systems, the systems that facilitate the creation of probabilistic predictions.  If you have say 100 equally likely forecasts, and half go for 2 feet of snow, then the probability of 2 feet of snow might be 50% (this is simplistic, but you get the idea).  The National Weather Service have sponsored a number of studies by the National Academy of Sciences, studies that have strongly advised that the NWS enhance its ensemble systems and move vigorously to probabilistic predictions..   Unfortunately, the NWS has not followed this advise, with a poorly supported  "high-resolution" Short-Range Ensemble System (SREF) with a coarse resolution of 16-km. The U.S. needs a large convection-resolving (2-3 km grid spacing) ensemble, with sophisticated statistical post-processing to give reliable probabilities for snow and other important quantities.

Second, the NWS has to move to a much more probabilistic form of forecasting preparation and dissemination, one in which forecast uncertainties are made clear to users.  The computer workstations used by NWS forecasters and NWS websites are not designed to facilitate probabilistic prediction.  This needs to change.

Superstorm Sandy led to a widespread understanding that NOAA had let its computer resources decline to third tier status, and thus the problem was addressed.

Perhaps, the January 27, 2015 snowstorm issues over New York will lead toa  realization that forecast uncertainties need to be communicated to the public and that the NWS has to dedicate sufficient resources to make this happen.


January 25, 2015

Record Warmth and River Fog

Update:  at 2 AM Monday it was 60F at Paradise Ranger Station on Mount Rainier.  This is at 5500 ft!   And this morning there is one of the most intense low-level inversions I have ever seen.  Here is the plot from the Seattle vertical sounder.  10-12C (almost 20F) difference in the lowest few hundred meters.  Amazing.
...........................................


For warm weather lovers, today did not disappoint.  As shown in a plot of today's high temperatures, many stations in western Washington climbed in the mid-60s, with a number of stations on the western slopes of the Cascades reaching 70F and more.


In Oregon, several locations in the foothills of the Cascades and coastal mountain got into the upper 70s and 80s.  Cool foggy air was trapped at the lowest elevations of the Willamette Valley, as illustrated by satellite image at 1 PM below.  Temperatures stayed in the upper 40s in that fog.


Seattle's high of 63F was the second warmest January day in the entire record.  Some of the warmest temperatures were in the mountains and upper slopes. Why?

The reason is clear if we look at a vertical sounding at Salem, Oregon at 4 PM today (red lines in temperature, blue dashed line is dew point).  The vertical axis is pressure (700 is roughly 10,000 ft, 850 is about 5000 ft).  There was a shallow layer of cool, moist air topped by a very strong inversion,with temperature increasing with height.  That is why the warmest locations were found at elevations of a few thousand feet.


Today I was biking along the Cedar River Trail with some friends and I saw something interesting:  river fog.   Fog that was hanging at low levels right about the river.  Here are some pics:


Why such fog?   We had warm, relatively moist air and quite cold water in the river (being fed by lots of snow melt!).  This warm, moist air was cooled by the cold river water to its dew point...producing fog.

Tomorrow may be even warmer in some places.

In contrast, far colder than normal temperatures are in place over the East Coast, where parts of the Northeast are expecting an historic snowstorm.


January 24, 2015

Summer in January

Summer air is above us right now.  I am not kidding.    And the temperatures at the surface we woke up to this morning (mid-50s over Puget Sound country) were indistinguishable from our normal summer lows (lower to 50s F).

And it is going to get warmer tomorrow.

Let me illustrate the profound nature of the warmth we are facing.  A lower atmosphereic level meteorologists often look at is at a pressure of  850 hPa (located about 5000 ft above the surface).

This morning (at 4 AM) the temperature at this level measured by a radiosonde (weather balloon and sensor) on the Washington Coast (Quillayute) was 7.5C with a freezing level of roughly (10,000 ft).   See sounding below for the details (red is temperature, blue dashed is dew point).

A warm front has moved through this morning and even warmer air is coming in--here is the forecast from the UW WRF model at 850 hPa for 1 AM Monday morning.  Shading and the blue lines are temperature.


14 C air over Seattle!.  For those of you who are not meteorologists, this is crazy warm.  Let me prove it.

The NOAA storm prediction center has a wonderful site that provides the climatology of the upper air data around the U.S.   Let's take a look at the climatology of 850 hPa temperatures at Quillayute (UIL) on the Washington Coast throughout the year.  The black line indicates the average temperatures for the day (dark black is a smoothed version).  The red line shows the extreme warmest temperature on each day.  The green line is the temperature forecast for Monday AM.

Pretty amazing.  The temperatures on Sunday and Monday will probably exceed the all time records for the date.    They are WAY WARMER than the average temperatures for July and August, our warmest months.  So the air above us tomorrow will be warmer than typical summer temperatures.

The only thing holding us back from having temperatures in the 80s is that the sun is way weaker this time of the year and the cooling effects of clouds.

Today there is considerable cloudiness, but there will be only some high clouds tomorrow and few clouds on Monday.  Here is the cloud forecast for Monday..sunny,with summer air above us!


Let's look at the WRF temperature forecasts for Sunday afternoon at 2 PM.  Temperatures well into the 60s over western Washington and around 70F over the western slopes of the Cascades.  The only issue with this forecast is that there will be a low-level inversion between cooler air at the surface and warmer air aloft.  That will keep some low clouds in on Sunday morning, something the model tends to mix out too quickly.  But where the clouds burn off it will get warm quickly.


And warm or warmer on Monday.  A weak front comes through on Tuesday and then the ridge builds again for warm and dry conditions.  The latest NOAA extended (6-10 day) temperature forecast (below)  indicates much warmer than normal temps on the West Coast and cooler than normal over the eastern U.S.


The extraordinary warm temperatures and persistent high pressure has led to very  low snowpacks in some locations, particularly the Olympics.  Here is the last cam shot of the Hurricane Ridge parking lot and surroundings today.   Hard to believe for late January...MOST OF THE GROUND IS BARE!


Is this warmth associated with human-caused global warming?  The answer in a future blog.

 And enjoy summer in January.

Should I Let AI Write My Blogs?

I spend a lot of time thinking about and writing my blogs.   Could AI apps do the work for me?   Could any of you tell the difference? Well,...