January 31, 2019

Cold Wave to Hit the Pacific Northwest With Some Lowland Snow Possible

There will be an UPDATE AT 10 PM Friday
_________________________

Some of us may have been feeling safe here in the Northwest, as extraordinary cold has hit the Midwest and the eastern U.S.. 

Soon we will  be feeling the sting of cold temperatures and even the potential for lowland snow.

The coldest air of the winter will reach our area on Sunday, and Monday's temperatures in western WA may not get above freezing.  Savage cold and wind will hit the Bellingham area.  Eastern WA will make an icebox seem warm.  The mountains will get plenty of snow and some of the lowlands we be whitened.


You might want to get prepared on Saturday--winterize your home (e.g., remove hoses from faucets),  gas up your car, make sure the antifreeze is up to snuff, and move your pets inside after Sunday AM.  Our region will have to pay extra attention to making sure our homeless folks are in warm places.

We are close enough in time that I have confidence that the upcoming cold wave will be a reality, so let me start by showing you the forecast of the UW WRF modeling system.    The following maps show sea-level pressure (solid lines) and temperature around 2500 ft (colors).   Yellow and orange are relative warm.  White and light blue indicate just cold enough to snow to sea level.  Dark blue and purple are much colder and "snow friendly."  You don't want to know about white.

Today at 4 PM, moderate temperatures are over most of the domain, with a low center and front offshore.  It will rain tonight and Friday.


Fast forwarding to Saturday at 4 PM, very cold air is moving southward into British Columbia.  Note the large pressure gradient at the leading edge of the cold air.  We often call that the "Arctic Front."


By 4 PM Sunday, the cold air has reached Washington State and there is a large pressure difference north of Bellingham, which will drive cold, gusty flow into NW Washington.  Yes...cold enough to snow.


By 4 PM Monday, the entire NW is in the freezer. But keep in mind, this is not the primo cold air.  The Cascades and Rockies will protect us from that.  (We get "modified" Arctic air).  The really cold stuff will move southward into eastern Montana  (see below).


How confident are we that the cold air will reach us?  

To evaluate that let's take a look at the National Weather Service ensemble output for Seattle's surface temperature (the temperatures of many model runs are shown, each slightly different in how they start).  They are all going for a major  cool-down, with most showing that Monday will barely get to freezing as the day-time high.    It will be cold bike-ride for me to work that day.


What about snow?   The pattern that is being forecast is not a huge snow producer over the lowlands, but the models are suggesting that certain lowland areas will get snow.  

I will talk about this more in a future blog, but here is the forecast 24-h snowfall ending at 4 PM Sunday.  You will notice a band of light snow extending across Everett and Snohomish county.   That is from the convergence of strong, cold flow coming out of the Fraser River Valley hitting southerly flow coming up Puget Sound.  


The next 24 hr snowfall is similar, with NW Washington getting snow, with higher amounts near Port Angeles and Sequim as the cold air is forced to rise over the Olympics.  Snow over eastern WA  and NW Oregon.


Folks...there is a lot of uncertainty in this snow pattern.  We need to wait a day, when the high-resolution forecasts will become available. And while we get hit by cold and snow, Chicago and East Coast will warm dramatically.

January 30, 2019

Are Cold Waves Increasing Under Global Warming? The Answer is Clearly No.

The coldest temperatures of the winter have hit the central and eastern U.S. and misinformation about its origin is now spreading around social and traditional media.

President Trump, of course, tweets about the cold wave, suggesting that global warming has left us, and hopes for its return.  Absolutely untrue.  A cold wave, such as the one hitting the U.S. says nothing about the existence of global warming caused by increasing greenhouse gases.


And then a number of supposedly reputable media outlets, such as the NY Times and the WA Post, that are giving play to the hypothesis that global warming is causing more cold waves, through the "lazy jet stream" mechanism pushed by Dr. Jennifer Francis of Woods Hole and Dr. Judah Cohen. of a private sector firm, AER.


These claims are clearly false:  the observational evidence is very clear:  there are LESS cold waves today than in the past.   Which is exactly what we would expect in a warming world.

Global warming is NOT causing more cold extremes, it is doing the OPPOSITE.

Let me show you analyses produced by U.S. government experts.

The U.S.  Environmental Protection Agency did a study of the trend of cold wave days from 1948 to 2015.   The found very few locations where cold waves were becoming more frequent, but lots of locations in the western U.S. and the East Coast where cold waves were become less frequent, with the West Coast showing a huge decline of cold waves (see below).
A plot of the area in the U.S. covered by extreme cold over the past century (again by EPA) shows a decided decline in cold daily lows.
What about statistics from NOAA?   Here is a plot for the National Climate Data Center on the changes in winter cold extremes over the U.S.  The minimum temperature extremes are warming, not getting colder.  Extreme cold waves are weakening.


And a global view of the trend in daily temperature extremes around the world compared to the global warming signal shows that extreme lows are warming FASTER than the overall global warming signal.  So extreme cold waves are weakening quickly
Trend in the temperature of the coldest day of the year as a multiple of the global mean temperature rise. Source: NOAA/NCEI/GHCN-D stations with at least 50 years of data via the KNMI Climate Explorer.

I could show you much more, but the facts are clear.  There is no increasing trend in cold waves as claimed in the NY Times and other media.  Observations demonstrate that cold waves are declining in magnitude as the Earth warms. 

This makes complete physical sense.   Global warming is preferentially warming the Arctic and northern latitudes, the source region of the cold air that moves southward in cold waves.  And there is little evidence for the "lazy jet stream" theory in observations.

I for one find it really disturbing the such obviously false information is being communicated by major media outlets.  

January 28, 2019

Dramatic Display in the Northwest Skies Today: Super Contrails and Hole-Punch Clouds

I got nearly a dozen emails this afternoon with pictures, mainly from folks around Anacortes and north Whidbey Island to Bellingham, of some very strange cloud formations--namely weird holes in a large deck of clouds.   Here are some examples:

 Courtesy of Tony Bigge

 Courtesy of the Stringmans of North Whidbey Is.

Courtesy of Jason Reid of Bellingham

No...these were not alien incursions into WA air space, but the impact of aircraft passing through a cloud deck of supercooled water (liquid water at 32F or below).   The planes climbing or descending through the clouds caused the supercooled water to turn to ice crystals and fall out, living a circular hole.  These features are also known as "punch hole" clouds and often form in mid-level altocumulus cloud decks.

Now what really got me excited is that the new high-resolution GOES-17 weather satellite actually viewed these from space!  Don's believe me?  Then take a look below!  Absolutely amazing.


But the fun today didn't end there.  We had one of the most amazing contrail days, with huge numbers of them filling the skies..... check out these NASA MODIS images from around 1 PM.  See all the little lines?  Those are contrails in a high deck of cirrus clouds.


 The air was at or close to saturation and the addition of moisture and particles from jet engines produced the multitude of cloud lines.

A picture from the Seattle PanoCam at 8:10 AM this morning said it all:  contrails, low clouds, and a wonderful sunrise--with Mt. Rainier in the distance.  What could be better?


January 26, 2019

U.S. Extremes: Big Warm Ridge over the West and Deep, Cold Trough over the East

There is a lot of talk about extreme regional differences in politics these days, but during the next week, we will see amazing differences between the western and central U.S. in temperature:  

A very strong ridge of high pressure will prevail over the West, with very warm temperatures aloft, while the east will be dominated by a deep trough of low pressure, that will bring extreme cold down to the surface.

Let me start by showing you some very colorful maps created by Alicia Bentley (a NOAA/NWS employee!)  These show the upper level maps (500 hPa pressure level, about 18,000 ft ASL), with the heights of the pressure level shown in black, and a measure of the differences (or anomalies) from normal shown in colors (orange/red are above normal, blue/purple below) normal.

Today at 10 AM (1800 UTC) there is a big ridge of higher heights (think high pressure) over the West Coast and a trough (lower heights/pressures) over the east.   Major anomalies, with the purple colors indicating very usual low heights.


Ridges tend to be associated with sinking air and warm temperatures in the lower atmosphere, while troughs are connected with cold air.   So let me show you the anomalies for temperature around 5000 ft (850 hPa) at the same time as above (10 AM today).  Warm air along the West Coast, but cooler air in the east, with a slug of very cold air moving into Minnesota and environs (see below).


In fact, we do have very warm air above us right now.  The balloon-launched weather reports at Quillayute, on the WA coast, are shown below (the two lines are temperature--the warmer one--and the other is dew point).  Winds to the right and heights are in pressure (700 is roughly 10,000 ft). Very warm air aloft, with a freezing level (when temperature falls to 32F) ABOVE 10,000 ft.  Toasty.

There is some cooler air near the surface, with an inversion (temperature warming with height) in the lower atmosphere.  The mountains will be toasty today.  In fact, at 9 AM Stampede Pass at 4000 ft it is warmer (40F) than Seattle (38F and fog).


The latest satellite pictures shows the low-level fog over the lowlands of western WA/Oregon and parts of eastern WA.


That is the great irony of high pressure over the Northwest in winter.  When we have high pressure over us during mid-winter, with warm temperatures aloft, we can't mix the warm air down and we tend to develop low-level inversions and near-surface fog.    But all you have to do is gain elevation and you can escape the cool stuff. Offshore (easterly flow) can destroy the cold air layer and later in the season, when the sun is stronger, solar radiation can do the job.

But then we get to the story that the media is already starting to pick up on-- the  deepening of the East Coast trough accompanied by a slug of MEGA-COLD air.   Here is the 500 hPa upper level map for 4 AM on Wednesday (January 30th).   Extraordinary low heights over the upper Mid-west (the light purple colors--the anomaly from normal in standard deviations--are amazing).  Ridge of high pressure off our coast (dry for the NW).


The 850 hPa (5000 ft) temperature anomalies (again differences from normal) coming into the Upper Plains state will be amazing and some locations will probably break record lows for the date.


I suspect a certain President will tweet about this event, suggesting it contradicts global warming, and some activist/media types will claim it is the result of global warming.  Neither will be correct.  Perhaps something I will talk about in a future blog.

January 24, 2019

A downslope windstorm over central Oregon

Wednesday morning brought a major windstorm to the eastern slopes of the central Oregon Cascades.   


Winds on Mt. Bachelor accelerated to 105 mph and swinging lifts and falling trees closed the ski area!   Power outages affecting tens of thousands of people from Bend to the nearby foothill communities.  A number of roads were closed by falling trees.


And it was all associated with a relatively small area of strong winds associated with the air flow rapidly descending the eastern slopes of the Cascade barrier. 

A map of the maximum winds Wednesday AM over Oregon shows some big variations.   While winds gusted to 59 mph just outside of Bend, there were half that speed  on the western side of the Cascades.  You will also notice a few scattered high values (60 mph or more) on some scattered high areas of eastern Oregon and Washington.


A forecast of the wind gusts (in knots, color shading) and sea level pressure (red lines) at 7 AM Wednesday from output of the University of Washington high-resolution WRF modeling system shows the fascinating situation.  There was a HUGE east-west pressure difference on the upper eastern slopes of the Cascades with very distinct low pressure areas down on the slopes.  Since pressure differences cause winds to accelerate, these pressure differences produced the very strong winds, with the model going as high as 70 knots (about 80 mph) in places.  Lots of 45 kt areas (blue) are apparent.  The model simulation looks very realistic in terms of the near surface wind speeds.


The origin?  A high- amplitude mountain wave.  

When winds perpendicular to a mountain crest are sufficient large with the proper conditions aloft, air is forced to rise up the mountains and then oscillates up and down on the lee side, producing a series of cloud lines when the air goes up (see schematic below).  You notice that the air is moving downward on the immediate lee slope of the mountain, and because of that there are no clouds.
But sometime when the winds approaching the mountain are strong and the vertical variations in wind, temperature, and humidity are jut right, the wave amplitude can increases resulting in energetic descent and very strong winds on the lee side of the barrier (see schematic).  This is what happened on Wednesday.


A high-resolution satellite image Wed morning clearly shows the strong downslope flow on the eastern side of the Cascades (evident from the sharp clearing east of the Cascade crest and the hint of many mountain wave clouds downstream (the rippling cloud lines).


The big wind, downslope windstorm event was initiated by the development of very strong incoming (westerly) winds near crest level of the Cascades--something illustrated by the 850 hPa (about 5000 ft) heights (like pressure at 4 AM Wednesday) below (wind vector asl shown as are temperatures).  A low center was moving into northern WA and the resulting very large north-south height gradient (think of it as a pressure gradient) resulted in strong western flow hitting the Oregon Cascades.  The strong winds was the key in producing this event...they helped produced the strong downslope flow reaching the surface on the eastern slopes.


Another example of how good our weather forecasting technology has become.  And you really have to love the complex meteorology of our region, with intense local circulations and big changes over space and time because of major terrain barriers, gaps, passes, and land-water contrasts.


January 22, 2019

Why was part of the moon lighter during the total lunar eclipse?

Did you notice that part of the moon was lighter and less red during the total lunar eclipse?

For example, this variation was shown clearly in this picture sent to me by Allan Jones.  Reddish color for 3/4 of the moon, but lighter on the top left.


Or this one from Eatonville, WA:


Keep in mind that the moon was totally in the earth's shadow at this point--within the umbra (see figure below)


So why the variation of color and lighting while the moon was in the earth's shadow?

The reason is that light in the umbra is not uniform because of scattering of light by the atmosphere of our planet.

 If there was no atmosphere or if the atmosphere absorbed all the solar radiation falling on it, the moon would be totally black during such eclipses.   In the real world there is more light in the outer part of the umbra as the atmosphere scatters light around the planet and towards the moon.

In fact, there are a number of research papers that simulate this quite realistically, such one by Vollmer and Gedzelman (2008).  Here is the relevant plot from that research.  The penumbra surrounds the umbra.

This simulation shows more light at the edge of the umbra, darkening towards the center. 

And which part of the moon was nearest the edge of the umbra during the eclipse? 

You guessed it:  the upper left--the lighter part.    Which you can see this geometry in a simulation of the eclipse during its height (9:12 PM).  The umbra boundary is shown by the inner circle.


As noted above, the moon during the total eclipse is illuminated by light being bent around the earth by the atmosphere. 

If you ever want a great illustration of this, take a hop to the International Space Station or some orbiting vehicle after the sun has set (see two examples below).  The lower denser atmosphere, which scatters blue/green colors effectively, leaving red and orange,  has the bright red/orange hue.  In contrast, the thin upper atmosphere has a bluish cast.  It is the light scattered around the edge of the earth by the atmosphere (dominated by the reds) that was illuminating the moon during the eclipse.


The amount of light scattered towards the moon is not always the same.  During periods in which the atmosphere is full of particles (such as after a major volcanic explosion), eclipses can be particularly red and dark.

From a more philosophical angle,  pictures from space such as the above shows how thin are atmosphere really is, accentuating our need to take care of it.

As you can tell, I really enjoy eclipses.  The biggest career decision of my life was whether to go into atmospheric sciences or astronomy, which is why I did my undergraduate work at Cornell, where I could study both (with one of my first papers on a simulation of the Martian atmosphere).

January 20, 2019

You May Be Able to See the Lunar Eclipse Tonight!

There are a lot of folks that REALLY want to see our spectacular lunar eclipse tonight.   And it will not be just any lunar eclipse, but a BLOOD WOLF SUPER TOTAL Lunar Eclipse.

It doesn't get much better than that!

Fortunately, the situation appears more favorable than last night, particularly if you live in NW Washington--and perhaps as far south as Seattle.

The 4 PM visible satellite image (below) shows a zone of clearing from Bellingham across the northern Olympic Peninsula.  Clearly over the Kitsap Peninsula and the northern Olympic coast.  Partly cloud over Seattle. Really good up in southern BC.


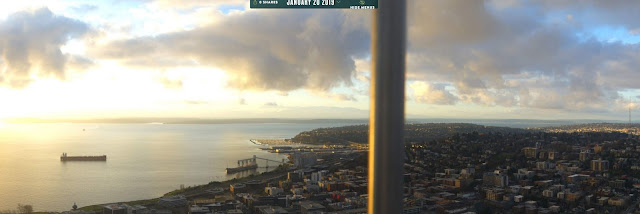
The clouds have thinning out a bit over Seattle during the past few hours, something evident from the Seattle Space Needle Pano Cam...particularly to the west (see below).


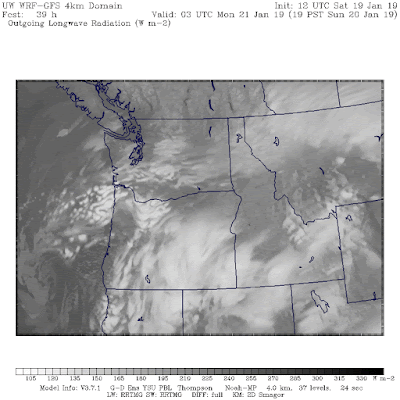
The high-resolution WRF model cloud forecast for 9 PM tonight is consistent with what is occurring this afternoon.  NW WA is the best, but there could well be enough breaks over Seattle to get a glimpse.  Not so good in much of Oregon and SE Washington. 

Fingers crossed.


January 19, 2019

Will you be able to see the Super Blood Wolf Total Lunar Eclipse on Sunday Evening?

There will be a total lunar eclipse on Sunday night that potentially could be quite a sight. 

The shadow of the earth will start covering the full moon around 6:36 PM (actually the penumbra, where the light from the sun begins to be reduced).   The total lunar eclipse will begin at 8:41 PM and end at 9:43 PM.   The eclipse will be over at 11:48 PM.


Total lunar eclipses are not as rare as solar eclipses (typically one can see total lunar eclipses every other year on average), but they can be impressive.

For me the best part is the reddish cast of the eclipsed moon, the result of light be scattered by the earth's atmosphere.  As you all know, the sun typically has a reddish cast at sunset, the result of short-wavelength light (like blue and green) being scattered effectively by the atmosphere, while long wavelengths (like red) are scattered less and thus can get through the atmosphere better.  Thus, red light can propagate more effectively towards the moon, giving it a reddish hue.


Because of the reddish color,  some people call it a blood moon.  The first full moon of the season is called a wolf moon, for reason's you will have to talk to a wolf about.   And since the moon will be very close during this eclipse, and thus large, it is also called a super moon.    Wow...a super, blood wolf total lunar eclipse. 

Certainly sounds impressive.

But will you be able to see it?  

That is not so clear....but I have some advice for those of you desperate to view it.

The latest UW WRF model forecasts show a weather system going south of us tomorrow night, with rain over Oregon (see 3-h rainfall ending 7 PM Sunday below).  If you are in western Oregon, your chances to see the eclipse are very poor.


But to get more insight, let me show you the cloud forecasts by our computer forecat model--actually the total cloud water content in a vertical column.  Whiter indicates thicker clouds. 

At 7 PM Sunday, there will be a thin veil of clouds (mainly middle to upper level) over the southern two-thirds of WA state.  There might be some clear spots over NW Washington and southern BC.


During the next three hours, this thin upper cloud deck moves northward.  It may be thin enough in places to see the moon is being eclipsed.


Another approach is to show you a simulation of an infrared weather satellite image based on our computer simulations.  Below is one for 7 PM Sunday.  Oregon is generally not good for viewing--except for perhaps a break along the coast, but there will be breaks in the clouds over portions of Puget Sound and NW Washington.  You have a chance if you are living there.


As in any forecast, we should look at ensembles of many forecast to estimate probabilities, so here is an ensemble of simulated satellite cloud images for 7 PM Sunday (click to enlarge).  Most of the simulations show broken clouds over western WA, but some do have have big breaks. 

There is a chance those of us near Seattle might see at least part of the eclipse. Traveling to NW Washington will increase your chances of viewing the action.  But there will be an element of luck in being in a place where one of the cloud gaps occur. 

To paraphrase Clint Eastwood:  do you fell lucky?  

The Highest Pressure in Ten Years

 Did you feel the pressure yesterday?    Feel a bit weighted down?    If so, it may not be due to the political energy in the air. Yesterday...