May 31, 2014

The Official Summer Forecasts are Out: Can You Believe Them?

Earlier this month, the press was highlighting the latest update of the official National Weather Service summer forecasts, produced by the Climate Prediction Center (CPC).


Here are the latest  predictions for June, July, August for temperature and precipitation by the CPC (see below).  In the Pacific Northwest, the NWS is predicting warmer than normal temperature (reddish color), but had no reason to predict anything different than normal for precipitation (white or equal changes (EC) of above or below normal precipitation).  They were going for a higher probability of warm temperatures in California.


I should note that this forecasts are manual/subjective products, based on forecaster judgement, a variety of statistical tools, the output from extended-range models,the current state of El Nino/La Nina and the cycles like the Pacific Decadal Oscillation,  and other sources of information.  Sort of the meteorological version of sausage making---you might be surprised what goes into it.

Most Northwesterners would welcome warmer summer and we generally don't get much summer precipitation anyway (and our snowpack is in good shape), so this looks like a favorable forecast for us.

But can you believe such seasonal forecasts, even this close to summer?   Do they have any real skill?

The answer:  skill is marginal at best.

Editorial:  You would think that the National Weather Service would have good verification statistics available on their web site  for their long-range predictions, but as with most product verification, their offerings are weak or non-existent.  They have an interactive verification tool that does not work ( I have tried on several platforms).  Providing the public with good verification information about their forecasts should be a priority for the National Weather Service; they seem to give this task little resource and don't maintain what they have.

So, let's look at what they do have.   First, how well did the summer seasonal forecasts go during the last three summers over the Pacific Northwest?

First, 2011.  Left panels are for temperature, right panels precipitation. Red indicates above normal temperatures, blue-below normal temperatures) Green above normal precipitation, yellow, below normal precipitation.  The upper panels are the official forecasts, the bottom panels are observed conditions.

For the Northwest, they missed the observed, cooler than normal temperatures. Precipitation was better, but again summer precipitation is not a significant parameter around here.


2012?  They did not forecast temperature conditions to be different from climatology, but it turned out to be colder than normal.  Precipitation was wetter than normal and they were going dry.


2013 was perhaps a bit better.  The dry conditions in the the far SE interior of the Northwest were caught, but not the wetter coast and warmer remainder.


 Here is a map the skill of their summer subjective forecasts compared to climatology (called the Heidke Skill Score).    100 is perfect, 0 is no skill compared to climatology.  Negative is worst than climatology.  Climatology is just forecasting the average conditions for a location.  You will note that over most of the Northwest the summer prediction skill is quite low (less than 10).  Better skill over California and the SW U.S.  Very poor skill in general east of the Mississippi...even worse than climatology over much of the Northeast U.S.


So my advice to you is not to take summer seasonal predictions over the Northwest very seriously.  They have very little skill compared to just predicting climatological conditions. And you don't need to be a weatherman to do that!

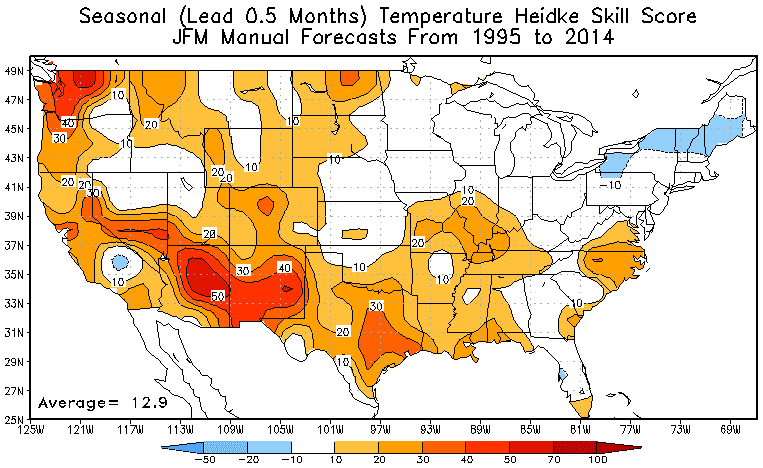
But don't get too depressed about this.  Our skill for predicting seasonal weather over the Northwest is considerably better during the winter, particularly during strong El Nino and La Nina years.   For example, here is the same figure as above for January, February and March;  western Washington is one of the most predictable places in the nation!


And new prediction tools, like the advancing Climate Forecast System (CFS) numerical modeling system, will progressively improve in time.    In fact, I am working with others at the UW to build a seasonal prediction capability combining high-resolution modeling with the NWS global CFS system.  Early results are promising and we are looking for funding now to push this forward.

May 28, 2014

Why Thunderstorms in the Desert?

Today was a very unstable day around the area, with heating causing the air to percolate and convect. Convection, which is associated with cumulus and cumulonimbus clouds, is generally associated with a large change in temperature with height and forced  lift (upward vertical motion).  And we had plenty of both today in the area.

Take eastern Washington.  Here are three visible satellite images over Washington State and northern Oregon today at 9 AM, 11 AM, and 4 PM.  At 9 AM it was virtually clear east of the Cascades crest and down into the Columbia basin   This is not unusual because that area is the zone of downslope flow during normal westerly flow aloft.  By 11 AM, some shallow cumulus was forming on the hills of the eastern slopes and a few big cumulonimbus clouds were firing off over the Okanogan.  But by 4 PM, major convection was firing off over the normal dry eastern slopes and the Columbia basin.


Here are the radar images for roughly 9 AM and 4 PM.  Big difference, with heavy showers over SW Washington and over the Columbia Basin during the afternoon.  Radar coverage is poor over the eastern slopes, so the radar imagery is underplaying it.


So what was going on?   Aloft, we had an upper trough over us that was associated with cool temperatures. To show this, here is the 500 hPa (about 18,000 ft) forecast from the UW WRF model for 2 PM..  Colors are temperature and solid lines are heights (similar to pressure).  The blue colors are cold temperatures.

The sun is very strong now (we are less than a month from the summer solstice) and thus has great potential to heat the surface.  Cold aloft and warm at the surface produces a big temperature change with height (or temperature gradient), which in turn leads to atmospheric instability and overturning.  A frequently used measure by meteorologists for the potential instability of the atmosphere is CAPE (Convective Available Potential Energy!) and here is the plot of it for 2 PM.  Because we don't get very warm at the surface (and because our humidities are low--which also helps convection), we generally have wimpy CAPE compared to the central and eastern U.S.   Today's CAPE was pretty high for us: values getting to around 500.  But look how much higher it was in eastern Montana (2000-3000!).


So the sun had a good shot over the clear zone of eastern Washington this morning, leading to warming and substantial instability.    But there was something else.

Convection is substantially aided by a little lift to push parcels of air upward.  Sort of priming the pump of instability.   As the upper trough moved eastward today, it created lift that encouraged the release of convection.  Lightning detection networks indicated dozens of strikes over eastern Washington;  perhaps this is the origin of a substantial fire that begin near Wenatchee around 4 PM (see image courtesy of the Wenatchee World newspaper)


May 26, 2014

Memorial Day Nowcast and an Amazing Record

Yesterday's forecast was not a great success;  rain came in on Sunday far earlier than predicted.  This illustrates a weakness in the weather prediction toolbox:  weak, small scale systems are difficult to get right.    A major issue is the lack of high-resolution weather data over the ocean, something that should improve with advancing satellite sensors and better data assimilation (the use of data to describe the 3D state of the atmosphere).

So let me switch into nowcasting...short term prediction....mode.   Today looks quite a bit better than expected, particularly if you are in the right places.

Here is the 10 AM radar.  Showers are occurring on the windward slopes of the Cascades and coastal mountains as moist, unstable flow is forced to rise.  Dry in the Columbia Basin.  Some light bands of showers coming in off the ocean and if you look closely there are some showers around Everett...associated with a Puget Sound convergence zone.


A recent visible satellite image shows the shows offshore, enhanced clouds on the windward (western) side of the mountains and a clear indication of the Puget Sound convergence zone north of Seattle.  Do you see the enhanced clearing over Seattle and the south Sound?  A classic CZ signature.


So you want to decide on your outdoor activity this afternoon?  Western slopes of the WA Cascades will be damp and cloudy.  Sorry.  The convergence zone may strengthen and move southward to Seattle.  Here are the 3-h UW WRF forecasts ending 2 PM, 5 PM, and 8 PM today (Monday).  Outside of the convergence zone the lowlands look dry...and don't take this forecast as gospel...the phasing and timing of the CZ could be shifted by hours.     Watch the radar


A completely independent system is the High Resolution Rapid Refresh run by NOAA.  It's one-hour precipitation forecast ending 2 PM and 5 PM are similar to WRF, but a bit drier.  Still some convergence zone activity but less near Puget Sound.


So if you are south of Seattle...fire up the grill.  If you are in Seattle, watch the weather radar!  The convergence zone precipitation is relatively narrow (perhaps 5 miles) and you can time you way to a dry meal.

And the amazing record?   Here is a notice released by the Seattle National Weather Service office:

.CLIMATE...THE RAINFALL TOTAL AT SEATTLE-TACOMA AIRPORT WAS 0.22 
INCHES SUNDAY. THIS MAKES THE RAINFALL TOTAL SINCE FEBRUARY 1ST 
22.87 INCHES. THIS BREAKS THE RECORD FOR THE WETTEST FEBRUARY 
THROUGH JULY IN SEATTLE. THE OLD RECORD WAS 22.81 INCHES SET IN 
1972.   FELTON/MCDONNAL

You knew this was a wet late winter/spring, particularly mid-February through mid-March.   But to beat the Feb-July record in MAY is really notable.


May 25, 2014

Updated Memorial Day Weekend Forecast and Paradise Snow

Many of you have outdoor plans this weekend, so here is the latest weather forecast.

There is substantial cloudiness over Washington State this morning, particularly along the coast the northern half (see vissble satellite picture below at around 9AM Sunday).  Clouds thin over southern Washington and Oregon, with substantial upper-level cloudiness.


The current radar image shows rain offshore (invisible without the Langley radar!) and stretching to the U.S./Canadian border).  Raid is being observed now at Bellingham, Orcas Island and on the northern WA coast. A few light showers are moving into the interior, but they are very light and most of the precipitation will not reach the surface.


The latest National Weather Service forecast for today (Sunday) shows temps getting into the 70s over eastern Oregon/Washington and in the Willamette Valley, and far cooler over coastal Washington.


So today (through around 4 PM) will be decent away from the coast and NW Washington.  S

But then thing go downhill fast later today and Monday--so be prepared.  Let me show you the 3-h rainfall ending at certain times from the UW WRF model.  First 2 PM today (Sunday).  Light rain over NW WA and southern BC.


The 3-h rain ending 8 PM Sunday  shows rain, some heavy, pushing inland into Seattle to Portland.  Barbecue and picnic advice:  DO IT EARLY or WATCH THE WEATHER RADAR.

 Another pulse of precipitation comes in on Monday associated with an upper level trough.  Here is the 3-h precipitation ending 8 AM Monday.
 And 5 PM Monday.  It won't rain all day, but there will be several band of precipitation moving through and temperatures will be 5-10F cooler in many places. See NWS forecast below.


If  you want to plan your activities in real time, an excellent radar summary map is provided by my department (and shown above).  You can access it here.  Or get a radar app for your smartphone.  Many "professionals" use radarscope.

Yesterday I was cross country skiing with some friends at Paradise on Mount Rainier.  LOTS of snow there (see image).


The snow depths there are well above average.  Here is a plot of the cumulative precipitation and amount of water in the snow (SWE or snow water equivalent) at Paradise (the NRCS Snotel).  The light blue is the snow water (SWE) for an average year and the dark blue for this year.  We are well above normal!   So if want to play in snow, there is still plenty around Paradise.


May 22, 2014

Memorial Day Weekend Forecast

The Memorial Day weekend forecast is always an important one.   Yes, many people will be on the the road this weekend, and parades, picnics and other outings are popular.   The weather is generally not reliable yet, even though we have usually had a taste of warmth by this time.  And many weather-related tragedies have occurred during this period:  from avalanches, high and fast water in rivers from rapid melt, and even snow white-outs on high volcanic peaks.


This year we will  get the worse weather out of the way early, as a moderate front moves through Washington and northern Oregon on Friday morning and early afternoon (see 3-h precipitation ending 11 AM Friday below).  We need the precipitation, there hasn't been anything significant for over a week.

After the front moves through Friday afternoon, there will be some minor showers over the lowlands, some light rain on the western slopes of the Cascades, a heavier rain in the Puget Sound Convergence Zone between Seattle and Everett.

Saturday will be a partly cloudy day, with considerable clouds over western Washington.  A few light showers will remain.  To illustrate, here is the precipitation forecast for the 3 hours ending 2 PM.


Want guaranteed sun? Head east of the Cascade crest, as illustrated by the cloud forecast for 11 AM Saturday. Saturday temps getting into the upper 60s away from the water over western Washington.


Sunday will start dry, but a moderate front (and a fairly strong offshore low) will approach late in the day (see precipitation forecast for the 3-h period ending 5 PM). Rain will reach the coast during the mid afternoon, but the interior should remain dry to around dinner time.  Eastern Washington will be warm as will be the Willamette Valley (both in the 70s,see temperature map at 5 PM below).


The front will go by on Sunday night and Monday there will be scattered showers and considerable cloudiness.   No big winds during the weekend, although it will get blustery along the Washington coast on Sunday afternoon.  Enjoy the weekend.

May 20, 2014

Was there a mini-hurricane off the Northwest coast on Sunday?

This weekend there was an amazing sight in the satellite imagery off our coast, from roughly 8 AM through 2 PM.  Here is a close up shot around noon from the NASA MODIS satellite.   Looks like a hurricane with spiral rain bands. Or a spiral galaxy.


It actually was quite small.  To get some perspective, here is a wider view.  See it due west of the NW tip of the Olympic Peninsula and southwest of Vancouver Island?   It was about 60 km (36 miles) across.


A few hours later it started to dissipate but still had an other-worldly look! (again, giving you both views)


Want to see an animation of this "mini"hurricane?  Check out this animated gif (special thanks to Jeff Knecht for bringing it to my attention):

Or go to this link.

Earlier in the morning the Windsat sScatterometer satellite passed over the region (scatterometers useicrowave radiation to measure capillary wave amplitude and from that wind speed/direction).  This image, or roughly 8 AM, suggests some rotation off the northern Washington coast (click on image to make it larger)

And here is the image from another scatterometer around noon....you can see two areas of rotation, with the NE one associated with our little hurricane.
Impressively, high resolution numerical forecast models had a handle on this feature.  To prove this, here are the surface winds and sea level pressure forecast for 8 AM Sunday from the UW WRF model (this was a 3hr forecast).   Look closely and you will see the circulation, admittedly with a small error in the location.


Our little hurricane had a very week pressure signature and very modest (roughly 10 mph) winds.  The signature was limited to low clouds (unlike real hurricanes) and its origin could have been either from a weak upper level disturbance or from some kind of instability process associated with horizontal wind shear (although the amount of shear was very weak).

Anyway, an interesting phenomenon

Lunchtime Climate Series 

Finally, if anyone is interested, the Seattle Chamber of Commerce is continuing its lunchtime climate series in downtown Seattle next week.

More more information, the link is here.


May 18, 2014

Is Mediocre Math Good Enough for Seattle Public Schools?

On Wednesday, the Seattle School Board will consider the selection of Seattle's future elementary school math curriculum.

For the past several years, Seattle Schools has used one of the worst math curricula imaginable, Everyday Math.  These texts, based on "discovery principles", ensure that students don't gain competency in basic mathematics but spend a lot of time in group discussions, calculator use, and learning arcane and inefficient approaches to mathematics.   Districts across the country have dropped it, including most districts here in the Northwest.  A complete disaster for students with objective scores showing that it ill-prepares students for middle or high school math.

So after such failure, you would think that the Seattle School district and its curriculum administrators would want to get it right this time.  I have a story to tell here and will outline some options that the School Board might consider to salvage the math education of Seattle's children, with most important being dual adoption of Math in Focus and enVision math.

To understand what has happened here in Seattle, a key problem has been the Seattle district bureaucrats that oversee curriculum development.  They have repeatedly attempted to push the curriculum choice towards discovery math and have evinced a highly anti-democratic stance, suppressing the influence of community input.  But we are also fortunate that a majority of  the school board (Peaslee, McLaren, Peters, and Patu) have interceded time and again to ensure our students have a chance for a better math education.  Without them we would be lost.


Last year, the district established an Elementary Mathematics Adoption Committee (MAC) and announced it would be open to applications from the community. After the district administrators repeatedly found excuses to reject candidates that were known to support direct instruction (explaining a concept, demonstrating it, and then doing exercises to ensure mastery), the School Board stepped in and asked Superintendent Banda to make sure there was some balance on the MAC.  A few reasonable folks were added (but still a minority).

An initial screening of the available curricula identified 8 programs:

Envision
Math in Focus
My Math
Go Math!
Ready Common Core
JUMP
Connecting Math Concepts
Origo Stepping Stones

As I have described in some of my previous blogs, it was clear that the best curriculum was JUMP math, with Math in Focus (the American version of the justly well-known and effective Singapore Math) a clear second.  EnVision was third, based on its excessive verbiage and attempts to satisfy discovery math proponents.  JUMP math uses an incremental approach that explicitly takes the reader through every step in the thought process. The content is rich, deep, and contains considerably more mathematical insight than the other programs. JUMP math is also inexpensive, without the excessive color graphics U.S. publishers use to hike the costs.

The MAC committee allowed online and limited community walk-in  feedback.   The community online feedback was overwhelmingly supportive of Math in Focus and Jump Math .  The walk-ins went strongly for Math in Focus, with JUMP Math and Go Math as close seconds.

The MAC committee was supposed to select three finalists..instead it picked four, including My Math, a poor choice for a number of reasons (including being an Everyday Math clone).  Even though JUMP math was a clear favorite by the community, the MAC committee did not select it because it did not "align well" with Common Core.

(Common Core is a national math standard devised by the National Governor's Association with funding from the Gates Foundation and others.   It is the latest education fad and there is little evidence that t  promotes better understanding of or facility with mathematics.  A careful review of Common Core math revealed that it is inferior to the current Washington State math standards)

However, the local representative for My Math went against district policy in contacting schools throughout the district and was forced to withdraw.

So we were down to three curricula as finalists.

Math in Focus
enVision
Go Math!

and the superior and inexpensive JUMP math was removed. Go Math is a very poor book, heavy on color graphics and very light on math.   Two weeks ago, the MAC committee released their final rankings:

1. enVision
2. Go Math!
3. Math in Focus (MiF)
4. No Recommendation

Unbelievable.  Math in Focus, based on the highly successful Singapore math approach was not recommended.  Glossy, weak  Go Math! was second.  And the mediocre (but better than the current Everyday Math) was first.    Community input was ignored.

You would not believe one reason given to downgrade MIF:  that it advanced students too quickly and thus was not well aligned with Common Core.  You have to shake your head at such nonsense.  The MAC committee was stacked by Seattle curriculum administrators that were not sympathetic to the straightforward, skills-based Math in Focus or Jump Math. The bureaucrats did all they could to to accentuate negatives about MIF and Jump Math, made community input difficult, and downplayed community input when it was given.  They were not interested in the preferences of the community and of parents.

By the way, you remember the front page article in the Seattle Times talking about the miracle math achievement of a low-income elementary school in Auburn?  You want to know what textbook they used? Math in Focus.

So should the district accept a mediocre text (enVision) or should the Seattle School Board do something different?   Many have suggested that the Board would be well within its legal rights to vote for dual adoption: allowing Seattle public Schools to to have the choice of enVision or Math in Focus.

If legal, the board  should push for triple adoption adding Jump Math as an option.   If not, Seattle parents are well advised to pick up some JUMP Math books for their children to practice at home.

So if you are a parent or a concerned Seattle residents, please let your school board member know how you feel, particularly if they are not one of the enlightened four noted above.
Jose´ Banda, Superintendent - jlbanda@seattleschools.org
Charles Wright, Deputy Superintendent - cewright1@seattleschools.org


Should I Let AI Write My Blogs?

I spend a lot of time thinking about and writing my blogs.   Could AI apps do the work for me?   Could any of you tell the difference? Well,...