Perennially chilled Pacific Northwest folks are naturally interested in warmth and so I thought I might share some results of very interesting article in the Bulletin of the American Meteorological Society, which attempts to find the hottest place on earth and here in the NW. (Article is by David J. Mildrexler, Maosheng Zhao, and Steven W. Running of the University of Montana)
Do a search on the warmest place on earth and you typically get El Azizia, Libya with a record air temperature (at 2 meters) of 136F measured in 1922. Furnace Creek in Death Valley National Park comes close 134.1F. But there is another way to measure temperature--- determining the temperature of the ground (the skin temperature) from space. We can do this by measuring the amount of radiation emitted by the ground (sort of like a super ear thermometer that uses similar technology) Now this satellite approach has the advantage that it measures the temperatures everywhere and there is a good chance there is no observation at the hottest locations (who would want to live or work there!). On the negative side, this is not air temperature, which is generally less than skin temperature on hot, sunny days--sometimes a LOT less.
Anyway, these folks at U. of Montana used data from 2003-2009 from the MODIS satellite, which has a resolution of roughly 6 km (so it is probably missing the absolutely hottest points).
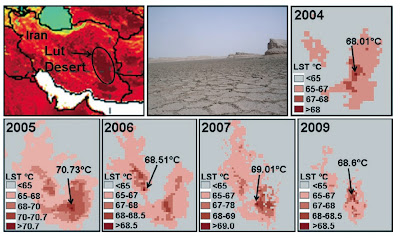
Ok, get your icy drink ready...here is the answer. This graphic shows you the results. The warmest location seems to be in the Lutt desert of Iran. The second graphic shows you a blow up of the temperatures and an image of that desert. Looks like hell. It is like hell.
Several places come very close....but Lutt is the winner.
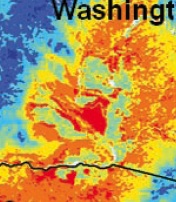
But what about the Pacific Northwest--where is the warmest ground to be found (I suspect there is going to be a stampede there in a few weeks)? Here is the graphic. The left shows the temperatures and the right the land use (click on image to expand)..
Looks to me that the warmest location is on the Hanford reservation where there is no irrigated fields. Such fields have a large impact on temperature, something you can see by comparing the temperature map (blown up version below), with a google maps satellite image (also shown). Evaporation off irrigated fields can cool temperatures down several degrees (F).
No jokes about warming from the radiation at the Hanford facility...this is not the cause. And there are a few warm locations just south of the state boundary as well. Anyway, another reason to head to the Tri-cities during the spring and fall when it gets cool on the west side. But don't try this during winter!---the lowest elevations of eastern Washington are cool and cloudy in midwinter, as cold, moist air settles into the terrain bowl in that area.
This blog discusses current weather, weather prediction, climate issues, and current events
Subscribe to:
Post Comments (Atom)
One Day "Heat Wave" Followed by a Week of Dry Weather
If you have an umbrella, put it away...you won't need it for a while. Find your sunglasses...you will need them. A major mid-winte...

-
In act one of this meteorological drama, yesterday and this morning brought heavy rain and flooding to many sections of western Washington. ...
-
The heavy rainfall is over, but some rivers are still rising. The most impactful atmospheric river event of the past few decades. Consider...


One can really see in the global mosaic the importance of equatorial rain forests for keeping temperatures down in those regions.
ReplyDeleteDoes the color matter, too, with light colored soil being slightly cooler than dark?
ReplyDeleteCliff: When you say that the resolution of the MODIS satellite is roughly 6 km, does that mean that it measures the average temperature of a 6 km by 6 km square or the average temperature of a 6 km diameter circle or it measures the temperature at points on a 6 km by 6 km grid or that when it reports a temperature the location could be off by as much as 6 km?
ReplyDeleteI'm surprised that the Dead Sea area (Israel or Jordan) didn't make the list, as being below mean sea level (-424 m) is an advantage and they have a considerable margin over Death Valley
ReplyDeleteAh, that would explain why it got to 100 degrees at Hanford this summer, but not in town at Kennewick. I've always noticed the Hanford temperatures seemed to run higher that the in-town ones, but never realized why.
ReplyDeleteI dunno, I'm kinda pessimistic of the MODIS satellite readings....
ReplyDeleteThe google earth and the radiation map is right on. Thats cool. You're right, our irrigated vegatation keep temperatures down several degrees, maybe a few. 1-4 degrees. But that map has a boundary of 35C to 55C lol.
Its just to dependant on the topography of the landscape. Rock, sand, dirt, water, trees, etc.
A 1km resolution of downtown Seattle on a 100 degree day would show hell on earth.
Very interesting blog. Well done on blog of note - http://goo.gl/EldwJ
ReplyDeleteAmazingly informative. Congratulations on the "Blog of Note." We will be travelling to Alaska and the Northwest in the next month and blogging about it on our food blog:
ReplyDeletewww.bumblechickfood.blogspot.com
Check us out!
Boy, I can reiterate what you mentioned about central WA during the winter months! Quite often we will have a two-week period where we don't see the sun and there is very little diurnal temperature variation. It is very much like living in a bowl--a bowl with a lid on it!
ReplyDeleteCliff, where are the 85+ temp predictions coming from for this week, and why is my Ballard area NOAA forecast so different? KING5 says for seattle: 82, 84, 86, 87, 88. NOAA for Ballard says: 71, 73,74,74,74. 14 degree difference in temperature predictions?! Ballard is not THAT different from surrounding Seattle! :)
ReplyDeleteCONGRATULATIONS on being chosen a Blog of Note!
ReplyDeleteSteve
Common Cents
http://www.commoncts.blogspot.com
The name for warmest palace within Lut desert is "Shahdad".
ReplyDeleteNot sure about being "perennially chilled", but certainly "ineligible to complain about the heat, relatively speaking"; unless, of course, you talk about the coastal towns (like Westport, WA or Newport, OR) then sure why not.
ReplyDeleteStill, all the charts were good to look at.
Of more incidental note where regarding the more specific subject of temperature being measured "from space", .. With main temperature data derived in this way being of interest to me relative to my main interest and study both weather and climate related — if colder, air mass both movement together with distribution, .. recently I've found an interesting site-page, interactive and authored by NASA /- and if set up more broadly to generate forecasts of change where considering several different parameters, .. where "skin surface temperature" is in fact able to be compared with 2-meter temperature, fairly handily. / — i.e In the case that anyone reading this article above might perhaps be interested in looking into this comparison more.
ReplyDeletehttp://gmao.gsfc.nasa.gov/products/nwp/ —> WMS Viewer: GEOS-5 Meteorology
It is true.... this place, the "dry shitties" is hot as hell....
ReplyDeleteGreat information as to why the Hanford site is much warmer than the rest of the area.
this helped alot
ReplyDeletecamelama:
ReplyDeleteI had guessed that the figures you gave from KING-5 was their own "error"; but below is the link to the current official (NWS) forecast for the area (note the pink area) roughly bounded by NW 80th, 24th Ave. NW, Market, and out over the water. It is really dramatically cooler! Generally, each forecast area further from the water is warmer.
http://forecast.weather.gov/MapClick.php?lat=47.67579094347484&lon=-122.39842414855957&site=sew&unit=0&lg=en&FcstType=text
Lindsey, right ... but if you check current temps throughout the day, both at that actual NOAA forecast page and from local temperature gauges listed on Wunderground, it's typically 10+ degrees higher than that forecast. And has been for days. So why such a low forecast, when there are several days of 10+ higher temps higher than forecast? Where is NOAA's temperature gauge - do they have one in this area? Is their forecast for my neighborhood an extrapolation of historic data? If so, then why haven't the last few days bumped up their forecasts? They weren't "off" like this during previous heat waves. This fascinates me.
ReplyDelete