But why are we certain about the warm-up this week when sometimes our confidence is far less?
The answer: ensembles of many numerical weather forecasts
For example, the U.S. National Weather Service and the Canadian Meteorological Center both contribute 20 global forecasts, twice a day, to create the North American Ensemble Forecast System (NAEFS).
If these forecasts are mostly on the same page, one has a lot more confidence in the forecast. If they are very different, less confidence.
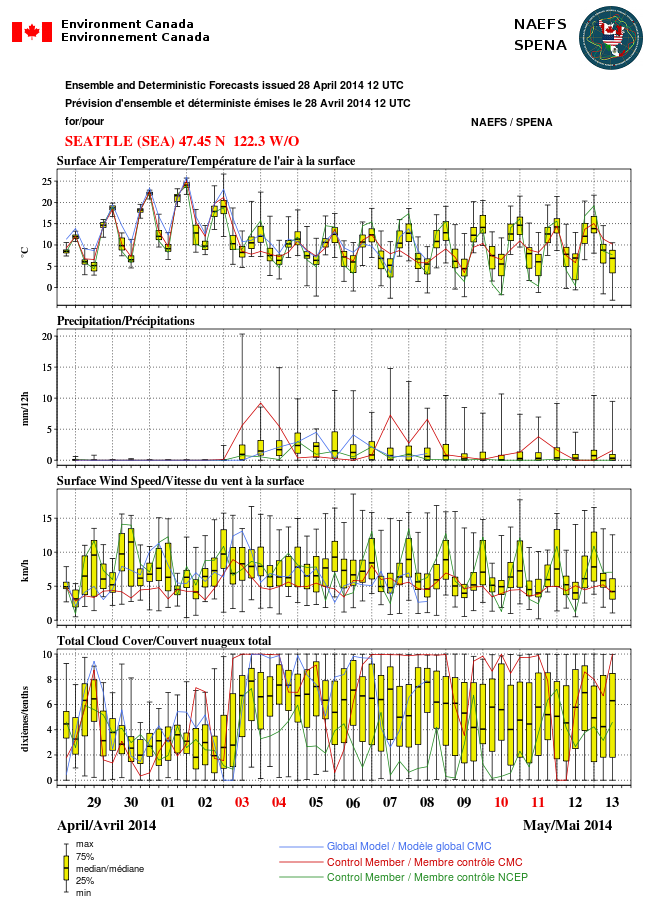
So lets take a look at the latest NAEFS forecast for Seattle. First, the complete output for several parameters.
You notice a lot of the data points are shown with what we call a box and whisker plot. The median of all the forecasts is shown by the horizontal line in the middle (half of the forecasts are above and below). 50% of the forecasts (25% below the median and 25% above the median) are within the yellow box. The extremes of the ensembles are shown by the "whiskers."
Looking at the second panel above, the models are in great agreement that there will be no rain through May 2. Temperatures are shown every 6 hours (top plot). You notice temperatures are warming rapidly the next few days, with the models in substantial agreement on the high temperatures (little spread). So we have confidence in this prediction. You will also see that a cool-down is predicted on May 3, but the agreement is less.
The European Center has a VERY good global ensemble system and here is the ensemble forecast for temperature at about 5000 ft (850 hPa). The mean of the ensemble is shown by the blue lines--the mean of the ensemble is often a very good forecast. Quite warm...16C reaching us at that level. The shading show a measure of how much the ensembles vary (standard deviation). VERY LITTLE VARIATION, which mean a very confident forecast.
So buy that bag of ice...you WILL need it. And lets end by looking at the high resolution (4km) WRF forecast for surface air temperature and wind...which should be very skillful based on the above. Tomorrow at 5 PM, should get to around 70F over western Washington, warmer in the Willamette Valley. You see the easterly flow? That will really rev up the temperatures by removing the marine influence and warming air by compression as it sinks west of the Cascade crest.
Mid 70s on Wednesday afternoon at the same time.
And looking at the 12-km forecast for Thursday at 4 PM (May 1), temperatures get up near 80F over the western lowlands and the Columbia Basin But you notice that the winds have switched directions and have begun to flow from offshore...this will be the last warm day. In fact, the last warm day of the sequence is frequently the warmest.
With easterly flow, the warmest temperatures on several of the next few nights will be over the western foothills of the Cascades (see example below for 8 AM Thursday). Why the foothills? Because that is where the air had been sinking and warming as it descending the slopes.
\


Cliff, you blew it. Got to 77 here in West Seattle.
ReplyDelete:-)
Redmond is going to have record highs the next 3 days.
ReplyDeleteGlobal warming is here, it's real and we have to act NOW.
At my house on the Bothell-Mill Creek line it reached 87 yesterday!
ReplyDeleteBut I notice that I tend to have a different temperature profile from Seattle. When I returned home (played hooky for an excellent and balmy cross-country ski trip) Wednesday at 6:00 pm, my recording thermometer showed the 87 degree maximum, but that current temp had already dropped to 75.
But Seattle, which had maxed at about 82, was (according to the news) still 81. So their heat tends to "hang on" later in the day, and I have observed this before. Is it because I am further from the Sound but also there is more vegetation, and more evaporative cooling?
Global warming is a fleeting phenomenon, but ocean acidification is more persistent, as CO2 plays a more direct role in pH than in temperature. (brief summary).
ReplyDeleteYesterday and today were had maximums in the low-mid 80's. A good start for May.