March 31, 2016

Bird Migration on Radar: What Weather Conditions Encourage Our Feathered Friends

I have to admit I find bird migrations on radar quite fascinating, and last night was a wonderful example.

It was a classic, with the skies filling with bird echoes right after sunset and then disappearing near sunrise.

Let me show you.

 7:30 PM last night (Wed).  Not much

9:30 PM that night.  Lots of birds.  They don't like to fly offshore.  Smart birds.

 2 AM.  Even more birds.
 5 AM. Still there
 7:30 AM today (Thusday).  They are gone.

Our radars are Doppler radars, which means we can get velocities towards or away from the radar.  The Langley Hill radar at 2 AM shows the birds are moving northward, with green colors to the south (approaching) and yellow to the north (going away).  Right direction.


A few years ago, the National Weather Service radars were upgraded to dual-polarization, which allows them to tell the shape of "targets."   This information can be used to determine what the targets are composed of.  Here is the output hydrometeor classification algorithm at 2 AM.   It is going for BI or birds (gray color)..undoubtedly, a correct interpretation.

So what kind of weather do birds like to fly in?  The famous Cornell Lab of Ornithology has a a wonderful site called BirdCast, which has a lot of this information, including migration forecasts.


According to this site, birds don't like flying in rain (who does?) and they prefer to have winds at their back (ditto).

With a ridge of high pressure over us now, there is no precipitation...so their feathers will be dry.

The winds?  Here is a time-height cross section of the winds above Seattle-Tacoma Airport for the period.  Time advances from right to left. The vertical axis is height, from sea level up to about 10,000 ft (700 stands for a pressure of 700 hPa).  The wind barbs (blue color) show light winds, from varied directions. Time is in UTC (GMT).   Good conditions for birds.   So with ideal weather in early spring, the birds were ready to move northward last night.

__________________________
Talk announcement:
"El NiƱo, and the Rise of the Pacific as Global Climate Pacemaker"
  

Thursday, April 7, 2016
7:30 – 8:30 p.m.
Location: Kane Hall (KNE)
Campus room: 220
Speaker:  Shang-Ping Xie, Professor, Scripps Institution of Oceanography, University of California San Diego
Please RSVP for the lecture at http://tinyurl.com/GSDVL2016-RSVP.

March 29, 2016

El Nino is Weakening Rapidly

The strong El Nino that has influenced our weather for much of the winter is now rapidly weakening.  But there is considerable uncertainty what will happen next: will next year be a neutral (La Nada) or La Nina period?

Lets start by look at the sea surface temperature anomalies (differencea from normal) for a few areas in the tropical Pacific.  The Nino3.4 area is often cited, and as you can see, this temperature anomaly has dropped from 3 to 1.5 C...a big drop.  Even more dramatic is the decline in the temperature of the Nino1+2 area near the coast.


Even more dramatic, is the change in heat content of the upper ocean in the central and eastern tropical Pacific (see below),  from well above normal to BELOW normal.
You can visualize this change by looking at vertical cross sections through the upper tropical Pacific ocean at several times during the past few months.  The red area...a layer of warm water near the surface has greatly weakened and thinned.

So what will happen next winter?  This is a bad time to ask the question, since the skill of our models, both dynamical (physics-based) and statistical, are poor during the early early to mid spring.  Virtually all show a weakening of the strong El Nino of this winter, but some show a weak El Nino continuing, some showing near neutral conditions, and a few even suggesting a La Nina (cooler than normal waters).


In short, there is large uncertainty in our predictions for next winter and we will have to wait until June or July to have a better idea.


March 27, 2016

Huge Ridge and Extraordinary Weather Ahead

A front went through last night, behind which cool, unstable air flooded into the region (see high-res visible satellite below).  How can one tell?  Those popcorn-looking clouds over the Pacific are associated with convection, which in turn is produced by an unstable atmosphere with cold air going over relatively warm water.

As typical in spring, the passage of a front and the veering of winds towards the west along the coast, resulted in the development of a strong Puget Sound convergence zone, with intense precipitation over central and northern Puget Sound (see image).  In contrast, there is bright sun and clear skies to the lee of the mountains of Vancouver Island and the Olympics.  The advantage of the Northwest...you can choose your weather.


Here are shots from the Space Needle Cam at 9:20 AM. Heavy rain to the north and sun to the south.  (North, West, South).  Classic.  Pick your weather.


But the big weather story this week is the development of a huge ridge of high pressure over the eastern Pacific.  Let me show you the upper level (500 hPa) forecasts of the UW WRF modeling system.

First on Tuesday at 5 AM.   Wow.   Mega ridge with troughs on its flank.  This is called an omega block and is very stable.


 Thursday at 4AM, the ridge is still strong and has moved towards the coast.


Friday morning, still there.


 Now, this is one model run...can we trust it?  The way to tell is to look at ensembles of many forecast runs.  One application of ensembles is to look at the ensemble mean, which typically is more skillful than any individual member.  The average height anomaly at 500 hPa (the average difference of the ensemble members from normal)  for Wednesday afternoon shows a huge positive anomaly...much higher than normal, over the eastern Pacific.


Another way is look at spaghetti maps, in which height lines from all the ensemble members are plotted.  Here is such  map for Wednesday at 5 PM. Virtually all the members are going for the ridge.  This prediction looks solid.


The implications of this predicted eastern Pacific ridge is profound, with warm temperatures and sunny skies.   Here is the latest forecasts from weather.com.  Mid to upper 60s for much of the upcoming week.  Enjoy.


March 25, 2016

Avoiding Falling Trees During WIndstorms

During virtually every major windstorm that has hit our region, someone has died from a falling branch or trunk.    The chances of being a victim in any particular windstorm is extraordinarily low, but with millions of people in our region going about their daily lives, someone inevitably gets hit.


For the recent March 13th storm, the death was a man in Seward park.  For the November 17th windstorm, 3 people were killed by falling trees.   Today, the front page of the Seattle Times had a story criticizing the Seattle Park's Department, suggesting that they should have shut down Seward and other parks.


So lets examine this threat and what you can do to protect yourself.  First, whether trees or branches come down is more complicated than just wind.

1.  Early season storms do much more damage for the same wind speed.  Leaves on the trees dramatically increase the drag  and spring/summer growth has been untested by strong winds.   Our August windstorm was a great example of this, producing some of the worst tree damage in our region's history.

2.  Extreme dry conditions over the summer can make the trees more vulnerable.  That probably contributed to the extraordinary damage of the August storm.


3.  Very wet soils reduce the adhesion of roots to the soil and soften the soil, making tree fall more likely.  This was clearly a factor for the March 13th storm, which followed the wettest winter in Seattle history.

4.  Exposure is very important.  Winds are stronger near hill tops and downstream from water.   Wind blows more strongly over water since it is aerodynamically smooth, so being near the Sound or Lake Washington can bring increased devastation.  This certainly contributed to the tree fall in Seward Park, since it sticks out into Lake Washington.


As a general rule of thumb, falling branches can start occurring when winds start gusting above 30 mph and major tree damage occurs above 40 mph.

How to protect yourself!

Not a tree expert?  You can start by following the National Weather Service weather forecast--for the March 13 event they predicted strong winds and mentioned to keep away from tall trees.

But if you are more of a hands-on type of person, why not use the wind tool used by the professionals at Seattle City Light?   A web page they funded, created by my group (particularly Jeff Baars) at the University of Washington is available to all:  Seattle WINDWATCH?

WindWatch accesses the most skillful local weather forecast models and the latest National Weather Service forecasts, telling you whether strong winds are coming.  It plots the current wind speeds.  Check out the website and its substantial capabilities.


Have you ever noticed that Seattle City Light seems to restore power much more quickly than other local utilities?  One reason is that armed with the information form WindWatch they can stage their personnel and supplies better.

So if winds over 30 mph are being forecast and you want to minimize your risks (still very small), you would be wise to keep away from heavily wooded areas.  High on the list is the Burke Gilman trail (where I almost got killed last year!)  Tree-filled parks near the water are also dangerous in strong wind conditions (e.g., Lincoln Park, Carkeek Park, Seward Park).

Not a good idea during a windstorm

The stronger the winds and the earlier in the season and the wetter the ground, the more you should avoid trees.   Schools should keep students in the buildings when strong winds blow, even if the power fails.  Don't send them home.  A famous story is how Seattle high schools released their students during the height of the Inauguration Day Windstorm (January 20, 1993) because the schools had gone dark.    Very bad move.

If it gets windy and you have a big fir to the south of you, sleeping in a second story bedroom might not be wise.  Good time to camp downstairs.


Should Seattle close its parks during big windstorms?  Certainly, most of the commenters on the Seattle Times website were against it, suggesting it was classic nanny-state behavior. And lets be honest, the risk is very, very small, and many Seattle parks (like the Burke Gilman trail, the most dangerous in strong winds) can not be effectively closed off.

Furthermore, the great weather killer around here is not falling trees in parks, but car accidents during icy conditions or heavy rainfall.


So before closing parks, perhaps Seattle should develop a Seattle Environmental Hazard app for smartphones.  It will know exactly where you are from GPS and warn you if there is a threat from strong winds, icy conditions, flooded roadways, and much more.   And in the future, you could get earthquake warnings from the UW's earthquake warning system run by Professor John Vidale, or warning about potential landslide.

Such an app could save some lives. It could be free or could charge a minimal amount to help support Seattle's PRONTO bikeshare system, which is going to need lots of funds for a long time.

___________________
Reminder: don't forget to support KPLU!  They need to raise 7 million dollars by June 30th.  If ALL 400,000 listeners give $20, they can do it!   Contribute or get more info here.


March 23, 2016

More Snow Coming to the Cascades

If you were thinking that now that spring is here, you should put your skis away--don't do it.   The mountain snowpack is still healthy and more is coming on Thursday.

Regarding our current snowpack, here is the current snow depth at Stampede Pass, at 4000 ft in the central Cascades.  Holding in there at around 85 inches, while the snow water equivalent in the snowpack has been rising.  Why?  Because we have had some warmer periods with rain and melt, with the water running into the snowpack and refreezing.  That is how Cascade concrete is made!


But go higher in the Cascades, say at Paradise Ranger Station (5500 ft) and the story is different...the snow depth has continued to rise.  Why?  Because there was less rain and more snow at that elevation.


And now the fun part.  Here is the 72hr snowfall total from this morning's run of the UW WRF model.  Up to several feet in the Washington Cascades!   Southern BC (including Whistler) will get hit hard. Most of the snow will be on Thursday.


We have a very healthy snowpack and the water situation looks very good for this summer.  Here is the latest percent of normal:  most areas are 100% of normal or more.

March 21, 2016

The Golden Rule of Climate Extremes

An extreme weather or seasonal climate event occurs and one question is often asked:  to what degree was human-forced global warming the cause?    In fact, the National Academy of Sciences just released a report on this subject, also known as climate attribution.  In this blog, I will talk about a serious, widely held misconception about extreme events and try to clarify the issue using a new Golden Rule.


Let me start by giving you a little quiz.   Some area of the world has a record multi-day heat wave.  The media and some scientists suggest that anthropogenic (human-caused) climate change contributed.   What percent of the extreme temperature is caused by (1) human-enhanced greenhouse gases (GG) or (2) natural variability (NV)?

a.  100% GG and 0% NV
b.  90% GG and 10% NV
c. 0% GG and 100% NV
d. 10% GG and 90% NV
e.  50% of each

The answer in most cases would probably be (d).   The largest contribution to extreme temperatures is from natural variability, which is not the impression one usually gets from the media.   Rather, the implication of most stories is that human-caused increases in greenhouse gases, such as CO2, are the overwhelming contributors to extreme weather events.    Natural variability causes temperature changes that would have occurred without any human impacts.

The Golden Rule

Considering the substantial confusion in the media about this critical issue, let me provide the GOLDEN RULE OF CLIMATE EXTREMES.   Here it is:

The more extreme a climate or weather record is, the greater the contribution of natural variability.

Or to put it a different way, the larger or more unusual an extreme, the higher proportion of the extreme is due to natural variability.


The Golden Rule of Climate Extremes is very different from the implications of many media stories, which suggest that a highly unusual event is mainly the result of anthropogenic global warming.

It also has a very important implication.  Since the major contributor to extremes is natural, most large climate-related impacts (e.g., heat wave and drought over California last year) would have been occurred with or without human enhancement of greenhouse gases.

Now before I get some folks concerned or upset, let me be clear that I am not some kind of global warming denier.  Global warming due to greenhouse gas increases IS occurring now.   But in virtually all situations its amplitude  today is much smaller than natural variability.   THAT'S the point.

It is easy to demonstrate the GOLDEN RULE OF CLIMATE EXTREMES.

Here is the IPCC  global temperature future projections assuming a large increase of greenhouse gases (A2 scenario).  About a 1C warm up so far globally.


Of course, the warming is not uniform, with the Arctic warming up the most and continents warming more than oceanic regions.  This is illustrated in the projected change between 1980-1999 and 2020-2029 from the IPCC report.   The Arctic is forecast to warm by 2-3C.

Now consider the heat wave of winter 2015.  Here is the difference from normal (1990-1995) for January-May (the temperature anomaly).  Huge warmth in the western U.S., with anomalies reaching 4-5C.    The global warming signal is much less (perhaps 1-1.5C).   So most of the warmth must be from natural variability.    And we even know what natural variability that did the deed:  unusual ridging (high pressure) over the western U.S. and the eastern Pacific.


The record breaking precipitation this last winter over the Pacific Northwest?  Global warming suggests only a very minor increase in winter precipitation, completely dwarfed by the huge wet anomaly this winter.  Natural variability rules, at least for now.

Another way to understand the Golden Rule of Climate Extremes is to look at probability plots of temperatures.  Here is an example from the IPCC Science report.    Temperature probability plots tend to be Gaussian (bell-shaped), with the highest probability near the mean.  The gray line shows the situation before any anthropogenic warming.  The probabilities decrease towards warm and cold extremes, with this distribution caused by natural variability.  
If the mean warms, the whole distribution tends to shift towards warmer temperature (dashed line). The probability of extremes increases, but the reason they are much warmer than the new mean is STILL because of natural variability.   Even if there was no global warming, the extreme temperatures far to the right of the mean would STILL be extreme.

Let me put it a different way.  If there was no natural variability, NO ONE would be talking about heat waves or precipitation extremes.    If temperatures, were always the same and warmed up by a 1-2C,  few would notice.   Our temperatures typically reach around 44F in midwinter.  If they rose to a steady 47F, would you even notice?

A frequent analogy for anthropogenic climate change is that it is like putting the climate system on steroids.  But think about this comparison for a second.   Steroids incrementally improve the performance of world-class athletes.   They are already 90% of the way there and they are looking for a small additional edge (which is huge when you are playing at their level).   You don't give steroids to the average person and expect they will be breaking world records.  Similarly, without natural variability doing most of the work, you don't get extreme weather.


Now some folks might ask:  couldn't global warming cause some kind of climate discontinuities, whereby the modest radiative effect from CO2 causes a jump in temperatures or a radical reorganization of the atmosphere. Such a hypothesis was the basis for the movie, A Day After Tomorrow.


For most of the planet, this does not seem to be the case.  Our best models do NOT suggest it.  In fact, there is substantial research that suggests that variability in the atmosphere could deamplify as the planet warms.

As the Earth warms, the global warming signal will increase progressively and eventually will produce temperature anomalies in some location as large as  those produced by natural variability today.  But these is not the case now and won't be for a long time (end of century).    So remember the GOLDEN RULE OF CLIMATE EXTREMES and hopefully some of the media will keep it in mind.

ADDED MATERIAL!

Several folks have noted that global warming will increase the frequency of extremes.  That is absolutely true.   But nevertheless most of the origin of the extremes will still be from natural variability.    Consider a population of people in which the heights range natural from 60 to 79 inches. So there is a natural variation of heights from 5 feet to 6 ft 5 inches.   Now a new vitamin/protein supplement is discovered that increases the heights of people by 1 inches.   There will now be new record heights (6 ft 6 inches).  A big increase in frequency for such heights.   But most of the variability (now from 61 to 80 inches) will still be natural.  Climate is the same way.

March 19, 2016

New Technology Rain Gauge

I love new weather observing systems and when I heard about a new-technology rain gauge that works with infrared beams, I was more than curious.

As many of you know there are three traditional types of rain gauge, the graduated cylinder rain gauge, the weighing rain gauge, and the tipping bucket rain gauge.  All of these types collect or measure the amount of rainfall in some way.

The graduated cylinder is very simple, with a funnel that leads into a narrow cylinder (usually clear), with markings regarding the amount of precipitation.

A weighing gauge determines the rainfall by weighing the amount of water in a bucket:


And then there is the tipping bucket rain gauge in which water fills cups that can only hold .01 inches of rain.  When filled, they tip, causing a signal to be sent from a small switch.  These gauges need a power source and a device to record the "tips."  Tipping bucket gauges are none for "undercatch" during periods of heavy rain, since rain can missed during the tips.  They also can have issues with bugs and debris.

But recently, I heard about a new type of rain gauge that doesn't collect water at all.    Invented by the Hydreon Corporation, this rain gauge is based on the interactions of infrared beams with water falling on a  lens.


Water on the lens allows infrared radiation to escape, which can be sensed by the electronic. This device is relatively inexpensive (about $60) and is related to rain sensors used in cars with automatic wind shield wipers.   Interested, I talked to Professor Joel Thornton of my department, who co-teaches the instruments class, and he ordered one.  Dr. Thornton gave the unit to some very enthusiastic and capable undergraduates, who got the unit hooked up to a computer and attached a power supply.  They will be analyzing the quality of this device's rainfall estimates during the next quarter.

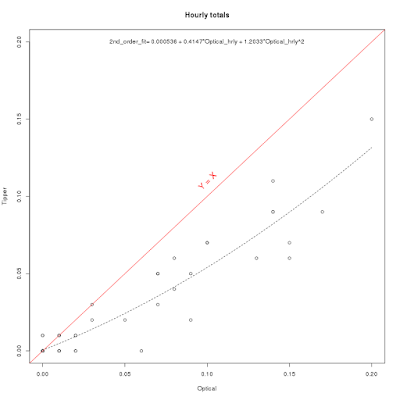
Some of the first results are shown below (courtesy of Neal Johnson of my department).  The x-axis shows hourly precipitation from the new unit and the y axis is the amount from a traditional tipping bucket gauge.  Not terrible, but the new unit seems to overdo the rainfall for heavier amounts (a perfect match would be found along he red line)  We hope to get more of these units and see if we can determine and apply a reasonable calibration to them.
 If they can be calibrated, the optical units would be invaluable, particularly in locations where it is not possible to empty or read rain gauges frequently, and where power is not available (power needs are small and could be supplied by batteries).  The city of Seattle has purchased about a dozen of these gauges, which will be placed around the city.


The Highest Pressure in Ten Years

 Did you feel the pressure yesterday?    Feel a bit weighted down?    If so, it may not be due to the political energy in the air. Yesterday...