First, how much snow is in the mountains right now? Below left is the total snow water equivalent (SWE) of the snow pack we have today, and to the right is what was on the ground last year. There is already significant snow in the north Cascades and the mountains of southern BC. Last year, practically nothing.
Here is a picture today (Oct 28th) from Whistler in BC. Looks promising to me.
So what about the coming winter? The only tool we have that has any real skill (and even that is not perfect), is the correlation between El Nino/La Nina and the snowpack over our region. El Nino years are associated with warm sea surface temperatures over the central/eastern tropical Pacific, and La Nina years, colder than normal
La Nina years, and particularly strong ones, bring healthy mountain snowpacks.
El Nino years, poor ones.
In between or neutral years, average snowpack.
This correlation is useful but imperfect. For example, last winter we started with a strong El Nino and the snowpack turned out to be near normal.
Based on sea surface temperature (SST) measurements over the tropical Pacific, we are now in a weak La Nina situation. The figure below shows the SST anomaly (difference from normal) for the critical Nino 3.4 region (see map beneath). Blue is colder than normal. Neutral years have small SST anomalies (within .5C of normal). Weak La Nina years are colder than normal by .5 to 1 C. We now are in a weak La Nina situation.
According to the official Climate Prediction Center (CPC) and Columbia IRI probabilistic forecast, we will stay in La Nina for several more months (blue color) before we slide into neutral (or La Nada) conditions later in the winter.
And according to a collection of La Nina/El Nino forecasting models, we will stay with a weak/marginal La Nina for the winter.
Strong La Nina conditions tend to bring colder/marginally wetter conditions to the Northwest, with more snow than normal in the mountains. Weak La Nina years like this one typically bring near normal snowpack in the Cascades.
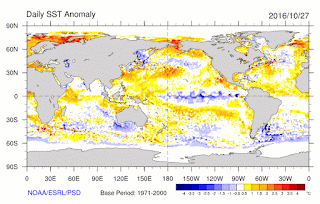
Now there is something else we should consider, the phenomena that brings terror to all skiers: the BLOB, which is the occurrence of warm water over the Northeast Pacific. The BLOB is not good for NW snow. The latest SST analysis shows a weakening of the BLOB with over the central NE Pacific (blue colors).
And the current large scale circulation (big trough over the eastern Pacific) is not good for Mr. BLOB. So we are in better shape BLOB-wise compared to last year.
Bottom line: Our best estimate is for a normal snow year in the Cascades.
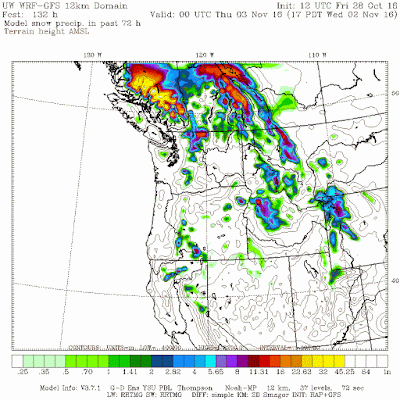
And to get my ski friends excited, here is the 72 hr snow total ending 5 PM Wednesday. Several feet in the Coast Mountain of BC. and a half foot in the north Cascades. The folks at Whistler, must be, well whistling.
_________________________
I 732 and Skiing.
High-resolution climate simulations show emphatically that rising temperatures forced by increasing CO2 levels will decimate Northwest mountain snowpacks. There is substantial confidence in this projection.
So if you care about skiing, or water resources in the Northwest, or our local environment, please vote for I-732, the carbon tax swap.
This has to be one of the most progressive, wise initiatives in the history of WA state. Supported by both Democrats and Republicans, it takes carbon and GIVES ALL THE MONEY BACK to WA State citizens and businesses. Economists consider carbon taxes the most effective way to get CO2 under control and the giving the money back (by reducing the sales tax by 1 % and more) helps repair the crazy, regressive tax system in the State. Solomon could not have done better.
There is a lot of false information being spread about I-732, with some claiming that it is not revenue neutral. This can easily be disproved.
The big carbon polluters are pushing a lot of bad information and lies about the impacts of I-732. Please go to the I-732 web site to learn the truth.
The entire nation is watching us. Please join me, and much of the local climate scientist community, in supporting this extraordinarily positive measure.


Looking at the photo in the prior post, I was struck by how young all of the demonstrators were - my guess is that this was intended as another "but think of the children!" photo - ops. However, upon second thought, I wondered if any of them have paid any income tax for even one day in their lives. Middle class voters are what is needed in order for this measure to pass, not Millenials.
ReplyDeleteAs a millennial, I'm 33 yo, I've paid my share of taxes just like anyone else whose worked. Millennials are not teenagers, they're your middle managers, military mid level leadership, and your young middle class family next door. :)
DeleteIn other news, another all-time record high temp for the date at Sea-Tac Int'l Airport falls on Friday (67°, beating the old record of 66°), and goes by pretty much unnoticed. The new normal...
ReplyDeleteMost of the snow that's fallen lately is above 6,500'. Well above all but the tops of Crystal and Mission.
ReplyDeleteGret, that may be true where you live, but in Portland that population is either out in the suburbs, or doesn't exist. Regardless, the bulk of the population that actually votes are the earlier generations that still make up the bulk of the middle class in this country. This is a simple matter of arithmetic, your numbers are still sparse compared to the rest of the population.
ReplyDeleteA chart for you, Gret:
ReplyDeletehttp://www.cnbc.com/2015/12/03/why-are-so-many-millennials-unemployed-commentary.html
Latest census data show that 40% of all Millenials are unemployed. Unprecedented numbers, none of those folks are paying taxes. Couple this number with many more who are currently underemployed, and you have a record amount of citizens who have no skin in this game.
Getting back to the main topic of this story....whoops hooooooo!!! Bring on the snow!
ReplyDeleteHey Matt,
ReplyDeleteJeff Master's at WU has an illustrative article regarding max/min records see:
https://www.wunderground.com/blog/JeffMasters/scary-warm-welcome-to-the-halloween-heat-wave-of-2016
I've recorded 10.39 inches of rain on south Vashon for October, 2016. A little more rain is on the way for Sunday and Monday.
Heavy rains have become the new normal where I grew up in farm country along the Minnesota/Iowa border. Heavy rains and milder spring nights have changed the flood pattern. Prior to 1978, major flooding occurred during the Spring melt (March) now it occurs during periods of heavy rains (May - September). Crests from Spring floods are lower today.
When heavy rain flooding occurs they are worse than the old Spring thaw floods. Not only are the rivers cresting higher they are cresting during the growing season. Flooded fields in March are not a problem but flooded fields in June kills crops. Then there is the flip side, drought.
It's concerning because just a 0.3 to 1.0 Celsius (0.5 - 1.8F) warming over the last 40 years has brought about a fundamental change. We should be concerned what 2C warming will do.
Eric,
ReplyDeleteThe statistic is "40 percent of our nation's unemployed are millennials," not vice versa.
And according to Pew Research Center, roughly 31% of adults in the country are millennials. This means they are over-represented among the unemployed, but the unemployment rate is nowhere near 40%.
ReplyDeleteI trust all those skiers who support 732 will do their part by walking or bicycling up to the ski areas. Can't have all those CO2 belching SUVs, can we? >;^}
ReplyDeleteWhen attempting to makes sense of statistics, it is important to remember the wise words of Mark Twain.
ReplyDeleteFrom Wiki:
"Mark Twain popularized the saying in Chapters from My Autobiography, published in the North American Review in 1906. "Figures often beguile me," he wrote, "particularly when I have the arranging of them myself; in which case the remark attributed to Disraeli would often apply with justice and force: 'There are three kinds of lies: lies, damned lies, and statistics.'"[2]"
The "three kinds of lies" part provides a convenient platform to disparage statistics in general as a means of arriving at the truth while ignoring the fact that skill is required when dealing with statistics. Of course by far the most relevant observation is the first bit;
" "Figures often beguile me....."
It's interesting that this part of the quote, something that far better represents the application of statistics by the vast majority of us, is not widely known while nearly anyone can gleefully recite the last bit. Anyone can arrange numbers. Very few can arrange numbers that represent reality.