February 28, 2020

Batten Down the Hatches! A Strong Front is Now Making Landfall

3:15 PM

If you are planning to do anything outside and you are living in the Puget Sound region, better finish up during the next hour.

A very powerful front, only a bit weaker than Sunday's, is NOW bearing down on us.

The visible satellite image at 3:01 PM shows the clouds of the well-defined and


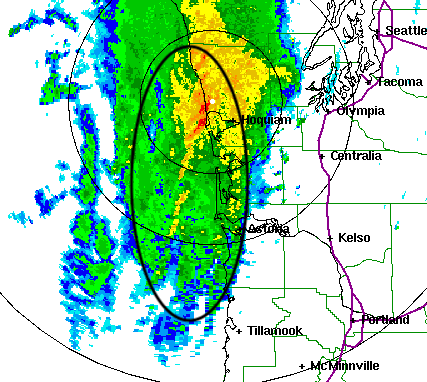
The radar image at 2:48 PM shows the front (I drew at oval to help you see it-, with red colors showing the intense rain on the front. This is called a narrow cold front rain band and there are rapid changes of wind direction, temperature, and pressure across it.


Observations at Buoy 41 observation site, just off the WA coast showed a very sharp pressure trough (zone of low pressure) and a big acceleration of the winds.


The front will move into Puget Sound during the next 1-2 hours, so be ready!

February 27, 2020

Dust Storm Season Begins in Eastern Washington and Oregon

Sometimes during late winter or early spring, the dust storm season begins east of the Cascade crest.

The rain has lessened, the sun has gotten stronger and the upper soil layers have begun to dry out.  Some farmers have begun to plow their fields in preparation for planting.

And then a big wind event occurs, often associated with the passage of an unusually strong weather front, with powerful winds raising dust and soil from the surface, creating a cloud of dust.

All of this happened on Sunday, leading to a significant dust storm on I-82 between Kennewick, Washington and Hermiston, Oregon, with more dust around eastern Washington and southern Oregon.
Blowing dust made travel dangerous along section of I-90 on Sunday.  Check out video here.

The result was a series of car crashes that sent some to the hospital and closed I-82 for several hours (see map for location).


The new GOES-17 weather satellite produces a new "dust product" that highlighted the dust on Sunday (pink colors).


On Monday, a colleague of mine, Professor Robert Houze, traveled I-82 and saw the result of the dust storm, with the roads heavily layered with fresh material (see below).


The winds behind the Sunday cold front was fierce, with some gusts exceeding 50 mph...something illustrated by he winds at noon Sunday (red numbers are the gusts in mph).  Far greater than needed to raise the soil into the air (15-25 mph does it for small grains)


Perhaps the most impressive dust plume came off of Summer Lake in southeastern Oregon (see google map below, with Summer Lake on the western side of the image).


There is vast area of dried lake bed to the east of the current lake, even including some sand dunes.


Winds at 2 PM Sunday were gusting to 62 mph at the southern portion of the lake--plenty strong enough to raise massive amounts of soil and dust.


The result was a very visible dust plume extending to the east (see below, look for the brownish color)


Summer Lake has quite a dusty history, including being the source of the "mystery dust event" in 2015 (details here).

Some dust storms are natural east of the Cascade crest, but the situation has been made far, far worse, by poor agricultural practices, including plowing fields and leaving them exposed to strong winds.   Land disturbances, include heavy use of off-track vehicles, has contributed as well.    No-till farming and restrictions on the use of natural areas could greatly aid in reducing dust storms.

Tragically, the dust storm represents the denuding of a thin veneer of rich, invaluable soils. An irreplaceable loss that will undermine eastern Washington agriculture if allowed to continue.

February 25, 2020

Why Should the U.S. Be the Leader in Numerical Weather Prediction?

During the past several years, I have written a number of blogs bemoaning the third or fourth place status of U.S. numerical weather prediction, with suggestions on how we could regain leadership.

But I am often asked:  why should we worry that the European Center is way ahead?   Why don't we simply acquire their forecasts and forget about the whole business?


Well, I believe there are powerful, compelling reasons why the U.S. should regain its status as the best in the world in operational numerical weather prediction.   Let me give you a few:

1.   There is no reason to expect that forecasts made by the European Center (ECMWF) and the UKMET office, the current world leaders, are the best that can be achieved.  Properly using its huge resources, U.S. numerical weather prediction can be much better.

I am not saying this as a speculation.  This is an area with which I have great familiarity--and there are a number of ways that we can improve upon the ECMWF and UKMET approaches, including not repeating a few of their mistakes or missed opportunities.  We could produce far superior forecasts.

2.  The U.S. has the largest weather research community in the world-- no nation or groups of nations is even close.  Thus, we have the scientific infrastructure and expertise to be the best.   


The National Center for Atmospheric Research in Boulder

Numerical weather prediction also leans on expertise in computer sciences and access to advanced computer technologies.  The U.S. is far ahead in these areas.

3.   Many Nations And Companies Depend on U.S. Numerical Weather Prediction and Cannot Afford the ECMWF or UKMET Forecast Products.  Same with U.S. universities.

The ECMWF and UKMET office charge big bucks for access to the forecast output.  Like hundreds of thousands of dollars a year for private sectors firms wishing access.  Many nations and companies cannot afford to pay the high fees.  In contrast, U.S. agencies have a policy of making our model forecasts available at no charge--- greatly helping poorer countries, in what can considered a form of foreign aid.  The free access also helps new weather start-ups and companies who can't afford expensive European forecast products.


University research, such as at the University of Washington, depend on the free model grids from the National Weather Service for research and to develop next-generation local prediction systems.  ECWMF grids...at 100,000 a year or more..are beyond our financial reach.  Thus, the quality of U.S. academic research depends on the quality of NOAA/NWS models.

4.  Only U.S. Numerical Weather Prediction Can Service All U.S. Needs

International centers, like the European Center, do global prediction, but they aren't interested in running high-resolution and specialty weather prediction models over the U.S.  Only U.S. weather entities (mainly NOAA/National Weather Service) will do that.  We need to be the best for our own good.

Virtually all weather modeling centers are moving towards or using Unified Modeling Systems, in which the same forecasting model works on all scales. So if you are going to have the best model, it will serve both global and local uses. 

5.   U.S. Numerical Weather Prediction Research and Operation is Spending More Money Than Any Other Nation or Groups of Nation.

I mean spending five to ten times as much as the Europe or the UK.  For that price we should be the best.  Unfortunately, we are currently wasting huge amounts of resource with large number of redundant efforts.  That needs to change.  The U.S. taxpayer is already paying to be the best, they might as well get their money's worth.


6.  Global Weather and Climate Prediction are Converging

Global weather prediction and climate prediction are converging towards virtually identical modeling systems: coupled global atmosphere/ocean/crysphere (ice/snow)/land surface models.  Furthermore, weather and climate systems are moving together to higher resolution.  Such modeling systems are obviously most easily tested for weather and seasonal forecasts.   So if the U.S. gives up leadership in the weather domain, it will inevitably do the same in the climate domain.  Not good.

7.  Operational Weather Prediction is a Key Testbed for Evaluating Physical Understanding of the Atmosphere.

The best way to test physical understanding of the atmosphere is to "stress test" the science by including it in operational models that are run several times each day.  Thus, operational modeling can greatly foster science discovery and understanding.  If the U.S. gives up global modeling to the ECMWF or others, we would inevitably weaken the scientific infrastructure of the nation. 

The Bottom Line:  The U.S. can and should be the leader in numerical weather prediction.  Giving up such leadership inevitably leads to poorer forecasting for the nation,  the undermining of the U.S. scientific infrastructure, and would be damaging to the private sector and lower-income nations dependent on U.S. forecast models.


February 23, 2020

Strong Winds and Heavy Mountain Snows Today

A lot of weather action today.  A strong front has just moved through Puget Sound and is now pummeling the mountains and Portland (see image below for 8:11 AM).   Behind the front is cold, unstable air that is producing convection (including some thunderstorms).  This unstable air will be moving in this afternoon---so expect showers and sunbreaks over western Washington today.


The front was vigorous enough that is brought fairly strong winds, gusting to 40-50 mph in exposed locations, and was even stronger in the eastern Strait of Juan de Fuca (see below).


Why was the front (a cold front) so strong, with powerful winds (some gusting to 60 mph, heavy precipitation, hail, and even thunder?   Because it was associated with a narrow, intense cold frontal rainband-- an intense squall line, with strong thunderstorms and very large changes in temperature. 

This was made clear by the wonderful Langley Hill radar which showed the line offshore over an hour before it hit and which documented the structure immediately before hitting the south Sound (see radar image below).   You see the red line just east of Hoquiam?  THAT is the squall line.


The winds with the front have produced substantial numbers of power outages, particularly over the south sound-- including 25000 household serviced by Puget Sound Energy (see below) and 466 customers served by Seattle City Light (mainly south of the ship canal.


But the even more strong winds are yet to come.   The front is connected to a low pressure center that is now approaching northern Vancouver Island (see larger scale infrared satellite image below).


As shown by the latest UW WRF model forecasts, that low center will move westward, and as it does so, a large north-south pressure difference will develop over western Washington--which should cause a substantial acceleration of winds.  Expect gusts of 30-40 mph over much of western Washington.

Sea level pressure map at 7 AM.

Sea Level Pressure Map at 4 PM

The latest forecast of the National Weather Service HRRR (High Resolution Rapid Refresh) model for 3 PM today shows strong gusts (to 50-60 mph) along the coat and into the Strait of Juan de Fuca.   Not a good day for a ferry ride to the San Juan Islands.  And 40-50 mph gusts over southern Puget Sound
But as in late night commercials...there is more!    The cold, unstable air, driven by strong flow to the west, will be forced to rise by the Cascades and Olympics producing bountiful snow above 3000 ft---as much as 1-2 feet in places (see map of 24-h snowfall ending 4 AM Monday)


The Cascade snow could use a bit of freshening.

And then on Monday we will have clearing skies and some sun, with dry conditions in the lowlands through Friday.

February 22, 2020

Stunning Lenticular Clouds Downstream of Mount Rainier

Native Americans, who were astute observers of the natural environment, had a saying:  "when Tahoma (Mount Rainier) has a hat, rain will soon follow."

Today it developed a hat of great beauty.

Looking out the window of my colleague, Qiang Fu, this afternoon, I saw it.  A series of stacked lenticular (lens-shaped) clouds downstream (west) of Mount Rainier (see below).  Stunning.


A bit closer view by Nicole Geer (below) shows the structure a bit better.


But why not go far closer....say from the nearby peak of Crystal Mountain, the home of a wonderful 360° high resolution live cam?

The view around 4 PM was extraordinary, with the "stacked plates" of several lenticular/mountain wave clouds clearly evident.


Pull back and you can get some perspective.  Stunning


And as the sun set and dusk settled in, the lenticular clouds remained, even as the general sky cleared a bit.  

As discussed before in this blog, lenticular clouds form as air is forced to rise by a mountain barrier, and then, like a swing, oscillates back and forth in the vertical (see figure below from my weather book).  As the air rises, it cools, and if moist enough, a lens-shaped cloud forms--with the potential to get several stacked clouds depending on the moisture structure in the vertical.  The clouds evaporate as the oscillating air sinks.

Having air close to saturation is good for the development of lenticular clouds, as is increasing wind approaching the mountain.  Both occur as weather systems approach the area--thus, there is good physical reasons for the Native American observation about a "hat" forming on the big mountain before rain falls.  In fact, the 1:30 PM infrared satellite image Friday (see below) DOES shows a weather system offshore--one that is heading towards our region.

Bottom line:  If you don't have a weather satellite handy, you can learn a great deal about future weather by being a perceptive observer.


February 20, 2020

Why is Meteorological Spring Earlier on the West Coast Than For Much of the Nation?

Spring starts on March 20 or 21st, everyone knows that!

But that is the beginning of astronomical spring, also known as the vernal equinox--the day when the sun crosses the equator and when daylight lasts roughly twelve hours everywhere on the planet.


But astronomical spring is not the same as meteorological spring, and I would suggest that meteorological spring arrives quite early in the Northwest, generally during the third week of February.   Well before astronomical spring begins.  Furthermore, meteorological spring comes much later in the central and eastern portions of the country, where cold and snow can last well into March.

But why is this so?

Before I get into that, let me describe my definition of meteorological spring.   I would suggest that meteorological spring occurs when:

1.  The chances of a major cold wave declines profoundly.
2.  The frequency of major winter storms (midlatitude cyclones) plummets and the chance of a big storm is very low.
3.  The chance of getting a major atmospheric river and heavy rain declines precipitously.
4.  When the amount of sun increases substantially and cloudiness is often broken by sunnier periods.
5.  Leaves start growing on some trees and bushes, the number of birds increases noticeably, forsythia and crocuses begin to flower, and some insects become evident.


There is a lot of objective evidence that our spring generally starts well before March 20/21.  For example, the big snows in Seattle are in January, with amounts declining greatly in February and are very infrequent after the first week of March.


Or looking at the record low temperatures at the Seattle forecast office (blue colors), the major cold waves are in December, with some good chills extending two thirds in February, where they peter out.  After February 26th, there are no major cold excursions (lows below the upper 20s).

Multi-days of thick continuous clouds become infrequent in late February, with a major surge in solar warmth, something illustrated by the solar radiation reaching Seattle during the previous two years (see below).


So why does spring start relatively early here in western Washington/Oregon, particularly compared to the northeastern U.S.? 

Thank our mountains and the Pacific Ocean.

By the time we get into February, the sun is getting much stronger and the day is longer.  Our air is generally coming off the Pacific Ocean, which is relatively mild (45-50F) all year round.  So mild air coming in and protection from the cold air in the interior by two mountain ranges (the Cascades and Rockies), allows the stronger sun to do its job.  In addition, the jet stream begins to weaken and move northward, resulting in weaker and less frequent storms.

But the folks in the central and eastern U.S. are not so lucky!  Residual cold air from Canada can make its way down into the central and eastern U.S. well into March, providing the continued potential for cold waves and snow.  And the interaction of the cold air with warm air from the south can fuel some great coastal storms (Nor'easters) anytime in March.   In fact, some of the greatest eastern U.S. snow storms on record have occurred in March, such as the "Storm of the Century" on March 12,  1993 (see picture below).

Want to see a good recent example of cold-ridden conditions in the eastern U.S., while the West basks in warmth?  You bet you do!

Here is the forecast of heights (like pressure) and temperature around 5000 ft for next Thursday (Feb 27th). Blue is cold.  Wow   A major storm is moving up the coast, with cold, subfreezing air extending over much of the eastern U.S.  Nice spring weather for us though!


Finally, there is another sign of meteorological spring, one that is much more definitive than the weather variables I have discussed above.  Clearly, the wise folks in many supermarkets seem to know that winter weather is over....


February 18, 2020

A Midwinter Subtlety of Puget Sound Weather

On the surface, today was a gloriously boring weather day over western Washington.

Bright blue skies, light winds, agreeable, but cool temperatures.  A day you would think meteorologists would be taking a siesta.

But like a fine wine, Northwest weather is often best appreciated in its subtleties....and today was no different.

With clear skies and weak winds, the ground could radiate efficiently to space, and much of the region had its coldest morning in a month.  As shown by the low temperatures this (Tuesday) morning (below), temperatures ranged from the low to mid-30s near the Sound, to mid-20s in the eastern Seattle suburbs to even the single digits to a few sites  near Mt. Rainier.  Frost was found all over the region, with fog in river valleys and low spots.


This morning on the way downtown for a breakfast lecture of the wonderful CleanTech Alliance, I saw a band of clouds down the center of Lake Washington.    And reaching the 49th floor of 1201 3rd Avenue Building, I saw a line of clouds extending north-south down Puget Sound.

And I knew why is was there.....and like an experienced meteorological sommelier I was able to savior the moment.   Here is the cloud line as seen from the Space Needle PanoCam---not as dramatic a view as I had enjoyed while listening to a lecture about battery technologies, but perhaps you can see it (click on image to enlarge).


The reason for the line is that there were intersecting land breezes from both sides of the Sound.  But let me explain.

Everyone knows about sea breezes--onshore winds that occur when land gets warmer than water.  But when the opposite occurs, when the land is cooler than water, there is a rush of air from land to water called the land breeze. And such land breezes are best seen when the general winds are light...like last night.

This morning there were land breezes on both sides of the Sound...both headed towards the center of the body of water.   This can be illustrated by a plot of the winds around 8 AM near Edmonds.
Circles indicate calm winds and air temperatures are also plotted (the observations over the water were from a Washington State ferry).  The Sound is roughly 45F this time of the year...roughly 10-15F warmer than the adjacent land.  Enough to form a weak land breeze.


As shown in the schematic below, as the land breezes convergence over the center of the Sound, air is forced to rise, forming a band of clouds.  This is what happened to today over Puget Sound and to a lesser extent over Lake Washington.  Take a careful look tomorrow morning...it may well happen again.

The Highest Pressure in Ten Years

 Did you feel the pressure yesterday?    Feel a bit weighted down?    If so, it may not be due to the political energy in the air. Yesterday...