the warmest daily temperature relative to normal conditions ever observed for any date since record keeping began at Seattle-Tacoma Airport (1948). Any date, any season, any year.
Specifically, temperatures on Monday surged to 89F,when the normal maximum temperature for that date was 58F: a 31F anomaly (difference from the normal high). Never had the daily maximum been so far from the average maximum. Just amazing.
The daily records showed this was the largest maximum temperature anomaly on record, with April 1, 1987 coming in at second place (28F anomaly). Here are the top ten daily maximum temperature anomalies provided by Mark Stoelinga, a research meteorologist at Vaisalla, Inc. You will notice the most of the top events are in spring, with April being heavily represented. Why spring?

Average highs are relatively low in April (mid 50s to lower 60sF) and the sun is getting quite strong (the sun's intensity and duration on April 21st is the same as on August 21st). May and early June is also a good period for extreme maximum temperatures compared to normal highs for the same reason.
But even in the best season (spring), to get the truly extreme high temperature anomalies, the atmospheric circulation on both the large and local scales must be just right.
So why was Monday so amazingly anomalous?
We started with a strong upper-level high pressure ridge in the idea location: just inland from the coast. (see upper level (500hPa, roughly 18,000 ft) map at 5 PM Monday) On the western periphery of the ridge there is southwesterly flow which brought very warm air northward.


At low levels there was a modest offshore pressure gradient, so that weak easterly flow was pushing the cool, marine influence away from Sea-Tac Airport. To show this, let's look at the winds and temperatures (red lines) above Sea-Tac Airport that day (below is a time-height cross section, time increasing to the left, time is in UTC). 1821 is 2 PM on Monday, the y axis is pressure (850 is about 5000 ft). Weak easterly flow dominated at low levels. If the flow had been westerly, cool air would have moved over Sea-Tac. Stronger easterly flow over the Cascades would have produced low pressure near the Cascade foothills that would have drawn in marine air near the surface.

To quote Goldilocks: everything was "just right."
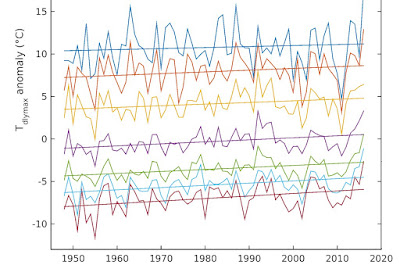
But you want to see this visually? Here is an analysis done by Mark Stoelinga that shows the trend in yearly maximum extreme temperatures anomalies for the spring season (March, April, May)--blue lines. We will talk about the other temperatures in another blog. The biggest anomaly was this year (18C or 31F). And you will note that there is a very slow upward trend during the past 70 years: about 1 C (1.8F). Some of that trend is from human-increased greenhouse gases, some from urbanization, some from sensor changes, and some from natural variability. In any case, the upward trend is small and eclipsed by the natural variability, with its jagged ups and downs.

As I noted in my Golden Rule of Climate Extremes: the greater the climate anomaly, the larger the percentage of that anomaly due to natural variability.


If one looks on the cold side, Seattle has had record departures from average of 36°F on at least a couple occasions back in the cold snap of 1950.
ReplyDelete" The existence of a very strong El Nino, with above normal water temperatures along the West Coast, contributed to the warmth."
ReplyDeleteWait a minute. This quote doesn't make physical sense.
How does that work? While an El Nino winter surely _on average_ has higher temperatures over the Pacific Northwest, that's because warmer air remains over us for longer periods of time during those winters.
Although there is no question that there is a warm anomaly in SSTs off the west coast, those temperatures are still only in the neighbourhood of 13 C.
How is 13 C water having any effect on an airmass that is above 13 C other than _cooling_ it?
Having that 13 C water warm up 20+ C air temperatures is thermodynamically impossible.
That warm water _can_ cause in increase in average temperatures, but only by working on the nighttime lows...keeping those temperatures warmer when the winds are onshore.
But this? Citation needed.
In other words, climate change is best illustrated in the last chart.
ReplyDeleteIn other words, there is no "pause".
In other words, in the next decade and the ones following, the extreme highs will be warmer, the extreme lows will be warmer and the average will be warmer.
In other words, while the totality of factors driving each extreme event is largely natural variability, the same could be said for every day whether it is extreme or boring. Weather geeks love extreme events but ecology geeks - an expertise domain of much greater relevance to the changing climate - know that your last chart says it all.
I thought the most relevant claim to a very hot day is that VARIABILITY is also rising with increased temperature due to global warming, hence the presence of strong anomalies can also be partly attributable to man?
ReplyDeleteDoes a plot of variability vs time not show a rise over the recent decades?
Cliff, are you at all familiar with cognitive psychology and the study of decision making? I think you could go a long ways to explaining the errors in thinking about the climate / weather conundrum by framing the problem that way.
ReplyDeleteIn fact, I suggest that the constant framing as weather being the best representative natural indicator of climate change is a major problem in our decision making. I know you essentially agree, considering your consistent messaging, but there is a wholly other reason, based in cognition not weather, that is the fundamental problem in communication.
When we say "climate" we immediately think "weather". That is the availability heuristic, an automatic and subconscious substitution to explain a problem that is generally too complex and abstract for immediate analysis to provide answers.
In such complex cases, heuristics are both unavoidable and are, somewhat surprisingly, generally the best option for decision making. The problem is that they are generated subconsciously and in general, ineptly. It has nothing to do with intent or intelligence, it is just a well substantiated fact of human cognition.
The solution is to deliberately select a "best" heuristic (rule of thumb) to steer our rationalizations in the right direction. In the case of "climate", we should instead think "ecology", not weather. This of course is terribly difficult (especially for weather geeks!) which is precisely why it must be selected deliberately (willfully).
If we think "ecology" when we try to phathom the significance of climate change, we frame the problem correctly as it is ecological changes that best represent (follow) the changing climate. Then the concept of forecasting, particularly the potential for catastrophic effects, becomes better focused on the most significant ellement - ecological stability.
Of course extreme weather events, if they do become bigger and more frequent, are also a significant threat but of far more significant, in terms of policy decision making, is ecological change. Sorry to break that to all you weather geeks, but that is the truth. The hurricanes, floods etc that get you guys all excited are just plain boring compared to what we are lining up for our kids - the slow moving train wreck of ecological change which could well happen a bit faster than our not so smart cognitive powers can comprehend.
Here is a good explanation of the basic mechanics of this problem, as well as solution:
https://www.youtube.com/watch?v=Mx_5_4Qur5Y
it was glorious.
ReplyDelete@ Dean
ReplyDelete"How is 13 C water having any effect on an airmass that is above 13 C other than _cooling_ it?"
Because normally it's a couple degrees cooling, moderating air temperatures more significantly than it does this year.
@ Bruce Kay
"In other words, there is no "pause"."
That's a chart for a single station. It's not very useful for determining one way or the other, especially since it's in an area that is increasingly developed and subject to the urban heat island effect.
Plenty of still colder air on all sides apart from the south, initial seasonal heat .. pretty much. Right. ?
ReplyDelete@Dean: Because the warmer SSTs mean that air passing over the water from the west (which is nearly all of the air that affects our weather) cools less (or warms more). This means that the air that eventually makes its way east and comes back to us via an easterly downslope event is warmer to begin with than it would be otherwise. With air starting at, say, 53F instead of 50F, an 86F event becomes an 89F event. In extreme terms, a 28F anomaly becomes a 31F anomaly.
ReplyDeleteAtmospheric CO2 Leaps into Uncharted Territory: 408 ppm
ReplyDeletehttps://www.wunderground.com/blog/JeffMasters/atmospheric-co2-leaps-into-uncharted-territory-408-ppm
Yes Dean, true enough it is only one little snapshot. However for that particular station, there is no pause (of significance, averaged as it is over a number of decades) and in general, that isexactly the trend you will find for, on average, station observ tions worldwide.
ReplyDeleteIn other words, there is no "pause".
This is a significant point, if the deniers opinion is ever to be granted the respect that they assume is their entitlement simply by repeating, ad infinitum, a fallacy.
You still seem to be confused as to the difference between average and actual, when talking about possible effects of human-induced warming. Of course, we don't know if any specific event was "caused" by this or that - we don't know because we don't have a causal model for any specific event (unless, for example, you can predict the occurrence of a specific hurricane before it develops, which I suspect you can't). We can only go by probabilities, and the point is "how does human-induced warming affect the probability of an extreme event?". The average contribution to warming is a very poor indicator - you are falling into the trap of that statistician who drowned in a lake that was only 3 feet deep on average. Fact is that, even with a simplistic Gaussian model (which I believe you are using), a shift in the expectation makes extreme events much more likely, as you had to acknowledge yourself a while ago, and promptly forgot.
ReplyDeleteI will be a happy camper if we repeat that early 50s cold snap anytime soon.
ReplyDeleteWe experience extreme cold too. Just ask your midwest and east coast friends. Chicago, on January 6th 2014, was -16 (new record). The average low for that day is 17. 33 degree negative variance. The Chicago winter of 2013 - 2014 was the coldest on record according to the NWS. And if you google "polar vortex climate change", you get 269,000 results, the vast majority linking those extreme cold events to climate change.
ReplyDeleteI agree the average will be warmer. But I see little correlation or current evidence to support that extreme events relate to it except that every time we have one (anywhere, hot or cold) someone – no, make that 269,000 google hits - will say “See. It’s climate change”.
And Rod, I can guarantee you - if we have a 50's cold snap here again - it would not be met with a sigh of relief. It would be met with anxiety and fear. Google some of the articles from Chicago in February of 2014. That's what it would be.
On average, no we don't "experience extreme cold too", certainly not proportionally equivalent to "extreme heat".
ReplyDeleteThere may be some seemonglt anomolous instances of prolonged cold which has been attributed by some to the possiblity that the jetstream has become more prone to "locking in" to a southward meander under a slacking in the latitudinal temperature gradient. Cliff and Jennifer Francis have breifly debated this possibility right here on this blog. I wonder what the latest on that idea is?
On average, the eastern half of north america has become warmer, just as the rest of the world has.
Jeeeeez I just can't fathom why people cannot admit there is substantial global warming induced by human activity. The evidence continues to mount globally and it is continually rebuked.....why??? The activities of over 7 billion humans that do way more than just burp and fart cannot substantially change climate????? Preposterous!!! As Cliff admits, "there is a very slow upward trend during the past 70 years: about 1 C (1.8F). Some of that trend is from human-increased greenhouse gases, some from urbanization, some from sensor changes, and some from natural variability." Natural variability of an upward trend......what would that be? Then there's this:
ReplyDeletehttp://abcnews.go.com/Technology/wireStory/earths-hot-streak-continues-record-11-months-38509331
And another:
http://www.theage.com.au/environment/climate-change/worse-things-in-store-steaming-hot-world-sets-more-temperature-records-20160419-goaf58.html
A global natural variability.....hmmmmmm???? And there's those who cry yippppeeeeeee and jump for joy at temps 30 degrees above average and sizzling summers! I am sure they will never change their tune as we head for a train wreck of irreversible climate, ecosystem, and economic catastrophe!
Thanks again for your in depth analysis into our weather! Your enthusiasm keeps me riveted, and expands my love for meteorology. Portland, Or. looks to likely set the all time record for April as the warmest April ever observed at KPDX. 6 days above 80 D/F this month helped, although many of us experienced frost this morning.
ReplyDeleteCould it be though that climate change doesn't just increase the temperature but influence the weather through more extreme events?
ReplyDeleteThanks Cliff: It is always helpful to have some perspective on the WEATHER extremes we already experience. According to the weather almanac:
ReplyDeleteAmazing temperature rises of 40–50°F in a few minutes occasionally may be brought about by chinook winds. Some outstanding extreme temperature rises in short periods are:
12 hours: 83°F, Granville, ND, Feb. 21, 1918, from–33°F to 50°F from early morning to late afternoon.
15 minutes: 42°F, Fort Assiniboine, MT, Jan. 19, 1892, from–5°F to 37°F.
7 minutes: 34°F, Kipp, MT, Dec. 1, 1896; observer also reported that a total rise of 80°F occurred in a few hours and that 30 in of snow disappeared in one-half day.
2 minutes: 49°F, Spearfish, SD, Jan. 22, 1943, from–4°F at 7:30 A.M ., to 45°F at 7:32 A.M .
Read more: http://www.weatherexplained.com/Vol-1/Record-Setting-Weather.html#ixzz474F2HVyj
Do you have any weather data showing the greatest reported 24-hour temperature swing for Seattle?
First of all, thanks Cliff for putting this out there. Your work always highlights an interesting aspect of weather or climate. This particular case is an interesting insight and has garnered much interest from the public. Engagement is always good.
ReplyDeletePinning an event as influenced by anthropogenic climate change is difficult when the region considered is small and the time scale is small. Simply put, these kinds of statistics require large numbers of observations so short periods and small areas will always be at a disadvantage. Although records were broken throughout western north america during the event, focussing on a single station makes this almost impossible.
Given this, the literature seems to bear out Cliff's assertion that the background warming in maximum temperature that is partially due to anthropogenic influence can't account for the large divergence of this particular record. There is actually a lot more nuance than overprinting trends on top of extremes. But, it seems true that a given extreme daily maximum temperature cannot yet reliably be attributed to climate change in our region nor can we yet say that the statistical distribution of daily maximum temperatures is changing in our region (it certainly is in others) and making extremes more likely. Changes in the statistical distribution of extremes with climate change could make a given record high more likely under a changing climate.
It turns out, in numerous studies, that the extreme daily maximum temperatures are showing the smallest effect of climate change, especially here on the west coast. Studies have detected an anthropogenic influence leading to warmer night time temperatures, warmer extreme annual minima (warming of the coldest winter night) and warming of the coldest annual maximum (coldest wintertime daily maximum). These are slightly different than an extreme warm spring day which wouldn't fall into any of these categories, but indicate that changes in warm Tmax are least attributable to climate change and are in fact the most resistant to climate change. There are larger trends in warming minimum temperatures than those for maximum temperatures.
There are changes in the statistical distribution of extremes toward more frequent and more extreme warmth in numerous locations across the globe, but not significantly in our part of the world. Note that my references are studies from 5-8 years ago, so the additions of warm records since then may allow detection now if the work was repeated. But, the balance of the evidence is that this was the alignment of dynamical stars with an El Nino boost and a sprinkling of climate change.