Many of you come to this blog for state-of-the-art weather predictions based on the latest technology. Others look for insights derived from decades of regional weather research. And I do appreciate your interest in the blog.
But sometimes insights come from sources other than high-resolution numerical models, Doppler radars, and other advanced technology. For example, it is well known that some animals sense upcoming storms or the character of future weather. How many times have you heard about birds finding shelter before a storm, or wild animals getting out of the way of imminent tsunamis? There is great forecasting potential in this innate understanding by nature's denizens.
Many of you are familiar with the most famous animal weather predictor of all, the well-known groundhog Punxsutawney Phil,who reveals the upcoming weather from his underground den in Gobbler's Knob, PA.
Let me be honest--I have my doubts about Phil's ability to predict weather anywhere and particularly the Northwest. Why would a creature that winters underground develop such skill? And could he possibly have any insights into the upcoming storms and temperatures on the other side of the continent? I doubt it and so should you.
Reliable animal-based prediction for us here in the Northwest could only come from a local resident and one that lives and survives exposed to the environment. And considering our issues with moisture, a wet environment at that.
Thus, it was with some excitement that I learned that a local group based in Snohomish have heavily researched the weather prediction ability of local frogs, and have garnered the aid of one frog in particular named "Snohomish Slew". Documented by Native American sources and confirmed by detailed verification of previous frog-based forecasts, these folks in Snohomish have demonstrated near perfect weather prediction skill using amphibian guidance. As documented in the picture below, the chosen frog is a keen observer.
All this research came to a head in Snohomish on Saturday, a day officially known as Ground Frog Day. Attendants of the honored frog oracle learned of his prediction through means they are not willing to reveal, but you can see the proceedings by viewing this video (click on the picture):
Some of you might be concerned that these priests of the great frog meteorologist resemble escapees from some retro Saint Patrick's day Bacchanalia, but I would give their appearance no notice--looks means little in the weather prediction business.
And what was the noble frog's forecast? Mild and breezy. The former condition is in direct contraction to the "modern" predictions based on La Nina statistical correlations with NW weather.
I for one would not bet against the frog in such matters.
This blog discusses current weather, weather prediction, climate issues, and current events
January 31, 2011
January 30, 2011
Dry, Sun, and Modified Arctic Air
Well folks, the threat of snow around here is over for a while. Cool, dry, modified arctic air is pushing over the region, showers are rapidly dissipating, and the sun is breaking out. If the models are even half correct, the next 3-5 days will be generally dry here without any significant weather activity other than a cool down (mainly east of the Cascades) and strong easterly flow in the gaps, such as the Columbia Gorge and the Fraser.
In sharp contrast, the East Coast is going to get hit AGAIN Tuesday by a major snowstorm.
Is there a connection between our opposite weather regimes? You bet there is. As shown in this upper level map for Tuesday, when we have a big ridge, a major trough tends to build downstream (east) of us--bringing stormy weather to the central and eastern U.S. Think of the atmospheric flow aloft as analogous to a rope that you are swinging up and down. There are a series of undulating waves in the rope. The wavelength of the waves (the distance between ridge to ridge or trough to trough) in the atmosphere has a typical scale of thousands of kilometers, for reasons I won't get into now, but which is based on basic physics. So the persistent ridging over us, bringing dry, cool weather this week over the NW, brings the opposite to those poor folks east of the Rockies. Want dry weather with lots of sun...forget Florida...head to Seattle.
Locally, the cold, dry air started pushing through the Fraser Valley into Bellingham and NW Washington yesterday. Here is the latest surface weather plot for NW Washington:You can see the northeasterly flow passing over the San Juans and then moving south and west. Winds have been gusting to 40 mph and more in some locations around Bellingham from this Fraser outflow. It is interesting that the first sign of this continental air from the BC interior is often not temperature, but humidity, or rather dew point. Look at the lower, right red numbers (dewpoint) on these plots and you will see what I mean. And here is the high resolution forecast for 10 AM this morning of the winds..the Fraser outflow is quite clear.
Taking a look at the latest visible satellite image, you will see a residual band of clouds over the middle of the state (with lots of holes) and completely clear skies to the north. This full clearing will move south during the day. With cooler, drier air over us and clearing skies tonight, expect cold overnight temps--20s everyhere and some lower values in valleys and cold spots. Protect your plants!
Even colder air is surging southward into eastern Washington (see plot of current observations)
--and that will help strengthen an east-west pressure difference (higher to the east), which will accelerate the winds in the Cascade passes and the Columbia Gorge. Here is a forecast plot of the pressure pattern today...you can see the packing of the isobars...lines of constant pressure..near the Cascade crest. The colors provide lower-atmosphere temperatures and you can see the colder air (blue colors) east of the Cascade crest.
I wanted to mention that I will be speaking next Saturday (Feb 5) at Port Townsend HS at 3:30 PM about regional implications of global warming...more information is found in the link to the right.
Finally, thanks to all of you that have contributed so far....you have provided funds that are sufficient for two uninterruptable power supplies for our main modeling cluster ($900 each).
January 28, 2011
The Real Deal about La Nina and The Upcoming Weather
There has been a lot of bad information distributed by some media outlets about La Nina and this winter (e.g., "Where is La Nina", "No Show La Nina", "Winter is Over") and some talk about snow on Sunday over the lowlands. I would like to deal with this by going into more depth about what La Nina does to our weather. I will also vent about the media.
Well, I hate to complain, but I was entirely misquoted on the front page of the Seattle Times today. They claim I said:
"Meanwhile, University of Washington meteorologist Cliff Mass says his projections show there’s little chance the Puget Sound area will see another big snowstorm or flooding this season"
This is NOT what I told them and is not what is stated in the interior article.
What I DID say is that it is rare to get MAJOR windstorms and flooding events in our region after the third week of February. That the really big snowstorms and cold waves tended to be before then and that we can get moderate snow events (several inches to say a half-foot) into the first week in March. After the first week in March, it is exceedingly rare to get more than an inch or two over the lowlands.
This is a La Nina year and our chances of getting snow during the next month--in the lowlands or in the mountains--- is ENHANCED compared to normal. But there are no guarantees. La Nina is like weighting the dice ...you increase the odds of a certain throw, but there are other possibilities.
I deal with the media quite a bit and I have to admit some frustration about how often bad information gets in print or on-air. I ask myself, if the information about something I know about is in error quite frequently, can I believe what I don't know about? Reporters have less and less time to do their stories and editors jump for a dramatic, but perhaps inaccurate headline. Even leading newspapers like the NY Times are doing some bad things (like hyping the connection between Siberian snow and east coast cold waves) or reporting...and providing headlines...for unrefereed junk science (like the suggestion that China dust was causing intensified Pacific storms). Just frustrating. We need more science reporters with the time to get the story right.
Current computer runs for the next several days show NO major snowstorms, windstorms, floods are anything else that would send KING TV's Jim Forman rushing out to get his famous parka (which I expect will be in the Smithsonian one day). But we will get colder for a few days, Fraser River outflow will hit Bellingham and NW Washington, winds will accelerate in the Columbia Gorge, and there could be an highly isolated snowshower on Sunday. And we will see a complete dry out starting Sunday that will last a long time.
So lets state some facts. We are in a moderate La Nina year and will be for the remainder of the winter. La Nina years are frequently associated over the NW with above average precipitation for the fall and winter, colder than normal temps after January 1, and greater than normal snowpack and lowland snow after New Years. La Nina years usually have higher than normal pressure and upper level ridging over the eastern Pacific, with enhanced northwesterly flow coming into our region.
None of this is guaranteed...just a higher probability that we will see it during a La Nina year.
Well....have we seen signs of La Nina? You bet we have. Time and time again ridging in the eastern Pacific has developed, as has NW flow over us. I could show you plenty of historical examples this winter, but how about 4 PM this afternoon?
Or 4 PM on Monday?
Here is a plot of the difference in sea level pressure between La Nina years and all years (the anomalies from climatology in weather talk). Note the positive anomalies in the eastern Pacific (red and yellow), and the negative anomalies (blue) just inland
And here is this year from Nov 1- Jan 26th. You can see the La Nina influence--with the positive anomalies (higher pressure than normal) south of the Aleutians. Similar to the typical La Nina year, but with small differences that have lessened the chances for snow (like weak troughing--lower pressure than normal--off our coast).
And has precipitation been above normal this winter so far, as it should for a well-behaved La Nina? Yes, it has. Here is the proof for Sea-Tac over the past 12-weeks (red is observed).
So those claiming that La Nina has been a no show are not quite right. But what about the snow??
First, the winter is NOT over yet and we could still make up the mountain snowpack and get ahead of normal. Would not surprise me in the least. And to get lowland snow around here is REALLY tricky--you need the hard to secure combination of cold and wet. Consider this weekend....we will be close in some respects. Colder air is coming up, particularly late Sunday and into Monday. But the precipitation will be over then. No cigar. Yes, there could be a few snow showers as the last precipitation leaves, but this should not get any mayor gassing up the salt trucks.
January 26, 2011
Tale of Two Half Months and the Banana Belt
The weather during the last two weeks has been warmer than normal over much of the region, in contrast to the cold weather of the first half of the month. Take a look at the temperatures for the past four weeks at Seattle-Tacoma Airport (the normal highs and lows are shown too).
During the first two weeks the high temperatures only reached normal values (around 45F) for a short two-day period. Then the switch was flipped and temperatures surged above normal, with very few days dropping to the normal lows. The weird thing is that average temperature for the whole month will end up near normal! A good example of how you got to be careful with weather statistics.
As shown below, a figure giving the cumulative precipitation of rain at Sea-Tac, precipitation for the month will be near normal, but in reality most of the month was fairly dry and the rain was concentrated in the middle.
Now today there was an interesting hot spot on the southern Oregon coast where the area near and just north of Brookings on the Oregon/CA border surged into the 70s! Specifically, Brookings hit 73F, North Bend reached 70F, and another station (FPRO3 north of Brookings) hit 76F. Here is a plot of temperatures, winds, pressure and other parameters at 2 PM. The surface air temperature is in the number in the upper right next to each circle (click to get a big version).
Now why so warm? This was a modest example of the Brookings Effect and the reason the southern Oregon coast is often called the Banana Belt of Oregon. Every month of the year has seen temperatures in this coastal zone hit the mid-70s and more.
The secret is to have mild air and offshore (easterly) flow.But there is more to this story! There is something unique about the southern Oregon coast, something that is obvious from a terrain map (see the one below):
For most of western Oregon the Willamette Valley provides a break between the coastal mountains and the Cascades, but not the southern portion....high terrain (known as the Siskiyous or Klamath Mountains) extend from the coast well inland.
Now if you get a situation with easterly flow--like we have today, the air descends rapidly to the Oregon coast. When air descends it is compressed since pressure is higher near the surface that aloft. Compressing air causes it to warm (like in your bike tire pump). Thus, the tongue of coastal warming.
So forget Hawaii and head down I5 to the southern Oregon coast. But hurry. The situation is changing soon and rain will return on Friday to much of the area. But the showers will only be temporary--by the end of the weekend our persistent ridge will rebuild and dry, mild conditions will return. La Nina lowland snowstorm? Very unlikely during the next seven days.
I understand there is wager between the well know local writers Knute Berger and Eli Sanders with Joni Balter of the Seattle Times regarding snow this winter (http://crosscut.com/blog/crosscut/20067/What-if-Seattle-s-rain-were-snow-/). Perhaps this game of chance should be open to the rest of us....
January 24, 2011
Ridgmageddon
I just got back from the first day of the annual meeting of the American Meteorological Society downtown at the Convention Center...an exhausting but exhilarating event. Thousands of meteorologists, hundreds of talks, booths and exhibits from a variety of vendors and groups, and free food...life doesn't get much better than that. The theme of the meeting-- "Communicating Weather and Climate" --is dear to my heart and one I shall talk about further in another blog.
But that is not what I want to talk about here; rather let discuss the extraordinary weather pattern we are experiencing.
I took a look at the latest model runs just now and they are truly extraordinary...they suggest we are locked in an pattern with ridging (high pressure) over the eastern Pacific and west coast, with the east coast locked in cold weather with more "nor'easters" pummeling the coast.
Today a front went thought our area and believe it or not, we won't see any precipitation until Friday at the earliest...and that won't last. Temperatures will reaching into the 50s, and yes, there will be some sun.
Now lets get back to the models. If there are right, we will not have any significant weather for 7-10 days (and yes I know the reliability of the models plummet after 4-5 days). Here are some samples, the upper level (500 mb) maps at 30, 54, and 18o h out in time. Remember these are like topographic maps...they tell you the height of a certain pressure surface (500 mb, mb is a unit of pressure). 500 mb is about half typical surface pressure. Where the pressure surface bulges up with have ridge, and where it dips down we have a trough. The flow at this level is roughly parallel to the height lines, with higher heights to the right.
In these maps you can see ridging in the west and troughing in east. The ridging is associated with mild temperatures over us and the troughing with cold temps to the east.
Now this output is from one model, the National Weather Service Global Forecast System model (the GFS). To get some idea of whether we should believe this, I checked the "gold standard" global model, the ECMWF (run by the European Center for Medium Range Forecasting in Reading). Same thing. Then I checked the U.S. global ensemble forecasting system model which runs a large number of model predictions each starting slightly differently. Same story. Like spaghetti? One form of output from our ensemble runs is a spaghetti diagram in which the heights from each of the ensemble forecasts are plotted on the same chart. Here is it for 144 hr (Saturday at 4 PM). Look at the blue lines...each represents a different forecast...and nearly all show a nice ridge. This is strong hint that the atmosphere wants high pressure over the NE Pacific.
Bottom line: The atmosphere seems to be locked in a very anomalous pattern right now and my profession really can't explain it (and I would not take certain NY Times op-ed pieces about Siberian snow being the cause very seriously). Or other NY time pieces suggesting it is global warming. Whatever is going on seems to be overwhelming the normal La Nina pattern around here and over the rest of the western U.S. Our snowpack is below normal and California is wet....a situation normally associated with El Nino years. My profession has years of productive work ahead to figure all this out.
PS: It was very nice speaking to many of you at Weatherfest, which was a big success--perhaps 3-4 thousand people attended. And also thanks to all of you that have provided donations to my department, either for the fund to support our weather modeling, research, and web pages, or the other that helps our students.
January 22, 2011
Where is La Nina?
A question that several of you are asking is "Where is La Nina"?
Where are all the deep snows in the mountains that are often associated with it?
Or the big snows over the lowlands?
Is winter over?
So what is the situation now?
But before I go into that, let me remind all of you about Weatherfest tomorrow (Sunday) from 12-4 PM at the WA State Convention Center. Designed for K-12 folks, but fun for everyone, there will be booths for many weather related groups and agencies, local weather celebrities (like Jeff Renner, and Steve Pool), demonstrations, and lots of freebies. No admission fee.
Back to La Nina. Some facts:
(1) We are clearly in a moderate La Nina and will continue to be in one for the remainder of the winter.
(2) La Ninas are associated with above-normal precipitation and below-normal temperature over the region (the latter generally after Jan 1). They also tend to bring above normal snowpack in the mountains and above normal snow over the lowlands.
But keep in mind this is all probabilistic. The dice are weighted towards these things, but they don't have to happen. There are La Nina years where snowfall has been below normal for example.
(3) During moderate to strong La Nina years there are typically less MAJOR floods and windstorms and the atmospheric flow is highly variable, often with major ridges (high pressure areas) in the eastern Pacific.
So how is the snowpack doing? Here is the % of normal water in the snowpack around the western U.S. Below normal for the WA Cascades, near normal over Oregon, and above normal over the Olympics. Well above normal in the Sierras. Not a typical La Nina pattern.
What about temperature and precipitation over the lowlands this month? Temperature has been highly variable--with swings from much colder than normal to warmer than normal periods. The variability is La Nina like, but the net temperature is not below normal.
Precipitation has been slightly above normal--the result of extended dry periods and short periods of heavy rain (and warm).
However, there have been few periods of heavy precipitation and cold..and thus snow has been lacking.
So is this going to be a snow bust La Nina year? Folks, it is too early to tell. The mountain snowpack tends to increase into March--often reaching its peak in late March or even early April. Here is the current and typical snowpack for the Seattle watershed--the peak is around April 1.
And you can see we are below normal at this point, but the climatological maximum is not until early April.
For the lowlands, we are now past the peak of the big snow events and there is nothing in our immediate future. But the lowlands can get snow events into early March...so we have a little over a month left to give to enjoy the white stuff at low levels (see plot of Seattle historic snow events)
Finally, this week we will have a "dirty ridge" over us initially, one that will allow some precipitation into at least the northern part of the state. Current model runs indicate amplification of the ridge, and complete drying, by mid-week.
No major storms in the offering.
This benign weather report is clearly due to the presence of thousands of meteorologists in town for the annual meeting of the American Meteorological Society. The weather gods know not to cross us.
PS: Please considering contributing to supporting our local efforts and the department.. see links to the upper right and something I added today:
http://uwweather.blogspot.com/2011/01/why-we-need-your-help.html
January 20, 2011
A Great Irony, A Little Rain, And Then Dry
I believe both of these statements are true:
(1) Weather forecasting is now much more skillful than ten years ago.
(2) There has never been as big a gap between what meteorologists know and the information provided to the public.
Kind of ironic, right? Today, with huge amounts of data coming in from weather satellites and new observing systems, massive computer modeling systems that provide high-resolution forecasts, improved analysis and display systems, and other technical advances, weather forecasts has become hugely more skillful. I can easily prove this with a wide variety of verification statistics (here is an example from the NWS).
Technical improvements are giving my profession increasing capability to predict the spatial variation of weather and its timing. The amount of information is daunting, butunfortunately the means of communicating the information has not kept up.
How certain are we of the forecast? How will weather vary locally? What is happening right now and during the next few hours? None of this is being effectively provided to the public. Forecasts are often excessively vague or "broad brushed" as it is known in the field. Clearly failing forecasts are not updated in a timely way.
Want an example? How about today? Here is the forecast provided when you woke up this morning:
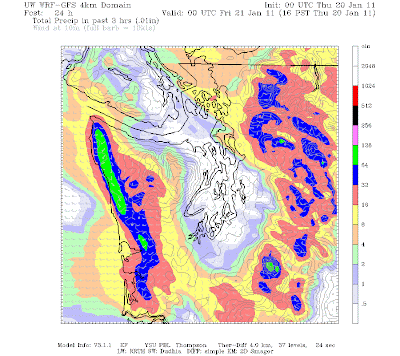
Here are rainfall totals from a computer model run the night before for three 3-h periods (7 AM-10 PM, 10-1 PM, 1 PM-4 PM)
What happened? As seen by the radar (see examples below) there was only some light sprinkles and the rainshadowing was very evident.
With a 6-h forecast cycle the weather predictions are often not updated when the situation changes. However, when something critical is occurring the NWS can and often does release special statements.
Sometimes forecasters are sure about a forecast and sometimes they realize there is a lot of uncertainty. Most of the time this information is not readily available. For the public the only was to get an inkling of the forecaster confidence is in the Forecast Discussion, something that is available on the NWS web site (and on my department weather pages). A portion of the discussion from this morning is:
This issue of communication of forecasts is something I will come back to.
(1) Weather forecasting is now much more skillful than ten years ago.
(2) There has never been as big a gap between what meteorologists know and the information provided to the public.
Kind of ironic, right? Today, with huge amounts of data coming in from weather satellites and new observing systems, massive computer modeling systems that provide high-resolution forecasts, improved analysis and display systems, and other technical advances, weather forecasts has become hugely more skillful. I can easily prove this with a wide variety of verification statistics (here is an example from the NWS).
Technical improvements are giving my profession increasing capability to predict the spatial variation of weather and its timing. The amount of information is daunting, butunfortunately the means of communicating the information has not kept up.
How certain are we of the forecast? How will weather vary locally? What is happening right now and during the next few hours? None of this is being effectively provided to the public. Forecasts are often excessively vague or "broad brushed" as it is known in the field. Clearly failing forecasts are not updated in a timely way.
Want an example? How about today? Here is the forecast provided when you woke up this morning:
EVERETT AND VICINITY-SEATTLE/BREMERTON AREA-TACOMA AREA-This is the official National Weather Service zone forecast for the Puget Sound region. Now what would you conclude from this regarding the chances of rainfall vary around the region? Well, there is little information about it. But what did my profession know?
INCLUDING THE CITIES OF...EVERETT...EDMONDS...LYNNWOOD...
MARYSVILLE...ARLINGTON...SEATTLE...BREMERTON...SILVERDALE...
FEDERAL WAY...KENT...TACOMA...LAKEWOOD...PUYALLUP...SUMNER
400 AM PST THU JAN 20 2011
.TODAY...CLOUDY WITH A CHANCE OF RAIN THIS MORNING...THEN RAIN
LIKELY THIS AFTERNOON. HIGHS IN THE LOWER TO MID 40S. SOUTH WIND
10 TO 20 MPH.
Here are rainfall totals from a computer model run the night before for three 3-h periods (7 AM-10 PM, 10-1 PM, 1 PM-4 PM)
What would you conclude from this model guidance? Perhaps a few light showers with Puget Sound generally dry (due to rainshadowing in the lee of the Olympics).
What happened? As seen by the radar (see examples below) there was only some light sprinkles and the rainshadowing was very evident.
There was good information that the rain would be greater over the eastern Sound than the western Sound, but that message was not being delivered.
With a 6-h forecast cycle the weather predictions are often not updated when the situation changes. However, when something critical is occurring the NWS can and often does release special statements.
Sometimes forecasters are sure about a forecast and sometimes they realize there is a lot of uncertainty. Most of the time this information is not readily available. For the public the only was to get an inkling of the forecaster confidence is in the Forecast Discussion, something that is available on the NWS web site (and on my department weather pages). A portion of the discussion from this morning is:
This issue of communication of forecasts is something I will come back to.
Tomorrow we will see some rain over the region, enough to
bring some of the rivers up again, but then
something unexpected will occur: an extended DRY spell
for most (the southern two-thirds) of the state for several days.
Above average temperatures. That should end the threat of
flooding for a while. More on that in my next blog.
Keep in mind we have only one more month of winter left.
Spring starts on March 21st?
Not here west of the Cascades!
By the time you get past Feb 25th the threat of anything
serious is gone--rare to get a major windstorm, snowstorm,
or flood after that date. And by that time the bulbs are
pushing up, the cherry trees are in blossom, and
the garden centers are full of fertilizer and seeds.
January 18, 2011
Huge Intense Storm in the Pacific
Sometimes you have to stand back and be amazed by what goes on in the Pacific. Take a look at the Pacific surface analysis for earlier today:
See the HUGE low pressure system over the eastern Pacific with a central (lowest) pressure of 933 millibars. That is simply amazing. And a 1038 mb high is just to the north, and an incredible pressure difference between them.
This pressure is the equivalent of a category 4 hurricane, as shown in the Saffir-Simpson hurricane scale shown below:
A huge, deep, slow moving storm like this produces very large waves, since waves depend on wind speed, fetch (length of area where winds are influencing the sea surface), and wind duration--all very large in this case.
Here is a prediction of wave height for tomorrow at 10 AM our time based on the National Weather Service WaveWatch3 model:
We are talking about 40 ft waves! Hawaii is going to get hit hard tomorrow--some of the expert surfers on the north side of Oahu are probably licking their chops tonight! In fact, the NWS has put out a high surface warning already for waves reaching 30-40 feet.An interesting aside--because of improvements of weather prediction we have less surface observations in such storms than we used to. When weather predictions were bad commercial and fishing vessels would find themselves in the middle of such behemoths. If they survived they provided some interesting data. Today's vessels generally avoid these storms--not good for weather prediction but that is ok--today we have other assets, many based on satellites.
In contrast we will be having lamb-like weather here with sunny skies, light winds, and temperatures in the 40s tomorrow. With all the rain and warm temperatures the snowpack in the central Cascades is now below normal...not the usual story for La Nina year...and nothing interesting is expected for days.
January 17, 2011
Gusts
Last night I was sitting at my desk enjoying the sound of the winds..and it was quite an audio treat. I would hear the rumble in the distance. It would get closer and closer. Then the house and trees would shake.
As all of you know, the wind is almost never constant, with ebbs and flows. As a result, meteorologists often talk about sustained winds and wind gusts.
Sustained winds are the winds averaged over a period of time, typically two minutes. Gusts are the maximum winds (or actually maximum three-second winds for NWS sensors) during some period (often the same as the sustained winds).
Wind gusts can be a LOT stronger than the sustained winds...a typical value is 30-40% stronger, but on occasions it can be more. Here is an example at the UW for the last 24-h--look at the top row which shows both sustained winds and gusts. Not unusual for the gusts to be 10 knots greater than the sustained winds. Or here are the winds in a hurricane--gusts were nearly twice the sustained winds at times.
A lot of time you can hear the roar of gusts before the strong winds hit, as I noted above. The anticipation is half the fun.
So why are there gusts in the first place?
The key reason is that gusts represent the mixing down of stronger winds from aloft. As many of you know, winds generally increase with height. The surface is relatively rough, with all the houses, trees, hills, etc. that slows the winds down at low levels. Aloft, away from the surface friction and drag. winds are stronger. The atmosphere is also a turbulence place...particularly when winds are strong or the surface is heated by the sun. The turbulence motions (called turbulent eddies in the business) mix the air in the vertical. You have all seen these eddies during the fall when leaves are flying up and down near the surface during windy periods.
Where an eddy brings air down from aloft the winds increase--you have a gust. When the air is moving back up, the winds slow. Last night we had some very strong winds aloft (see the Seattle profiler winds below)...at some points 50 knot sustained winds were only a few hundred meters above the surface. When some of that fast moving air moved down to the surface in an eddy, you had one hell of a gust.
Current numerical weather prediction models only provide sustained winds...they don't do gusts, which are too small a scale to directly simulate. So meteorologists have to add them to the predicted winds.
By the way, you can also see gusts on the water as darkened patches...known as "cats paws" by marine types (see pic).
PS: The weather is going to benign this week. No major events of any kind apparent in the models. Rivers will retreat. Snow level will push downward. And we may see sun on Wednesday.
PSS: Answer to the question below...you can hear the gust before it hits because the speed of sound (around 760 mph) is much faster than the speed of the gust (30-60 mph).
January 15, 2011
Warm, Wet, and Windy
In education it is the three "R"s....Reading, wRiting, and aRithmatic. (ok, they might not have mastered spelling that well)
For the Northwest during flooding, mudslides, and pineapple express periods it is the three W's:
Wet, Windy, and Warm.
SUNDAY UPDATE: I can't help myself....Richard Rogers of Vashon Island sent me this wonderful video demonstrating the tendency of the media (and yes even me) to describe active weather with lots of "W" s. Very funny....here is is:
http://www.youtube.com/user/ChurchOfGreatRain#p/u/4/W7lu3qK897U
Why do they often together?
After the very brief snow early in the week, we have switched into a period of extraordinary warmth and precipitation, with resulting flooding, slope failures, and production of Cascade concrete in the mountains.
Last night the temperatures only fell into the middle 40s and temps today got into the 50s, even under considerable cloudiness. Twenty degrees warmer than earlier this week.
The reason for this consistent moisture and warmth? We have had a strong jet stream passing to our north upon which low pressure centers passed northeastward roughly every 24-h. This pattern moves both warm air and moisture from the southwest...something known as an atmospheric river or in our case a pineapple express. Here is the latest infrared satellite photo:
You can really see the stream of subtropical moisture.
And here is the predicted water vapor distribution at 4 PM. The purples shows the air with the highest water vapor content. Nice current of moist air moving our way.
Lets take a look at the predicted pressure and lower atmosphere temperature pattern at 4 PM (see first picture below) and the wind speeds aloft (near jet stream level) at roughly the same time (second image below). You can see that the jet stream is closely aligned with the moisture plume above (the moisture plume is roughly parallel to the jet stream but displaced a bit to the south). Looking at the sea level pressures, note the next Pacific disturbance, following the jet stream to the NE. See all those lines of constant pressure to the south of the low--that tells us there are strong winds.
As each of these lows have passed north of us the winds increass substantially over the region...like yesterday when winds hit 30-50 mph over western Washington.
This pattern is ideal for heavy rain over our region. Warm air can hold a great deal of water vapor. Strong winds push a lot of water vapor towards us and up our mountains where the vapor condenses into rain. Warmth means high freezing level, which helps flooding (falling snow doesn't run off).
Precipitation has been well above normal the past few months and these recent events are saturating the soils further...here is the precipitation at Sea-Tac for the past 12 weeks--we are a good 9 inches above normal and there has been a major uptick during the past few days. The weather service is warning of flooding on a number of local river systems (see map below) and we are starting to see increasing number of slope failures (e.g., mudslides). Red indicates predicted flooding. Yellow is bankfull.
There is an interesting angle about this regarding global warming. Most of our extreme precipitation events and serious flooding event are associated with atmospheric rivers like the above. Virtually all of these atmospheric rivers are connected with the jet stream (as shown above). Nearly all climate models indicate the jet stream will move north due to man-caused global warming. Does that mean the we will get less atmospheric rivers and LESS extreme precipitation as the jet moves north? That should be true for someone along the coast. This is why the simple arguments often provided by the media (global warming means more extreme precipitation and floods!!) may not be quite true for everyone. And here is an interesting tidbit...the number of extreme flooding events have DECLINED in northern CA and southern Oregon during the past fifty years. Is it already happening? Are we next for a dry out? My profession really has to get a better understanding of all this.
January 13, 2011
Freezing Rain Hits the Northwest
It almost belongs in Ripley's Believe it or Not
Can water be below freezing and still be liquid? Liquid water at 30F or even lower?
The answer is yes and we call this supercooled water.
It turns out that the atmosphere is FULL of supercooled water, most frequently in middle clouds in the atmosphere.
See this cumulocongestus cloud? The upper portions are undoubtedly mainly liquid water even though the temperatures are well below freezing. Sometimes rain is supercooled and when it hits the ground it freezes on contact--this is called freezing rain and we had some this this week in the Gorge and in the passes (and even a few reports over the lowlands)
So how is this possible?
Well you all know that water is made up of water molecules that are weakly bonded together, yet able to move around. Ice occurs when the molecules get locked into a hexagonal crystal structure and weakly vibrate in place. Now if you have clean water in the middle of the atmosphere, not in contact with any particles or surface, the water molecules are in no hurry to get all lined up as a hexagonal crystal when the temperatures cool below freezing. Think of trying to get some jumpy kindergarteners in line--it takes some doing. Only when temperatures get to -40F (-40C) will you be guaranteed that the water turns to ice. The transition to ice can be helped along by freezing nuclei (little particles than might encourage the transition at say -10 to -15C) or by contact with some surface (which encourages this to happen at freezing). Most of the time you experience water in the latter situation so you might conclude water HAS to freeze at 32F. But you would be wrong.
This week we had some freezing rain at the surface in our area and the set-up is similar at most locations. Here is a little figure that shows how it works. You start out with cold, subfreezing air at the surface. Then you have warmer air move in overhead, warm enough that the precipitation aloft turns to rain (snow really high up melts into rain). For us this is usually associated with warm, southwesterly flow associated with approaching Pacific weather system. Then the rain falls into the subfreezing air near the surface and cools to below freezing and yet is still liquid. Magic! You have freezing rain. And serious danger.
Freezing rain is like liquid dynamite...freezing on contact with the surface. Freezing rain not only makes roads treacherous but can take down powerlines or close down airports.
So what about this week? Portland had a "good" freezing rain event as cold air moved westward out of the Gorge, while warmer rain feel into it from aloft. Hours of freezing rain--something known as the "silver thaw." The Gorge is freezing rain central. Here are the observations at Troutdale in the Columbia Gorge for earlier this week. You can see the transition from snow to freezing rain (ZR stands for freezing rain, F for fog).
The Cascade passes get a lot of freezing rain as shallow cold air from E. Washington moves westward into the passes when a warm Pacific system moves in.
And eastern WA also "enjoys" plenty of freezing rain. Cold air gets trapped in the basin centered on Hanford and the Tri Cities and warm rain from an approaching Pacific weather system falls into it.
So we know freezing rain in the NW, but it is relatively rare over the Puget Sound lowlands.
For you video lovers...here is an example of what freezing rain can do:
Subscribe to:
Posts (Atom)
The Highest Pressure in Ten Years
Did you feel the pressure yesterday? Feel a bit weighted down? If so, it may not be due to the political energy in the air. Yesterday...
-
The latest model forecasts are consistent: an unusually powerful storm with extreme low pressure will develop rapidly offshore on Monday a...
-
An extraordinary storm will develop a few hundred miles off our coast on Tuesday, a storm every bit as strong as a Category 1 hurricane. B...