August 31, 2013

A Great Irony: The Pacific Northwest is Unprepared for Intense Rain

It happened again on Thursday.   A line of modest thunderstorms moved across western Washington, an event that would hardly crack a yawn in folks from the central or eastern U.S.  There was lightning!  Thunder!  Short, but intense showers!

And we are amazed, and unprepared.     Our streets flood, water fills basements, sewers overflow.  And this in a region supposedly web-footed and Goretex-ready.   What is going on?

First...the "big" event on Thursday.

 Marine Drive in Everett on Thursday evening

Local media had a field day

Between four and 6 PM that day, a line of moderate-intensity thunderstorms moved northward up Puget Sound.  Here is a sample radar image around 5 PM (reds indicate very heavy precipitation). Impressive for around here.


Based on rain gauges and radar, the heaviest totals from this event reached 1-1.5 inches , with the regions from Edmonds to Everett and Renton to Sammanish being particularly hard hit.  This is supported by the 24-h rainfall totals from CoCoRahs rain gauges (shown here), although keep in mind most of this fell within one hour on Thursday. 


 Seattle Rainwatch, which combines radar and rain gauge data, found a similar pattern.  (see below).  Note how non-uniform convective showers can be.
Many locations got most of their rainfall in 15-30 minutes...a real downpour for around here.

Now, time for irony.   We think we are rain-accustomed folks with moss between our teeth, but the truth is that we are heavy-rain wimps.   We rarely get intense rain, with a half-inch or more in an hour, and generally experience relatively gentle, but long-lived precipitation events.  As a result, our drainage infrastructure and roads have generally not been designed to handle intense short-period rainfalls, rain generally associated with thunderstorms.

To illustrate our lack of intense rain compared to the rest of the nation, here is an official NWS analysis of what should be the biggest 1-h rainfall over a period of ten years. If you can read the tiny numbers, you will see that the eastern portion of the U.S. gets FAR heavier precipitation...with their ten-year values reaching 2-3 inches, while ours is only about .5 inch.


The big reason for the difference is that they get lots of thunderstorms, including plenty of strong ones.   We get few thunderstorms and they generally are not intense.   Why fewer thunderstorms?   The cool Pacific is a major reason.

My general observation is that less than .2 inches and hour things are generally ok.  Hit .5 inch an hour and some urban flooding occurs.   Get to inch an hour and serious flooding and damage occurs.  This happened in some areas (e.g., near Everett) this week.  And it happened on December 14, 2006 before the Chanukah Eve storm.  Nearly an inch fell in a swatch from West Seattle to Kirkland and tragically a woman died from flooding in her basement.    In order to better prepare for such intense precipitation events, the City of Seattle maintains a dense rain gauge network over the city and has supported the development of the Seattle RainWatch application that combines weather radar and rain gauges to describe what is happening in real time, to predict the next hour, and to warn when necessary (see image).


With a heads up on heavy rain locations, the city can better prepare and is able to move personnel where they are most needed.  RainWatch, which is joint UW/Seattle project, will be undergoing a number of important enhancements this year...so stay tuned.

Finally,  considering that some of our region's infrastructure can't handle even current major precipitation events and the potential exist for even heavier events under global warming (but is uncertain),  future infrastructure projects should be built with better drainage in mind.


August 29, 2013

Minimum Temperature Heat Wave Hits the Northwest!

We are now in the midst of a remarkable heat wave here in the Northwest.  Truly historic.   I have to admit that I can not remember a period in which my brow has been more sweat laden.

But it is not the kind of heat wave that will cause a rush to emergency rooms or enhance air conditioning sales.   It is a heat wave in our minimum temperatures.

In fact, this kind of heat wave got a lot of attention earlier this summer after the release of  a paper by the UW State Climate Office on an increase in frequency in minimum heat waves (information here).  My own take on this was that some of this increase was due to issues with nighttime observations at some stations, but clarification about this issue will come from further research here at the UW.

But there is no doubt we are in a major minimum heat wave event right now.  But why?

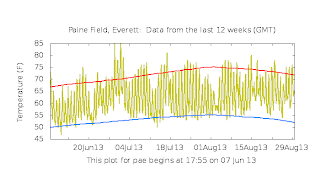
First, some documentation.   Take a look at the temperatures over the past 12 weeks at Seattle, Olympia, and Everett.  The blue lines shows the average low temperatures.   Over the two weeks most days' minima have been well above the average low temperatures--we are talking 5-10F.
 Last night was brutal for humidity intolerant Northwesterners,  with a number of locations only dropping into the mid-60s (see figure).

The complaints and wailings about the high minima have become so loud and persistent that the National Weather Service has put out a special statement on this issue and their findings are sobering.

A number of local stations have broken daily records for record high minima.  More impressively, some locations, such as Seattle-Tacoma Airport and Olympia have observed an ALL TIME RECORD NUMBER OF AUGUST DAYS ABOVE 60F.  We are living in historic times.

So why so warm?   A key has been the unusually high dew points for the region.   Normally, we should be down in the 40s or low 50s, but for several days we have sat in the lower to mid 60s. which is quite unusual for this area.  Take a look at the dew points this morning...many have reached the mid-60s. (remember dew point is an excellent measure of the amount of water vapor in a sample of air, relative humidity is not)


 In fact, a plot of dew point for the past six months, show that we are now "enjoying" the highest values so far this year:
Why so humid?  We have the perfect set up (see map).   Weak winds at low levels, so neither dry offshore flow nor drier air from off the cool ocean (IRONY ALERT:  the air off the ocean has modest dew points because the Pacific is cool!).   Southwesterly flow aloft bringing clouds and rain.  Clouds and low level moisture work against low-level cooling because they absorb and emit infrared radiation effectively.


A perfect dew point storm.  But I suspect there won't be a movie about it.

And one final thing...Thursday is the first day of serious rain over the region.   Fortunately,  Saturday and Sunday will bring great weather...and completely dry.


August 26, 2013

Yosemite Smoke Affects the Northwest and the Rest of the U.S.

The huge and expanding RIM fire near Yosemite Park is now at 161,000 acres and expanding rapidly.  Although there is a lot of talk about the local effects of the fire on Yosemite Park activities and the water/power supplies for San Francisco, this massive fire and its nearby (but smaller) cousins are injecting huge amounts of smoke and gases that are spreading northward to the Pacific Northwest and then heading eastward into Canada and then southward over the eastern U.S.   The impacts are continental in scale.

The fire and smoke plumes are highly buoyant and extend miles high into the troposphere and are even apparent on local weather radars.  This image form Monday evening shows the boundary of the fire and you can see the radar returns over the highly active eastern and southeastern sides of the fire.


A high-resolution NASA MODIS satellite image for Sunday shows the plume of smoke moving northward into eastern Oregon and southeast Washington and then eastward into Idaho and Montana.


This plume just does not contain particles but is full of other combustion products such as carbon monoxide.  Here is model-diagnosed carbon monoxide in a vertical column of air produced by biomass burning (like burning trees)  for Sunday morning calculated using the GEOS-5 air chemistry simulation system (thanks to Professor Lyatt Jaegle for pointing this out to me). The carbon monoxide from the Sierra fires moves northward into the Pacific Northwest and Alberta and then heads east.  Amazingly, the stuff spreads all over eastern Canada and the U.S.,

Here is the same graphics for this morning:  pretty much the same story.

What about the total organic carbon in the air?  Again, the fires have an influence far downwind...in fact, across the entire continent.

Pilots near Reno report the visible smoke is topping out around 12,000 ft., but it surely ascends more to the north and east.   

The reason the smoke/pollution is taking a large loop is due to the upper air pattern:  here is what is looked like this morning at around 18,000 ft.  You can see a high pressure area over the central U.S., with the winds circling clockwise around it (wind are generally parallel to the solid lines).


The weather situation will not change much the next few days over the Yosemite area...not good news for the firefighters there.


August 24, 2013

Summer is NOT over yet!

The return of some clouds and showers to the Northwest has induced some wringing of hands:  is our wonderfully warm and dry summer over?  The answer is decidedly no.

The forecast models suggest that after a cooler, cloudier period this week, warmth and sun will return.

The key feature of the next 5-6 days will be a trough of low pressure that will be parked off our coast, as illustrated by this 500 hPa upper-level chart for Wednesday morning.   Far enough off the coast  to provide some clouds and perhaps a few passing showers...worse on the coast and far warmer in eastern Washington.  You can get thunderstorms, particularly east of the Cascade crest, with this pattern.

But many of the models, including our ensemble prediction systems (ensembles are when one runs many models with slightly different initial states and physics) are indicating return to ridging, warmth, and dry conditions over our region starting next weekend.

But before I show these forecasts, a bit about September climatology.  September has become a fairly good month here in the NW.  Take a look at the average highs at Seattle Tacoma.  If you look closely you will see that there is only a few degree drop between mid-August and mid-September.  The is even more evident in the extreme temperatures..virtually no decline until late September.


Now for the encouraging stuff.  Take a look at the OFFICIAL 8-14 day forecasts by the Climatic Prediction Center (CPC) for precipitation and temperature.  Below normal chances of rain and above-normal temperatures.


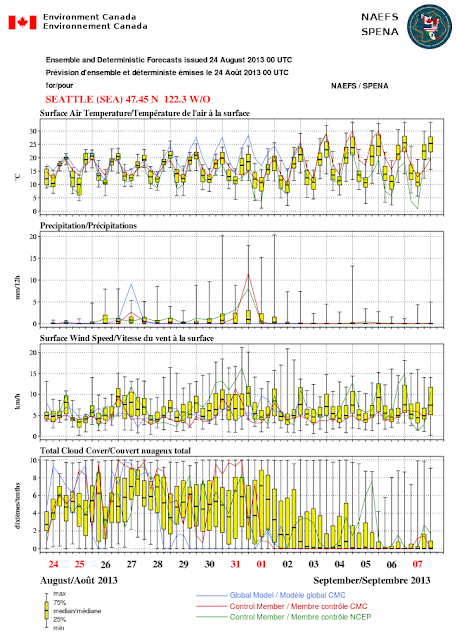
The joint U.S./Canadian North American Ensemble System shows a distinct warming trend starting after September 1 (see figure).  The yellow boxes show you the range of the 50% of the ensembles surrounding the median value of the ensembles.  The "whiskers" show you the extreme range.  Little chance of rain and fewer clouds too!

Too complicated?  Here is the departure of the mean 850 hPa temperature from normal forthe NWS ensemble forecasts for September 4th at 5 PM (this level is at about 5000 ft).  Warmer than norma; (yellow and orange colors).

A few days later...even warmer.

OK..I know this is out pretty far.  But certainly reason to be hopeful that this pleasant summer will continue into early September.

August 22, 2013

Coastal Complaints

There have been a steady stream of complaints by those living or vacationing on the Washington and Oregon coasts.  While the interior of western Oregon and Washington have had what probably has been the finest summer weather in two generations, those coastal folks claim they have had a cloudy, mediocre summer.   Are they whimpering weather wussies?   Or is there some truth to their protestations?  This blog will reveal the truth.

Well, first let's document the warmth and sun of the interior.  Here are temperatures at Seattle-Tacoma Airport for the past 12 weeks, with the average highs and lows noted for reference.  Over half the days have had maximum temperatures above normal, with only a handful below normal.  Only one day got to 90F.  Heaven.
Head east of the mountains, pretty much the same story.  Here is the record at Pasco...most days have gotten above normal, with the exception being those thunderstorm days in late June.
But what about the coast?  Here is the situation at Hoquiam.   There was a long stretch of days below normal in late July and the first half of August, with some recent warming.
Perhaps a better way to see the story is the difference between the average maximum temperature from normal for the last two months.   The coast is cooler than normal (green colors), while the rest of the state is warmer than average.    So perhaps the coastal complainers have been on to something.
What about precipitation over the past two months?   As shown here, the mid-coast was a bit wetter than normal, the mountains were dry, and the eastern slopes of the Cascades and much of eastern Washington were wetter than normal due to the bountiful thunderstorms.
 This HAS been a very unusual summer.   Very little offshore flow, avoidance of 90s, almost no onshore pushes of marine air into the lowlands.   Haven't seen much evidence of the thermal trough of California pushing northward into our region.  WHY?

Much of the summer we have been stuck in the same boring pattern with high pressure offshore.  Like this.  Such patterns push cool, marine into the coastal zone, but are not strong enough to 

maintain low clouds all day in the inland areas, which get some morning clouds that burn off early for pleasant temps.   Lots of days with satellite pictures looking like this--lots of low clouds offshore and on the coast.


We have also had a number of days with weak troughs offshore...enough to keep clouds in there and to promote thunderstorms over eastern Washington.  But not strong enough to spread steady rain over the interior.

The pattern is now about to change, with the development of a stronger, persistent trough off our coast (see map for Friday at 5 PM).   Showers along the coast, thunderstorms east of the Cascade crest, and lots of clouds for the rest of us.  It couldn't last forever....


August 20, 2013

Extreme Temperatures in Oregon: The Seneca Oddity

Seneca, Oregon, located in the high plateau of eastern Oregon, has some amazing temperature extremes.

Consider July 21 of this year.   The low that morning was 30F--below freezing.  The high that day:  96F!  Talking about concrete-cracking extremes!

Seneca has some other honors...like holding the all-time record cold temperature record for any day, anywhere in the Pacific Northwest:  -54F in 1933.  

So what is going on in Seneca?  A major hint comes from terrain maps.

Let's start with a large scale terrain map for those of you unfamiliar with the region.

A local map around Seneca shows something important:  Seneca is in a topographic bowl within the high terrain.   Seneca is quite a bit about sea level: 4700 ft.
You can appreciate the fact that Seneca is in a bowl by looking at a picture at the observing site and on a nearby road:


So why so cold?  You start with a high elevation station in a bowl.   Cold, dense air tends to drain off the terrain and settle into lower elevations in the bowl.   Seneca is in dry eastern Oregon, where there is plenty of clear skies year round.  Clear skies allow radiational cooling to space--which enhances surface cooling.  But during the summer the place can really warms up with all that sun.  Seneca is isolated from the moderating influences of the Pacific by the high Cascade mountains.

Seneca has experienced multi-day periods of temperatures below -40F when an arctic air mass spread over the region, something that happened in 1989.  So why go to Fairbanks for cold fun, when Seneca offers you a similar chill?  There are unofficial reports of temperatures below -54F in the years before the official Seneca temperature site was established (in 1931).   For example, there are claims of -60F during the cold snap of 1927.

The chilly hamlet of Seneca, Oregon

August 18, 2013

Chemtrails versus Contrails: Do Conspiracy Theories Make Sense?

Several times a month I get an email about chemtrails:  the belief by some folks that white lines in the sky are the result of a secret U.S. government program to alter the climate of the planet (also know as geoengineering).  They suggest that the lines are the result of noxious chemicals being deposited by aircraft and that they pose a dire threat to mankind.  This is a classic conspiracy theory, but it does offer an educational opportunity.

Most of you are aware of contrails (short for condensation trails):  clouds that form behind jets flying high in the troposphere or in the lowest stratosphere.   The picture below shows a typical example.
Contrails occur because combustion in jet engines produce a substantial amount of water vapor and when the vapor escapes into the cold upper atmosphere it condenses rapidly into little water droplets that rapidly freeze, thus producing an ice cloud.  Why does the water vapor condense?  Because the upper atmosphere is cold and cold air can "hold" less water vapor than warm air.  Thus, if you inject water vapor into very cold air, it will rapidly condense, particularly if the air is already close to saturation.  This condensation is aided by the small particles produces by combustion that serve as condensation nuclei to aid the process.

Most of you already are pretty expert in producing clouds in cold air:  it happens during very cold days--you can see your breath!  These clouds are generally made of cloud drops.
Human contrail?

Contrails can be produced by both jet aircraft and high-flying propeller driven planes.  Contrails were first observed in the 1920s and was a great concern in WWII, since they allowed the enemy to see high-flying bombers.  Also contrails could make it difficult for such bombers to stay in formation!

Sometimes contrails are hard to see, while other times they fill the sky as shown in the figure below.  Why?    The chemtrail folks think this is due to enhanced military or geoengineering activity.  The truth is that it all depends on how close the atmosphere is to saturation (100% relative humidity).  Sometimes the upper atmosphere is very dry, thus you need to add a lot of moisture from aircraft to

get saturation.   Other times there is sinking motion.  Both are bad for cloud formation.  But in other times, there is rising motion (perhaps due to an approaching weather system) and this brings the atmosphere close to or to saturation.  How can you tell the upper atmosphere is at saturation?  You see lots of thin cirrus clouds (see below).  If the atmosphere is near saturation, then the addition of moisture readily produces clouds (contrails).  If the atmosphere is at saturation, the extra moisture makes thicker clouds.

A sky with a lot of cirrus clouds is a good sign there is upward motion and an upper atmosphere at saturation.

If you have a situation where the atmosphere is at or near saturation and a region with a lot of aircraft flying in the upper troposphere, you can have HUGE numbers of contrails.  Here is an example from the NASA MODIS satellite.  Look carefully and you can see the cirrus clouds as well--just as one might expect.

 In such situations (where the upper atmosphere is moist) the contrails can not only spread across the sky, but they can persist for hours.    The longevity of contrails is a big deal to the chemtrails folks...they think it is proof of the "chemicals" be inserted by the top secret project.

Contrails, as most clouds, have a noticeable effect on the radiation balance of the planet.  On one hand they reflect solar radiation and thus cool.  On the other, they absorb and re-emit infrared radiaton, both upwards and downwards.  This tends to cause warming.  Right now the best estimates are that the warming effect will dominate and thus contrails will heat the planet by a small amount.  This fact shows why the chemtrails idea of U.S. government geoengineering to stop global warming is such nonsense---contrails warm the planet and thus would NOT be something you would enhance to stop global warming.

August 16, 2013

Super Sticky

I have heard a number of complaints the last two days about the unusually humid conditions that have settled in over the region, particularly west of the Cascade crest.  Folks around here are not used to sweating.

 A plot of dew points and winds at 9 PM Thursday tell the story.  Over the western interior and the western side of Cascades, many locations had dew points in the mid-60s.  This is quite high for our area, where dew points generally remain in the mid-40s to mid-50s.   Dew point, the temperature to which air must be cooled to become saturated (100% relative humidity) is a far better measure of moisture in the air than relative humidity, which also depends on temperature.


In fact, a plot of the dew points at Seattle Tacoma Airport reveals that the dew point Thursday night were the highest for the entire summer!  The air has a bit of that "East Coast" feel to it.
The discomfiture we are feeling now is enhanced by the unusually light winds of the past two days, generally less than than 5 miles per hour.  The reason for the light winds is that the East Pacific High, which helps produce refreshing northerly winds and onshore flow has been replaced by a weak low or trough (see graphic: a surface pressure chart for Thursday night).  The differences in pressure (see solid lines or isobars on the chart) are quite small...thus, weak winds.


Why high dew points and thus serious sweating?   You start with light rain, which evaporates into the relatively warm air...this pushes up the dew point.  The fact the surface is now relatively moist helps of course.  Onshore flow, strangely enough, is relatively dry (low dew point) because the Pacific Ocean is cold (around 50F) and cooler air can't hold as much water vapor as warm air.  So the weak onshore winds (produced by the absence of he Pacific High) allows the dew points to rise in the interior.

The moist, wet conditions we have experienced have produced a lot of low clouds, and the combination of the clouds and the high humidity does not allow the surface to cool effectively (water vapor and clouds absorb and reradiate back down the infrared radiation from the surface).   Thus, the minimum temperatures during the last few days have been high.  Check out a plot of the Sea Tac temps:
Wednesday the temperatures only dropped to about 65F!   A few locations had record high daily minima on Friday morning:

RECORD EVENT REPORT
NATIONAL WEATHER SERVICE PORTLAND OREGON
451 AM PDT FRI AUG 16 2013

...RECORD HIGHEST LOW TEMPERATURE SET AT VANCOUVER WA...

 A RECORD HIGHEST LOW TEMPERATURE OF 67 DEGREES WAS SET AT VANCOUVER WA
YESTERDAY...AUGUST 15TH 2013. THIS BREAKS THE OLD RECORD OF 65 SET
IN 1950.

...RECORD HIGHEST LOW TEMPERATURE SET AT SALEM OR...

 A RECORD HIGHEST LOW TEMPERATURE OF 65 DEGREES WAS SET AT SALEM OR
YESTERDAY...AUGUST 15TH 2013. THIS BREAKS THE OLD RECORD OF 64 SET
IN 2008.
Remember the stories about increasing summer heat waves that were in the press last month?   This is going to be another example--but I don't think anyone is going to the hospital from it. 

Anyway, our perfect weather will return this weekend, but today's humidity is a reminder of why we are lucky to be living here, rather the humid summer miasma of the eastern U.S.!

The Highest Pressure in Ten Years

 Did you feel the pressure yesterday?    Feel a bit weighted down?    If so, it may not be due to the political energy in the air. Yesterday...