October 30, 2017

Why the Wine Country Fires Was a Severe Weather Event and Not Climate Change

For an extended analysis, check out my new blog on the topic found here.
______________________________________

Politicians, climate activists, and some media outlets have claimed that there is a strong connection between the recent Wine Country fires north of San Francisco and global warming forced by increasing greenhouse gases.  Some samples (could provide dozens more):
MIT Review

Washington Post
However, if one studies the meteorology of this event, the history of wildfires in the region, changes in the population and land use, and some basic wildfire principles, one is compelled to come to a very different conclusion:

Climate change had little to do with the initiation and severity of the fire.

The truth is that this was a severe weather event, whose terrible impacts (at least 43 dead and tens of billions of dollars of damage) were greatly magnified by poor societal decisions, inadequate planning, poor management of vegetated areas, ineffective use of forecasts, and inappropriate development.

An Extreme Weather Event

The wildfires that hit Santa Rosa and other communities began shortly after a sudden surge of strong winds in the early evening of Sunday, October 8th.  At the Santa Rosa RAWS observing location, winds rapidly increased that evening around 9 PM PDT and reached a peak of 68 mph around 5 AM PDT, after which they dropped rapidly (see graphic).


 A map of the maximum gusts that night at higher elevations (see below) shows 108 mph in the mountains NE of Geyserville at 3450 ft, and 79 mph at the nearby  (and lower) RAWS site (Hawkeye, 2000 ft),  The relatively low (550 ft) Santa Rosa RAWS location had 69 mph, but the Atlas Peak site to the east only reached 34 mph.  This will be important.


A map of the maximum gusts, mainly from lower-elevation sites based on the NWS MADIS collection, is shown below (the graphic created by UW grad studentConor McNicholas).  Note these are in knots (multiple by 1.15 to get mph)  Many of lower elevation sites got to 30 knots (35  mph), with higher winds (40 knots plus at sites in or to the lee of terrain). A few sites got into the 60s.


Now it would have been nice to have more observations (especially at altitude), but the observations we do have suggest moderate gusts of 30-40 mph at lower elevations, but MUCH higher winds near the mountain crests and immediately downwind of the crests (60-110 mph).  The winds distribution was complex and as shown at Santa Rosa (and elsewhere), the winds came up very quickly around 9 PM, only to subside by daybreak.

As I described in my earlier blog, numerical models provided realistic simulations (and forecasts) of this event.  Really quite impressive. As a modeler myself, I have been working with experienced UW WRF modeler Dave Ovens to simulate this event at very high resolution (1.3 km grid spacing).    Let me show you a bit of what we found.  

The next graphic shows you the forecast winds at about 1000 ft above the surface (which should provide a measure of the max gusts) at 11 PM on Oct 8 (the forecast started at 11 AM that morning).  A terrain map is provided for reference.  

You notice there is a lot of structure to the wind with highest values over the higher terrain and the upper lee slopes.  Winds of 60-65 knots above Santa Rosa. 70-75 knot winds were forecast NE of Geyserville, just where the max winds were observed.


 As I noted in my earlier blog, the regional winds from the NE strengthened as cool air and high pressure built to the northeast (eastern Oregon, NE CA).  But something special occurred on top of that: huge wind acceleration over and downstream of the local terrain.    To show this, let me show you a vertical cross section from the WRF model forecast for 9 PM Sunday, just as things were really revving up.  The path of the cross section is shown by the black line below.


Below is the cross section.  You can see the terrain, sustained winds by the colors, and the solid lines are something called potential temperature.

Wow.  The low-level winds were from the east and greatly accelerated at and west of the crests...in some places to over 70 knots (81 mph)!  Keep in mind this was a 10-hr forecast, so strong winds were expected.  Other modeling systems did the same thing (e.g., NOAA HRRR, Desert Research Institute/CANSAC WRF).


Why were the winds increased so much by terrain?   This is what meteorologists call a downslope wind event with a structure that represents what we call a hydraulic acceleration and jump.    This is like water going over a dam and accelerating down the dam's slope.


There was relatively cool, dense air upstream of the terrain and a stable layer/inversion right above.  This kind of atmospheric structure really helps produce such acceleration.   And small changes in the upstream structure can radically change the winds--you have to get it just right to get the big acceleration.

The conditions that night were ideal to get strong winds over and downwind of the terrain east of Santa Rosa and Geyserville.   And it appears highly predictable by state of the art models.  We know this was an unusual situation because several of the observing sites mentioned above had record-breaking winds that night (at least as far back as the records went: 1991)

In summary, this was an extreme weather (wind event).  There is no denying that.

Why Global Warming Can't be to Blame

Here is why.

(1) Strong downslope winds over northern California are not expected to increase due to global warming

There is no reason to expect that the strong winds had anything to do with global warming.  The winds were produced by COLD air moving into the intermountain west, and one would expect that global warming would moderate those temperatures, lessening wind potential.  Furthermore, research by my group and others have shown a deamplification of large scale weather disturbances during the warm season, something that is not surprising considering the weakening of horizontal temperature differences by global warming.

(2)  Warm temperatures and drought

A number of politicians, media folks, environmental activists, and others have thrown out the argument that droughts and unusually warm temperatures HAD to have contributed to the fires.  However, a more careful analysis reveals that this CAN'T be the case in respect to the recent fires.

First, one must ask what was the main vegetation involved in the fires.  It was mainly grass, not bushes and trees.  Picture after picture demonstrates this, and in many burned locations the trees are still alive and green (see below).

Picture courtesy of Jim Steele

Picture courtesy of CA National Guard

There was more grass than normal going into this summer because of excessive rain, NOT DROUGHT, this last winter.  Climate models do not suggest massive increases of rainfall over northern California under global warming.  And observed rainfall over the past decades indicate no such trend.

And the dry conditions this summer is absolutely typical for northern California, where rains are generally absent from May to October.

But what about temperatures?   Could warm temperatures this summer have contributed to the fires by drying out the vegetation more than normal.  The answer is no...and let me tell you why.  It is true that this summer was warmer than normal in California, but average summer conditions are plenty warm to do all the drying needed.

The U.S. Forest Service considers grasses 1-h fuels, meaning the dry/warm conditions can sufficient remove the moisture in hours, allowing them to burn.  And bushes are generally 10-hr fuels.    This was the end of the summer.  There was plenty of time to dry out all the vegetation and a few degrees of warming had no impact--the excessive warmth was immaterial.  A normal summer would have done the drying job fine.

Take a look at the 10-hr fuel moisture for Santa Rosa for the past five years...no real trend.  The moisture goes up in the winter and down in the summer, with no obvious trend on the low side.


Why Blaming Climate Change for the Fires is a Bad Idea

Blaming global warming is a convenient excuse not to deal with the real problems that produced these fires:

  1. Large number of homes and structures have been built in the Santa Rosa/Napa region over the past 50 years, with population going up by roughly five times.  Many were built in bad locations in the forest/urban interface or actually in the forests.   Major housing developments were built in regions that had experienced catastrophic wildfires relatively recently.
  2. Fire has been suppressed in the surrounding vegetated hills, results in the build up of dangerous fuel loads (dry vegetation).  A catastrophe ready to happen.
  1. The electrical system was vulnerable to winds, resulting in the ignition of fires.  Furthermore, there have been several suggestions that PG&E has not properly maintained its powerline right of ways.
  2.  Inadequate use of state-of-the-science weather prediction results in a lack of timely warning of a catastrophic situation.
  3.  Lack of  robust building codes for a fire-endangered region.
Some politicians are using global warming as a tool for making political points and to avoid the expensive and costly changes required to address this threat.

Global warming due to increasing greenhouse gases will cause many changes, many of them bad, by the end of the century.  But blaming unrelated environmental catastrophes on global warming greatly undermines attempts to make the real changes and sacrifices need to prevent such tragedies in the future.


It ain't what you don't know that gets you into trouble. It's what you know for sure that just ain't so.     Mark Twain

October 28, 2017

A Super Inversion is Over Western Washington

This morning, temperatures were in the lower to mid-40s over much of western Washington; but ascend  to 1500 ft and mid to upper 60s are occurring.  Huge increase of temperature with height....a super inversion.

Below the inversion, the air has become saturated, with lots of fog.   The view from the Seattle SpaceNeedle panocam shows a dramatic, and very beautiful, scene:


But the surface view from North Seattle is one of fairly dense fog.


How strong is the inversion?  Let me tell you...and be prepared to be impressed. 

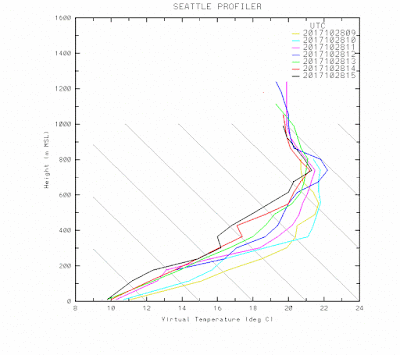
Here are the temperatures above north Seattle from the regional profiler, a sophisticated device that can measure temperature aloft by tracking sound waves (the speed of sound depends on temperature).    Temperatures are in C and range from 10C (50F) to about 22C (72F), 700 meters above the surface.  Most of the change is in the lower 300 meters (about 1000 ft)

The radiosonde-based temperature profile at Quillayute on the Washington coast shows a similar structure (red line below), with about a 17C (30F) increase in temperature within a very thin layer near the surface.  The blue dashed line is dew point...indicating saturation near the surface (with fog)--the temperature and dew point are the same.  But aloft, the temperature and dew point separate, indicating very dry air aloft.  Dry and warm.

 Why such a super inversion?     We start with a big ridge of high pressure overhead (see upper level map for 5 AM this morning).
As a result, there are virtually no clouds aloft, which allows the surface to radiate infrared energy to space, causing surface cooling.  Nights are long now--also good for cooling!

But there is more.  A big high pressure area is associated with sinking air aloft, but less sinking near the surface (air can't pass through the surface).    Sinking causes air to be compressed (pressure increases towards the ground) and compressing air warms it up (think about how warm your bike pump is after use).

So with more sinking aloft than at the surface, the high is preferentially warming aloft compared to the surface---this helps build the inversion.

And if you like subtleties there is more.  At the surface, the highest pressures of the region are east of the Cascades, causing some easterly flow aloft. 

To show this, here are the winds and temperatures above Sea Tac Airport for the past day (time increases to the left, height is in pressure, 850=5000ft).   The wind barbs show easterly flow (from the east), which descends over the western slopes of the Cascades producing MORE compressional warming aloft. 

Good for the inversion.  In fact, look at the temperatures on the chart...there is a big increase from the surface to roughly 930 hPa pressure (about 800 meters above sea level.)

The fog will burn out in a few hours and warmer air should mix down to the surface, giving a fine day in the 60s. 

But if you can't wait to warm up, put on your hiking shoes and head up a local foothill.  You will start with a jacket and end up in a tee shirt...guaranteed.

October 26, 2017

High Pressure Dominates the Region But A Radical Change Ahead

There will be no precipitation for the rest of the month over our region. None.

The reason?   A strong area of high pressure that has built in across the area, and one that will remain in place through the middle of next week.

Let's start with the upper level (500 hPa, about 18,000 ft) map for 5 AM Friday.  HUGE ridge over the U.S. West Coast. The problem with having high pressure over us during fall, is that it promotes low clouds and fog...like we had today.


The ridge will stay strong all day Friday and then weaken a bit on Saturday, as a weak disturbance passes to our north (illustrated by the upper level map at 11 AM Saturday).

The ridges strengthens, but shifts westward on Monday, shunting Pacific storms way to the north.  With the ridge to the NW of us, cooler, but still dry weather will be the rule.  Less fog.


On Tuesday, the ridge is still strong, but closer to us.


The bottom line is that we have a week of dry weather ahead, with initially warmer than normal temperatures (mid-60s Friday and Saturday), dropping into the upper 50s by early next week.  Perfect fall weather.


Have you noticed that the leaf colors have been particularly good this year? What I have read is that warm days and cool nights in late summer and early fall is good for fall color.   Taking a look at the temperatures at Sea-Tac for the past 12 weeks (below), we have had a number of warm days, with typically cool nights.  Plenty of sun, which supposedly is good for color.
 Enjoy the weekend...a beautiful one to get out.   There will be nice weather until Wednesday...but then the bottom drops out.   A strong upper-level trough will approach from the northwest (see map for 8 PM Thursday).  This has a classic structure for bringing cold, wet weather into the Northwest.  If this was a month later, I would be warning about lowland snow.


In fact, the surface chart (pressure in solid lines, colors are temperatures), shows very cold air (blue and purple) just to our north.


So put your umbrella and heavy jackets away for the the next 5-6 days, but get them ready.  By Friday you will need them, with HIGH temperatures only reaching into the mid-40s!


October 24, 2017

Northwest Weather Believe It or Not!

There has been a lot of precipitation during the past two weeks and the impacts may surprise you.

Question 1:  The cumulative precipitation at Seattle Tacoma Airport over the past six months has been:

1.  Way below normal
2.  Normal
3. Way above normal

The answer, shown by the plot of cumulative precipitation, is ALMOST EXACTLY NORMAL.  Our spring was wetter than normal, then almost no precipitation in July and August, followed by roughly five inches since mid-October.
Question 2:  The cumulative precipitation at Yakima, WA for the past six months was:

1.  Way below normal
2.  Normal
3. Way above normal

The answer is ALMOST EXACTLY NORMAL.
Question 3:  The precipitation for the past year at Seattle-Tacoma Airport was

1.  Way below normal
2.  Normal
3. Way above normal
4.  Slightly above normal
5.  Moderately below normal

The answer:  slightly above normal.
The lesson in all this is that one can get drier and wetter than normal periods, but often it all comes out in the wash if one considers a long enough period.

Now you want want to see something that is really amazing?  Here is the upper level (500 hPa) map forecast for Thursday at 11 PM.  A HUGE ridge of high height (or pressure).  Expect temperatures in the mid-60s for Thursday and Friday.


The ridge will still be in place Saturday afternoon at 5 PM.  Get outside..it will be wonderful.  Any good weather this time of the year is a gift from the weather gods.


October 22, 2017

Heavy Rain, Flooding Rivers, and Profound Rain Shadows

As advertised, a moderate atmospheric river event occurred on Saturday bringing heavy rain and limited flooding to our region. 

The water vapor satellite imagery at 5 PM yesterday said it all....a huge plume of moisture stretching back thousands of miles into the central Pacific. (this type of satellite imagery highlights water vapor content in the middle to upper troposphere).

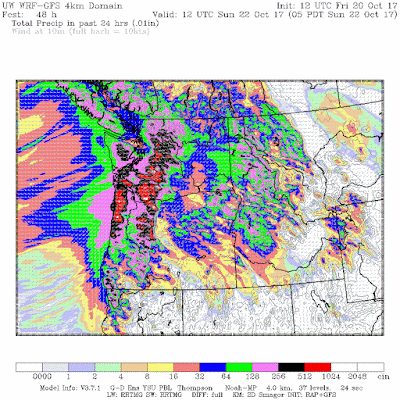
The 24-h precipitation totals ending 7 AM Sunday were impressive (see image, click on it to enlarge), with over four inches on the SW side of the Olympics and the western slopes of the Cascades and 1-2 inches over the south Sound lowlands.   Look closely and you will see only about 1/4 inch fell around Port Townsend on the NE side of the Olympic Peninsula...the rain shadow in action.

 Even heavier rain fell over the coast mountains and Cascades of western Oregon, with several locations receiving over 6 inches in that 24-h period.  Roughly 2 inches in Portland.

If you really want to appreciate the rainshadow, here is the 24-hour precipitation total from Seattle RainWatch, which calibrates radar totals using rain gauges.  .1-.2 inches over southern Whidbey Island, with 4-5 inches southeast of Puget Sound over the western slopes of the Cascades.

Even though the region has been dry this summer, such heavy amounts quickly fill major rivers.  Thus, several of the rivers draining the western Cascades are now or soon will be in flood stage (red and blue dots)

To illustrate, the Snoqualme River, near the town of Snoqualmie, is now at moderate flood stage.  Fortunately, it should decline rapidly today.


A plot of the winds and temperatures above SEA-TAC Airport for the past day, shows the surge of warm, southwesterly flow late Saturday (red is temperature in C, wind barbs are shown, time is in UTC (Z, GMT) on the bottom and the y coordinate is height in pressure (850 hPa is about 5000 ft).  This morning the temperatures cooled and the winds turned more westerly aloft.

As a result of the westerly winds aloft, Seattle and much of Puget Sound is in the rain shadow of the Olympic Mountains today, with lots of sun.  In contrast, the western slopes of the Cascades and Olympics are getting hit with moderate showers (see radar below).


A nice day around Seattle and Portland today, even with some moist, unstable flow reaching our coast.  You get to appreciate the rain shadows around here.


October 20, 2017

5000 Mile Atmospheric River Will Hit the Northwest on Saturday: Heavy Rain in the Offering

The atmosphere is kind of funny when it comes to moisture.    Rather than move water vapor out of the tropics in wide currents, the moisture tend to move in relatively narrow atmospheric rivers.

For us in the Pacific Northwest, the atmospheric rivers that reach our shores often come from the southwest, starting somewhere near Hawaii (see graphic of water vapor content summed up in the vertical).  Thus, they are often called a pineapple express.


But sometimes, a very different configuration occurs, with moisture extending northward in the western Pacific, then heading nearly due east into our region.  Traversing an amazing distance of over 5000 miles.  Let's call this the Midway Express.  And one of them will reach us on Saturday.

Here is the satellite view of water vapor content over the Pacific region for Friday afternoon.  Lots in the tropics (warm air holds more water vapor than cold air), with large values surging northward in the western Pacific.   Do you see a narrow east-west feature in the north Pacific, with what looks like a fist at the end.  THAT is the atmospheric river that is heading our way.

A model forecast for tomorrow morning at 11 AM suggests the "fist" of moisture will reach our shore by lunchtime.

A warm-front, will accompany the atmospheric river, something illustrated by the surface pressures (solid line) and temperatures (colors) at 5 AM Saturday morning.   Behind the warm front, temperatures will rise, moisture values will surge and winds will accelerate.  The warm moist air, forced to rise by our regional terrain, will drop copious moisture.


How much?  Here is the 24h total ending 5 AM Sunday morning.  The heaviest rain will be in the Cascades and coastal mountains from roughly Seattle southward.  Some locations could be hit by 5-10 inches.

A close up view for western Washington suggests a strong rainshadow northeast of the Olympics, with only about a tenth of an inch.  In contrast, the southern Cascades get hammered.


And there will be strong wind speeds, particularly near the San Juan Island and coast Saturday morning.

For those of you worried about the water supply, be comforted.  As shown by the water levels at Seattle's Tolt Reservoir, recent rains have not only stopped the summer drawdown, but has caused a rapid rise during the past few days.

October 18, 2017

The First Significant Storm of the Season

The Seattle Times called it the onset of the "Big Dark", but those who know Northwest weather call it the "Big Normal".   Right on time we are enjoying the stimulating strong winds and heavy rain of a potent Pacific front.  And quite honestly, it feels good.

Winds have gusted to 50-60 mph along the coast and over parts of Northwest Washington, and even here in Puget Sound we have had gusts above 40 mph at exposed locations (and 25-35 mph elsewhere).  The map of the max winds in the 24h ending 7 PM wed is shown below.


Strong winds, untested vegetation with summer growth, and trees with leaves have resulted in thousands of customers losing power around the area.   Here is the Seattle City Light outage map at 7 PM.  Puget Sound Energy has 36,000 customers in the dark.


As I write this blog, a very wet front is moving through the region, as shown by the 7 PM radar.

In fact, we are experiencing a modest atmospheric river that is bringing warm, moist subtropical air into the region (it was near 60F last time I looked).  A satellite image of the vertically integrated water vapor in the atmosphere shows the plume of moisture from the southwest, originating from north of Hawaii.  You can almost smell the pineapples.

The latest infrared satellite image clearly shows the juicy frontal zone clouds associated with the "river."  And potent instability clouds (the popcorn-looking clouds out in the Pacific) are ready to move in tomorrow


A strong front is embedded in the plume of moisture, something a trained eye can tell from the coastal Langley Hill radar image late in the afternoon (see below).  You see the corrugated pattern offshore, with orange/red colors?  That is a strong cold front with a narrow cold frontal rainbands.   These always reflect strong fronts. And that front is now moving across Seattle, with pouring rain and strong winds.  I have to admit, I love it.

Plenty more rain will fall during the next few days.  Here is the total for the 72 hr ending 5 AM on Monday.  5-10 inches over the western slopes of the Olympics and Washington Cascades.  Fire season is over. Our reservoirs will start to fill.  Our rivers will be refilled.  And the "Big Normal" is back..


Big Waves in Hawaii. Why?

 There is a lot of excitement in Hawaii today, as large waves from the northwest reach the north coast of Oahu, making possible the  Eddie A...