This image shows reflectivity, which is related to precipitation intensity--with higher values (pouring rain or hail) shown by red.
A very strong front is seen, with the red lines indicative of a narrow cold frontal rain band, which is found at the actual location of the cold front.
Do you see how the red line is corrugated, with heavier areas and gaps? This is characteristic of the very strongest fronts, and produced by an instability associated with strong shear across the front. Just amazing.
Below is a blow up to give you a closer look. This intense cold front is associated with a temperature change (colder behind), a trough of low pressure, and a very rapid wind shift--from southerly in front to westerly behind.
The frontal characteristic are not uniform along the front, but are much stronger in the red areas, compared to the break locations (known as gaps).
The National Weather Service has some coastal buoys that can show us what the transition was like at the surface. At Buoy 46041, just off the WA coast, the pressure (green line) fell rapidly until 15 GMT today (7AM), and then rose very rapidly. Wind gusts (red lines) increased to 47 knots, before plummeting after frontal passage.
At the same buoy, there was a sharp wind shift from southerly (about 175 degrees) to southwesterly (roughly 240 degrees) with frontal passage (see below). Temperature dropped several degrees with frontal passage (not shown).
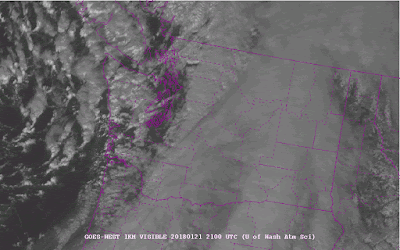
As suggested by the 2 PM visible satellite figure, the front was over the Cascades at that time, with very cold unstable air behind it (strong convective cells are seen over the Pacific as colder air went over warmer water...which makes for big instability).
As a numerical modeler, the first thing I looked at was the simulation that started last night at 4 PM.
Did it get the strong front? It did.
Here is a 16 hour forecasts for the very highest resolution run at the UW (1.33 km grid spacing) for pressure/wind and precipitation/wind, valid at 8 AM Sunday. Sharp wind/pressure transition and even the hint of the corrugated precipitation pattern in the right hand figure. Impressive
All that instability and convection should produce significant snow over the Cascades during the later afternoon and evening.


Very heavy rain in my Seattle neighborhood (Leschi-Madrona) around 4 pm,with a sudden drop in temperature. Road flooding spilled onto sidewalks in places. By sunset the sky was clearing in the west. Narrow band indeed!
ReplyDelete