May 30, 2019

More on the Washington Drought Situation

In my earlier blog, I examined Washington precipitation and suggested that a "drought emergency" is really not a good description of what is going on now in Washington State.  Language and accurate communication of the current situation is important to ensure long-term credibility of both my science and of the political leadership of our state.


As noted above, a large proportion of the state has been declared in drought status, with a recent press release describing a "drought emergency".   The definition of drought is found in Washington law, as noted below.  Note that the definition is not directly connected with the actual snowpack or precipitation, but rather the "water supply" forecast, with drought being called when the water supply is predicted to be below 75% of normal and "likely to create undue hardship."     So there is a substantial subjective element to the definition.


Thus, although below-normal precipitation over the water year  (since October 1) is found over western WA (see below),  there is a huge hole of no drought in the figure above, because the Tacoma, Seattle, and Everett systems have plenty of water in their reservoirs.   Thus, there is no water issues for that huge block of WA State population. 

There have been several stories in local media and talk by some politicians that extreme low snowpack is being observed, with numbers in the single or low-double digits being thrown around.  Much of this talk is  ill-informed.   Let me explain.

The snowpack map from yesterday shows the Olympics only being at 6%.

But there really is very little problem and plenty of water.  Why?  Because, the key issue is that we had a warm spell and the snow is melting out a week or two early, giving nutty numbers during the final days.   

Want proof?  Here are the observations at the Dungeness SNOTEL site, location at 4010 ft in the NE Olympics.  Cumulative precipitation as of this AM (black line) was just slightly below normal (gray line).  The snowpack (blue line) was slightly below normal (red line) for the winter, but melted out a week early.  No big deal.  No emergency.  But is produced extreme low numbers for % of normal for a short period.

Let's take a look at the October through April precipitation for Washington State as a whole since 1930 (red line below).  The mean (cyan) and 75% of the mean (blue line) are also shown.  Yes, our last water year was on the low side, but more than 75% of normal.   There are many other years with similar winter precipitation as our past year (16 years were drier).

What about the coastal zone of Washington, which is in the center of the driest conditions?

Similar story.  This year was drier than normal, but nothing special.  And even the coast was above 75% of normal precipitation.


The bottom line of all this is that this year was drier than normal over the western third of the state, but nothing exceptional.

Modestly drier than normal years happen.  Most reservoirs are in good shape, the snowpack is melting a bit faster than normal, and as I will show below, more precipitation is on the way.   No emergency.

As described in my previous blog, the latest seasonal forecasts are predicting a wetter than normal summer (the Seattle Times had a headline that said the opposite, but it was in error).  But one must note that such forecasts are not reliable nor particularly accurate.   But shorter-term forecasts are much more useful and they show precipitation next week.

The European Center ensemble (many model runs) for the accumulated precipitation at Seattle over the next ten days shows most runs bringing rain back next week.


And the totals through next Saturday for the European Center high-resolution system will be appreciable in the mountains and in BC.  Wetting down BC is good for us, since that will work against early fires there.  Lots of precipitation in Oregon and CA.  Again, this will work against early fires.  

Why the precipitation over our region?  Because the models are emphatic that we will return to a moist, wet upper level flow pattern, with a trough of low pressure off our coast and strong SW flow moving in the Northwest (see below).


In short, we have had a winter with modestly below normal precipitation and an April 1 snowpack of about 75% of normal over the State.  Not unexpected in an El Nino year.  Our reservoir and dam systems are sufficient to provide normal water availability for nearly every user in such a circumstance-- in fact, it would be scandalous if they couldn't.   If we couldn't easily handle such a year, folks would need to question our Governor and State legislators about why they weren't ensuring a robust water system.

And there is no reason to expect a dry summer and  healthy dose of precipitation is in the forecast.

Clearly, the State legislature and Governor should revisit the drought definition being used and perhaps come up with new terminology (e.g., dry condition advisory).  The term "emergency" is a powerful one and should only be used in truly dire situations.


May 27, 2019

The Fraser River Plume

One of the most prominent features in satellite pictures over the Pacific Northwest is not meteorological at all, but associated with a river:  the Fraser River plume.

Each year, snowmelt and precipitation pick on materials in the mountains, which  then flows down the Fraser River Valley towards the Strait of Georgia and the Pacific.  The silt-laden river takes on a milky or even brownish color, which is very evident in satellite pictures (see  MODIS satellite imagery from a few days ago, below).


The plume boundaries can be very sharp, as illustrated by this picture taken by Aaron Donohue from the deck of the Nanaimo Ferry.


The brackish water of the Fraser plume is less dense than the saltier water of the Strait of Georgia and thus floaters on top in a thin upper layer.

The Fraser River, by the way, is the longest river in British Columbia, stretching nearly 900 miles towards the northeast, and draining a huge area (see map).  Much of the region includes lots of unconsolidated debris left over from the last ice age.  Add that to the heavy precipitation of British Columbia, leads to  a potent combination for moving substantial amounts of silt and material into the Fraser and then into our coastal waters.


Importantly, the silt coming out of the the Fraser plume plays a critical ecological role, essentially fertilizing the coastal waters of BC, northwest Washington, and the coastal Pacific.  Specifically, the Fraser outflow provides nutrients (such as silica and iron) that aids growth of plankton, which in turn supports the great productivity and biodiversity in the Strait of Georgia and nearby waters.   The health of the salmon fishery in the region is dependent on Fraser sediment.

Finally, we should not forgot the substantial impact the Fraser River Valley has on our local meteorology during winter, providing a conduit of very cold air into western Washington during cold air outbreaks.   Anyone living from Bellingham northward knows about the Fraser outflow winds.


May 25, 2019

Memorial Day Weekend Forecast: Moist to Dry

This weekend is going to be a mixed bag over the Pacific Northwest, with Saturday being the coolest and wettest, improvement on Sunday in the west, and a glorious day on Memorial Day.

Let's start with today.  An upper level trough/low is moving through now--and headed for California where it promises declining weather during the next few days.  The forecast map for 5 PM today shows the low center sufficiently offshore that the most substantial precipitation will be along the coast.  Puget Sound will see only a few sprinkles today.  And the central and north Cascades will enjoy rain showers (which is good for keeping the wildfire threat down).


The  9 AM radar shows showers over NW WA and the northeast Cascades


Looking at the latest NOAA/NWS HRRR model, the accumulated precipitation through 11 AM is limited to those coastal/NE WA locations.

And through 5 PM, there is a substantial moistening of the Olympics, SW Washington and the northeast slopes of the Cascades.   Exactly where moisture is needed. Relatively dry over Seattle the the western slopes of the Cascades.  But there will be generally cloudy and breezy conditions.

The 24h precipitation ending 5 AM Sunday, reflects the pattern, with the dry conditions along the western slopes of the Cascades due to downslope (easterly) flow associated with the coastal trough.


Sunday will be an improving day in the west, but not in the eastern part of the state.  Moisture will wrap around from the southeast into eastern WA, bringing showers and thundershowers.  The forecast  three-hour precipitation ending 2 PM Sunday illustrates this ((below).   The precipitation extend over the Cascades before dying over the western slopes of the mountains.


Why is everything reversed, with eastern WA and eastern Cascade slopes so wet?  Because there is persistent easterly (from the east) flow on Saturday and Sunday.

The 24-h precipitation ending 5 AM Monday shows impressive amounts over eastern WA and the SE Cascades.   Extremely beneficial precipitation.


But then there is Monday, when major improvement will occur.  High pressure will build into the eastern Pacific,  dry conditions should prevail, the sun should be out, with temperatures zooming into the 70s in western WA and a perfect day for memorial day activities should be enjoyed by all.


May 23, 2019

Does Washington State Really Have a Drought Emergency?

On May 20th, Governor Inslee announced a drought declaration for a large portion of the State.


Media outlets like the Seattle Times had banner front page headlines about the threat.


So you may ask.  Are the conditions we are experiencing really that usual?  It there really a significant threat of hardship over large areas of Washington State?   

This blog will examine the observations and latest model forecasts to help answer these questions. 

The bottom line:  the situation is far less dire or unusual than advertised. There will be plenty of water for nearly all users, and that the forecast is for a wetter than normal summer.

So let's look at the data.  We can start with the departure from normal in inches for the "water year" precipitation, which starts on October 1st.  East of the Cascade crest, the vulnerable areas for agriculture and wildfires, precipitation has been at or above normal.  But conditions were clearly drier than normal over our normally sodden coast.  Of course, the coastal region has limited population and little vulnerable agriculture.  The rest of western WA has been modestly below normal.

Plotting the precipitation over the state for October 1- April 30 since 1930, shows that overall, that precipitation as bit below normal, but no lower than roughly fifteen other winters, with a number being substantially drier.


And the Palmer Drought Index, which considers the impacts of both temperature and precipitation on soil moisture, shows shows normal or better than normal condition east of the Cascade crest, with drier than normal conditions limited to portions of western WA.
 

The latest USDA soil moisture report shows above normal soil moisture for the state

Steamflow are normal for the eastern 2/3 of the state, with below normal values on the lower western slopes of the Cascades.

 Reservoir storage is quite good over the State.  The critically important Yakima River System is just below normal storage.

And all major urban water supply systems are in good shape.  For example, Seattle's reservoirs, located in the middle of the drier than normal zone on the western side of the Cascades, is now above normal in terms of water storage.


There has been a lot of scary talk about low snowpack, but much of it has been HIGHLY deceptive.  The snowpack situation at the end of the winter (April 15) was really not that bad over Washington state and downright good over Oregon (see below). The southern part of Washington was roughly at 100%, while the northern portion was approximately 70-75%.

This situation is not unusual in an El Nino year.  The snowpack in early April gives a good idea of the amount of water available from melting snow, which fills our reservoirs and rivers.  The April snowpack was not bad at all...nothing like the bad years like 2015.   We had a warm period in late April through early May that caused a lot of melt, so the snowpack numbers dropped rapidly in some areas, but much of that that water was not lost.

In some places, the snowpack melted out a week or two early, which gave crazy low numbers for percent of normal snowpack for a few weeks--but that does not really mean much.

Take Blewett Pass.  The snowpack (blue line) was ABOVE NORMAL in early March compared to normal (red line), but warm weather resulted in  rapidly melt, with the loss of snow cover about a week early.

During that melt-0ut period, the observed snowpack was10-30% of normal!  But does that really mean anything?  Not really.  But certain groups and individuals are making a big deal about it.  Total precipitation at Blett since October 1, was modestly below normal.

The bottom line in all this is to show you that although some parts of the state have been a bit drier than normal, there is nothing exceptional going on.  Water supplies to cities should be fine. There is enough water for the fish and agriculture.   There is no emergency and even calling this situation a drought is a big stretch.

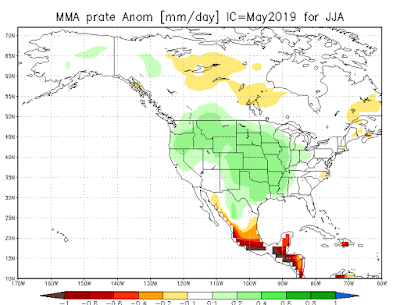
But there is more.  There is all kinds of talk of this being a dry summer.   The Seattle Times said that in the headlines, but it turns out they made a mistake, mis-quoting State Climatologist Nick Bond.   The last ensemble-based seasonal forecast (IMME) for precipitation over the summer (June, July, August) is for a WETTER than normal summer in our region.

And the latest European Center prediction forecasts precipitation over the Memorial Day Weekend (sorry), with the heaviest precipitation over northeast WA, exactly where we need it.

My take on all this, is that our state is going into the summer in relatively good shape water-wise and that there is no reason to expect drier than normal conditions and excessive wildfires.  Summers are typically dry here and there will be fires, but it is important not to exaggerate or hype the situation.

If one cries Wolf too many times, one day folks may not listen.


May 20, 2019

Should California Be Renamed the Evergreen State?

Times change and recent meteorological trends suggest that Washington State should pass on its title of the Evergreen State to the more deserving State of California.   Washington State could become the Golden State, which makes sense with the vast sagelands and wheat fields of eastern Washington and the dry conditions over western Washington.

OK, let's make the case for the switch!  Here is the percent of normal precipitation since January 1st over Washington State. Much of the Cascades, western Washington, and northeast Washington received only 50-70% of normal.  Ouch.

But California, the supposedly Golden State, has been uniformly wet, with large areas enjoying more than 200% of normal precipitation.


Who had more precipitation since January 1st, San Francisco or Seattle?    San Francisco, of course, with 18.31 inches compared to Seattle's lowly 13.71 inches.

Snow in the mountains?  Skiing into the summer?   California peaks have been buried in the white stuff and CHAINS have been required over major mountain passes.  Some CA ski areas plan operations into July!


California's reservoirs are full of water.   Washington State reservoirs are ok, but well below capacity

This situation is not temporary--there is no end in sight.   The latest forecast from the European Center for accumulated precipitation over the next week (below) shows plenty of wet stuff over the Sierra Nevada and northern CA (1.5-4 inches), with some of that precipitation extended into normally arid eastern Oregon.

Washington State?  The arid leftovers, with most of the state getting a few tenths of an inch (with a bit more over the Cascades).

So what is going on here?  Why is Washington State and California exchanging places?  The key issue is the anomalous upper level flow pattern, with the jet stream heading into California, plus an usually persist trough of low pressure somewhere around CA.

A very revealing diagnostic was created by National Weather Service meteorologist Alex Tardy of the San Diego office.  It shows the difference from normal of the height of 500 hPa surface (thinking of it as the difference from normal of pressure at around 18,000 ft).  Unusual ridge of high pressure east of British Columbia, but a band of much lower than normal pressure heading into California.  Striking. 


This pattern pushes a strengthened jet stream southward into California.  And things are NOT going back to normal soon.  The upper level (500hPa) forecast map for 2 AM Tuesday shows the jet stream (where the lines are close together) heading into California, with a low pressure areas moving southward into northern CA to its north.


Fast forward to 8 AM on Sunday.   An area of low heights/pressure moving into California. Clouds and precipitation will extend over the southern part of the State.


The second half of May 2019 will be the wettest in CA history for many locations.

California is going to be green for a while.  And the fire season in California and Oregon is going to be seriously delayed. 


May 18, 2019

Will 5G Undermine Weather Prediction?

There have been a number of media stories this week about a major threat to weather prediction:  the sale of electromagnetic spectrum for new 5G cellphone service.   The problem is that some of the wavelengths being auctioned off for 5G are critical for an important class of weather satellites, with 5G signals potentially undermining our ability to forecast the weather.


Currently, 4G cellphone technologies provide roughly 100 megabits per second (100 million bits per second) of communication speed, while the proposed 5G service could achieve 10 gigabits per second (10 billion bits per second).  Downloading movies and animations would be much quicker, with hardwired connections becoming less critical for most uses. 

But to achieve such service one needs a larger communications highway, which means the use of more of the electromagnetic spectrum.   Electromagnetic energy, such as radio, microwaves, and visible light, are characterized by ranges of wavelength and frequency.  The use of these wavelengths is controlled by our government, which can auction off specific frequency/wavelength bands.


  Among the spectrum recently auctioned off by the FCC for 5G is a band of frequencies near 24 GHz (GHz is gigahertz, or a billion cycles per second).   Unfortunately, this is close to 23.8 GHz, a frequency in which water vapor emits microwave radiation and which is used by weather satellites to determine the three-dimension properties of the atmosphere.  And that information is very important for providing the description of the atmosphere that is required for numerical weather prediction.

Why weather satellite information is important for numerical weather prediction

Numerical weather prediction, the foundation of all weather forecasts, depends on securing a comprehensive, three dimensional description of that atmosphere--known as the initialization.  The better this initialization, the better the forecast. 

One of the key reasons why modern numerical weather prediction has gotten so good is that weather satellites now provide 3D data over the entire planet.  Even over remote oceans and the polar regions.  Roughly 95% of the total volume of weather information now comes from weather satellites.
Before weather satellites, radiosondes were the main source of 
weather information above the surface

And the most important source of weather information is from a collection of satellites that contain microwave sounders.  These satellites observe the earth by sensing microwave radiation being emitted by water vapor, liquid water, ice, and the surface. 

The amount of radiation being emitted can be related to temperature.  And different wavelengths/frequencies reveal the conditions at different levels of the atmosphere.   To put it another way, by sensing emissions at various wavelengths, one can secure a profile of temperatures at various levels in the atmosphere.  Kind of like have radiosondes (balloon-launched weather observations) everywhere.  Very valuable information

The Microwave Sounder Unit on the AMSU-A satellite

What is the most valuable of all satellite observations? 

Satellites with microwave sounders like AMSU-A (see below).  That platform ALONE contributed to a 17% reduction in forecast error in the European Center global model (the world's best)

AMSU A looks at the atmosphere in 15 wavelength/frequency bands or channels,  including sensing the atmosphere at wavelengths that the atmospheric water vapor has peaks in emission (see below). 
Channel 1 is at 23.8 GHz.   The problem is that the FCC has sold off 24 GHz, which is very close to 23.6 GHz.   And if the 5G transmitters aren't very high quality, with little spread to neighboring frequencies, they could well interfere with the microwave weather satellites. 

Why?  Because the weather satellite have very, very sensitive receivers because they are trying to sense the weak microwave emissions of atmospheric water vapor.  These sensors could be overwhelmed by the active TRANSMISSION in nearby wavelengths by thousands of 5G cell tower transmissions or other sources.

And the problem is even worse than that.  The FCC is planning to auction off more wavelengths/frequencies, some of which are close to other wavelength/frequency bands used by the weather satellites.

The potential harm to U.S. and worldwide numerical weather prediction by interfering with the 23.8 GHz band is certainly real, but difficult to quantify exactly. 

First, it will depend on the characteristic of the 5G transmitters and to what degree they will contaminate the nearby weather observation bands.

Second, it depends on how many wavelength bands would be affected.

Third, cell phone coverage does not include the entire planet.  One analysis suggests that only 34% of the earth's surface has cell phone coverage, suggesting that roughly 90% of the planet would be clean of interference (71% of the earth's surface is covered by water).  But if plans to establish satellite-based 5G on commercial ships and aviation come to fruition, the problem would be much worse.

NOAA, NASA, and U.S. Navy are quite concerned about this issue, with the Navy writing a strong statement of the potential harm.  On Thursday, NOAA Administrator Neil Jacobs warned of a potential loss of  1/3rd of current forecast skill.  These warnings need to be taken seriously.

The key now is to have close coordination between the FCC and NOAA/NASA/DOD, as well as other international players, to ensure that spectra close to the weather observing frequencies are not used and, if there are, investments in high-quality transmitters, with effective filters, are required by law.  

Improved forecast skill derived from weather satellites has had huge positive impact on saving lives and property, and in fostering economic growth.  Reasonable actions must be taken to protect the value of weather observations from space.


Another Northwest Bomb Cyclone with Localized Strong Winds

  Don't tell the media folks, but another midlatitude cyclone will be "bombing" off our coast today, with some local impacts. ...