December 31, 2023

Dealing with Aircraft Turbulence

 I have gotten several emails over the past several months asking about aircraft turbulence and how they can avoid or lessen their exposure.

As both a meteorologist and an individual who is not crazy about bumping around in the sky, I have had a lot of interest in the topic.  And I talk about this issue in some depth in the senior weather prediction class.

So let me give you my take in this blog.

Meteorologically there are various origins of the turbulence motions that can make flying unpleasant.

The worst is turbulence associated with thunderstorms and cumulus convection.

Turbulence can also be caused by strong, turbulence motions associated with mountains. This includes mountain-wave turbulence over and downstream of terrain.

Turbulence can be produced by large wind shear when wind speed or direction changes rapidly with height.

Turbulence can be associated with heating at the surface, which produces low-level convective mixing that is most apparent at landing or take-off.

And turbulence can be produced by strong winds interacting with surface features, like hills and buildings.... something called mechanical turbulence. 


Where you sit on the plane makes a difference

Sitting over the wings in the middle of the aircraft near the center of gravity helps.

This makes sense because the center of gravity acts like a fulcrum for several types of motions that occur during turbulence, except for up and down vertical excursions.

Bigger planes experience less turbulent motions, and some planes, such as the Boeing 787 have anti-turbulence control systems that really seem to help.

Where and when you fly makes a difference

Thunderstorms can produce very unpleasant turbulence and they generally increase in intensity during the afternoon hours.

Thus, during the summer when thunderstorms are more frequent flying early can really help.

I fly to Denver a lot, a location where thunderstorms develop over the Rockies during the late morning and then move out to the east over the airport in the afternoon.  My plan is ALWAYS to arrive or leave there before 11 AM.

Denver International Airport

In general, when flying anywhere over the eastern two-thirds of the U.S. in summer, get in and out early, before the boomers start.

Wind shear turbulence and mountain-related turbulence are worse in winter when winds aloft are strongest.

Knowing What to Expect Helps

For me, understanding the situation before I take off helps.  Knowing how long the turbulence will last helps.

It turns out that pilots report in flight about turbulence, in messages called pilot reports or PIREPS.

You can go to a government website and see the locations, levels, and intensities of turbulence (see below). Turbulence is divided into light (green), moderate (orange) or severe (red).  Most turbulence is light. When you hit moderate it becomes unpleasant and the seat belt sign is always on.  In severe, stuff can hit the ceiling.   

It is always good to have your seatbelt on as a matter of course and ALWAYS use it for moderate and severe.


On that government website you can even view predictions of non-convective turbulence produced by software that relates weather model forecasts to the production of turbulence (see below).  I find that it has quite useful skill, but not perfect.


Some private sector companies provide turbulence guidance as well, such as turbulenceforecast.com, and will even provide a custom turbulence forecast at a reasonable price.  If you get internet on your flight, you can check on things as you fly.


Finally, if you are like me and enjoy a window seat, keep an eye out on the clouds ahead.

Substantial turbulence is often associated with KH-instability clouds that look like this:


Looks like waves breaking on the beach, and like such water waves, they are associated with turbulent motions.

On one flight, when the seat belt light was off, I saw such clouds ahead and advised the woman next to me to buckle her seat belt.  She laughed at me.

We hit some substantial (moderate+) a few minutes later and her drink spilled.  She kept the belt on the rest of the flight.😜

December 29, 2023

Is the Low Snowpack this Year a Sign of Global Warming?

The poor coverage of snowpack trends in the Seattle Times and other newspapers was very evident today on the front page of our local newspaper (see below). 


A story "Winter has arrived, snow not so much" filled the right side of the front page.  A reprint of a NY Times article by Mike Baker, this story suggests that the lack of snow was the result of global warming/climate change (see below).

Amazingly, this article neglects the key reason why our snowpack is not doing too well:  this is a very strong El Nino year.  

This incurious article does not review the trend of mountain snowpack over the past several decades: a crucial test of whether climate change could be blamed.

Just poor journalism.   But let's do the proper analysis in this blog, and you can decide for yourself.

El Nino

We are in a very strong El Nino and such events are highly correlated with warm winter temperatures and poor snowpack over the region.  Sea surface temperatures have been about 2C above normal over the past two months (see below).                                               

According to NOAA/NWS, El Nino years are associated with warmer than normal October-November-Decembers (see below for a local climate division)


And snowfall is less than normal over our region for El Nino autumn periods (see below, brown colors)

The warmth and low snowpack over the Northwest during El Nino years are produced by enhanced low pressure over the eastern Pacific and high pressure to the northeast of our region.    The observed pattern for November 1-December 27th this year at 500 hPa (about 18,000 ft) is just like that.


El Nino is clearly a major driver of our anomalous warmth and low snowpack, something not mentioned in the article.

But there is another check on the Seattle Times/NY Times climate-change origin of the low snowpack.

If climate change was the origin, there would be a progressive loss of snowpack over the region as the planet warmed. 

This is something we can check.   Below is a plot of the water content in the NW snowpack on April 1 for the past few decades (1984-2023), courtesy of past Washington State Climatologist, Mark Albright.  The linear trendline is also on there (black/brown line).

Lots of ups and downs, but no trend.   Thus, climate change is not causing a significant long-term decline in our snowpack.   


An independent check on these numbers is to determine when the mountain snowpack has melted out.  Clearly, with less snowpack, the snow would melt out sooner.    Below is the date of the melt-out at Steven Pass (around 4000 ft).

If anything it has gotten later.


Now don't get me wrong.  The planet is slowly warming.   Human emissions are a part of that.  And this will contribute to reduced snowpack over the long term.  But currently, the impacts of global warming on Northwest snowpack are quite small.

Suggestions that our greatly reduced snowpack this year is due to climate change are clearly false.

It is a shame that the national newspaper on record (the NY Times) and our local paper (the Seattle Times) can't investigate the situation sufficiently to get the story right.

Their readers are being poorly informed.

____________________________

Before I forget, Happy New Year to all.   If anyone missed my ATMS 101 class and would like to take a similar class by an excellent colleague of mind (Professor Greg Hakim), you can take it online or in person during the upcoming quarter.    And if you are over 60 you can take it for little cost using the UW Access program

December 27, 2023

A Wet "Drought"

If society and an informed electorate are going to make good decisions about environmental matters, they require accurate information.  

Unfortunately, there has been a lot of poor information about climate change, extreme weather, and drought being distributed by certain government agencies and some media.

One example is the nearly constant talk about drought here in the Northwest and the western U.S. in general, often with a suggestion of a climate change origin.

The most problematic source of the drought claims is the U.S. Drought Monitor graphic produced by a collection of governmental agencies.   This is a subjective graphic, with no rigorous methodology based on objective information.   And it exaggerates drought.

Consider the latest drought monitor graphic for Washington State (see below).  Much of the central and north Cascades are in "Moderate Drought."  Whatcom County and Bellingham, plus Port Angeles to Sequim, are in moderate drought as well.   The NE corner of Washington is in "Severe Drought."  And large additional areas are claimed to be "Abnormally Dry" 


Before we go further, how is a drought defined anyway?

Precipitation has substantial variability over time, with as many years above normal as below normal.   How dry does it have to be to considered drought conditions?

The National Weather Service definition requires not only a deficiency of moisture but "adverse impacts" over a "sizeable area."


The main professional organization of meteorologists, the American Meteorological Society, requires dryness, length of time, AND a "serious hydrological imbalance"

In short, drought requires serious societal impacts.   So have we been unusually dry lately?    Have there been impacts?   Let's not be vague here.... we need to look at hard numbers and real impacts.

Let's start by looking at the cumulative precipitation starting October 1--the beginning of the water year.

For Seattle, precipitation has been above normal (green is actual, brown is normal)

For Bellingham, in the middle of the "drought" area, precipitation is very close to normal.


What about the impacts of the "drought"?

Let's begin by looking at the water situation in Seattle, whose watersheds drain from the middle of the moderate drought area!

The plot from the official Seattle Public Utilities website suggests close to normal water storage (the red line is this year and the blue line is the long-term average)


In fact, the Seattle SPS narrative suggests the reservoirs are a bit above normal:


What about regional rivers?  Surely most of them draining off the mountains would be substantially lower than normal if a moderate drought was going on.

Here is the latest river-level information from the USGS.

Most rivers are near normal (green), some are above normal (cyan and blue), and some of below normal (orange and brown).   Pretty close to normal overall.  Soil moisture (not shown) is near normal.


So there is really no evidence of regional drought based on precipitation or impacts.

But something IS below normal:  the regional snowpack.  This is illustrated by the latest USDA Snotel plot (below), which shows the percentage of normal snow water equivalent in the snowpack.  Most of the mountainous areas are 55-65% of normal, but some are worse, like the Olympics.

So how could snowpack be below normal while precipitation is near normal?

A potential answer:  it has been warmer than normal....with the very strong El Nino being the probable cause.  Below are the recent temperature deviations from normal.  Above normal over much of the state during the past 60 days.

So what do the latest forecasts suggest for the next ten days?   Below is the predicted cumulative precipitation for that period from the European Center model.

California gets hit hard (classic El Nino).  Lots of precipitation over southwestern BC and decent rain along the Washington Coast.  These amounts are below normal for the Washington Cascades. 


The predicted ten-day temperature anomaly from normal is classic El Nino, with above normal temperatures over the Northwest and MUCH warmer than normal temperatures over the northern plains, with southern California and the desert SW below normal.

I worry about the snowpack this spring.  We are dealing with a very strong El Nino and the "meteorological dice" are weighted towards a low April 1 snowpack.


December 24, 2023

With Storms "Bombing" Over the Eastern Pacific, Big Waves Will Hit Our Coast

Although the inland Pacific Northwest is escaping most of the serious storm action, one storm after another is revving up over the eastern Pacific, and such storms, with very strong winds near the surface, can result in the generation of big waves that move to our coast.

Rapidly growing, intense storms are often called meteorological "bombs" and several such "explosive cyclones" will be active to our west this week.

This time of the year, there is a further concern, with very large midwinter "King" tides.

Let me show you some of the forecasts from the UW WRF modeling system, with the maps presenting sea level pressure (solid lines), surface winds (the black wind pennants), and low-level temperature (shading, blue is cold, orange/red is warm)

Monday has a large impressive low off our coast!  Very large area of powerful southwesterly winds.

On Wednesday, there are two offshore low systems

And Friday has a huge elongated low west of the Northwest coast.

Strong winds help build waves.  Big systems with long stretches of strong winds (or fetch) build waves.

Now let me show you some of the wave forecasts from the NOAA WindWatch3 wave prediction system. The highest waves are indicated by the reds and browns.

Monday night around 8 PM the NOAA system is predicting waves exceeding 20 ft reaching our coast!  Large waves will be widespread over the northeast Pacific.

And similarly large or larger waves are predicted around 11 PM on Wednesday.

So expect some good wave-watching on the coast.    

What about the high tides?  The astronomical predictions (no weather input) forecast some relatively high tides during the next few days, so there will be some coastal flooding/impact concerns.

In fact, the National Weather Service does have a coastal flooding advisory for the next several days (below).


December 22, 2023

Low Winds, Winter Sun, and Lots of Clouds Mean Little Renewable Energy over the Pacific Northwest

The typical conditions of mid-winter experienced lately resulted in virtually no renewable energy generation over the Pacific Northwest during recent weeks.

This situation underlines why removing the four power-generation dams on the Snake River would be a serious mistake that would seriously damage our ability to reduce the use of fossil fuels.  

These dams can produce up to 3000 megawatts of power, enough for 800,000 homes.  They are also a critically flexible source of power that can fill in power gaps.

Consider the latest power generation summary for the past week from the Bonneville Administration.  Red indicates the regional demand for energy (load), while blue is hydro generation.  Purple is nuclear power and dark red is coal/gas/biomass.  Green is wind and solar.

Nearly no solar or wind energy during the last week.   


Why so little renewable energy?

 First, the wind has been very light over eastern Washington.  As illustrated by the surface pressure and wind map for late Tuesday (below), a deep low center off of California has resulted in light winds (blue colors) over much of the Northwest--in fact, much of the western U.S.


This has been a very persistent pattern and wind energy generation has crashed.

And then there is solar energy.

The official DOE/NREL map shows the average solar resource for December.  Very little over the Northwest in December (and November and February as well)

Consider the solar radiation during the past year at Pasco in the Tri-Cities over the past year.  The last few days have been the worst of the year.  The last month has been very low.   Not much better last December.


What does the latest forecast model predict for wind energy during the next week?

A continuation of the same pattern, with a low off the California coast and lack of wind over the interior.   

To show this, here is a forecast map of the heights of the 925 hPa pressure surface ( think of it as pressures around 800 m above the surface) for Tuesday, with the wind anomaly (the difference from normal) shown by the color shading.   Red indicates above-normal and blue below normal winds.

The forecast is for stronger than normal winds offshore with a low-pressure center and dead winds (blue) over the western U.S.   The wind turbines will be moving very, very slowly, if at all, this week.


Bottom line: the western U.S. will need all the hydropower generation it has this week to keep the lights on over the western U.S.  

For those interested in reducing global warming, preserving the Snake River dams should be an important priority, since there is no viable plan for replacing their power.   In a few decades, when fusion power is realized (or when we make extensive use of next-generation fission reactors) we will have sufficient power resources to consider dam removal.

But not now or in the immediate future.


December 20, 2023

What is the snow forecast for the holiday season?

 I have gotten several emails from readers asking about the snow situation.

What are the chances for a white Christmas in the lowlands?    What about more snow for the mountains and ski areas?

I will do my best to answer these questions in this blog.

What is the snow situation right now?

The short answer is that current snow coverage and depth are below normal, with barely enough to run the regional ski facilities in Washington.

Let's begin with the latest USDA Snotel maps (below).  Most of the mountainous areas are 55-65% of normal, with the Olympics (29%) being a low outlier (due to a warm, atmospheric river a week ago).


To get a total view of the regional snowpack, consider the latest snow depth graphic from the National Snow and Ice Center.  Nothing over the lowlands (no surprise) and only modest amounts in the mountains.  Oregon is not in good shape regarding snow.

A year ago, when La Nina was in place, there was a lot more snow, which extended down to lower elevations.  

Looking to Christmas Day and beyond
 
Over the next 96 hr (through 4 AM Sunday), there will be only modest snow in the mountains, as suggested by the high-resolution UW modeling system (see below).   Enough to make up for melt and sublimation, but now enough to meaningfully improve the situation.  The European Center forecast forecast is similar.


Then it dries out for a while.   So no white Christmas for western Washington and Oregon.

But the mountains have a chance for more significant snowfall later next week.  An upper-level trough will approach our coast on Wednesday, as shown by the 500-hPa map (about 18,000 ft) on Wednesday (below).


This feature will bring significant snowfall to the mountains.  To illustrate, the map below shows the accumulated snowfall through 10 AM Thursday.   British Columbia gets many feet from this event (great for Whistler) and Mt. Baker will get a significant snow dump.   Not much for Oregon.


Finally, any good forecast should provide the uncertainty of the prediction. Here is the snow predicted at Stampede Pass from the NOAA/NWS GEFS ensemble system of many forecasts.  All the models agree on some light snow before Christmas, but there is a lot of uncertainty regarding the major snow event next week.   Be warned!   Will have to keep an eye on this forecast.


December 18, 2023

Darkness and Murk Covers Eastern Washington

One often thinks of eastern Washington as a place of sunshine and warmth.  But during midwinter the opposite is true:  the lower elevations of eastern Washington are often dark, cold, and covered by persistent low clouds.   

Western Washington is often warmer and sunnier this time of the year.

Twin Bridges NW of Richland was in the murk

Consider the visible satellite imagery for the past two days (see below).  Eastern Washington was engulfed by low clouds, while western Washington only had some scattered clouds aloft.


High temperatures rose into the upper forties and fifties in western Washington (even some locations hitting 60F!),  with mainly 30s over the Columbia Basin.


Solar radiation reaching the surface?   A lot more over western Washington!

Looking at Seattle over the past week, four days had peaks in solar radiation exceeding 300 watts per square meter.


Those poor folks at Pasco only got that high (barely) on two days.   Expert advice:  don't go to the Tri-Cities to get a sun tan in December or January.


However, the Columbia Basin is world-class this time of the year for freezing rain, as rain from Pacific weather systems falls into the cold cloudy air trapped by the Columbia Basin during winter (see map).
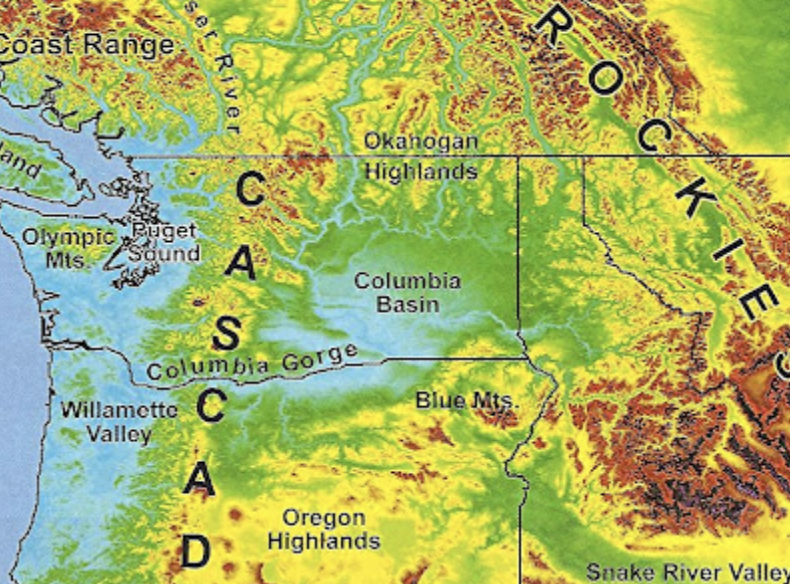
So why is the Columbia Basin so cold and cloudy?  Because it is a basin, ringed by higher terrain (see map below).  The air cools on the surrounding terrain by infrared radiation to space.  Cold air is more dense than warm air and thus sinks to lower elevations.  Some cold air from BC can also "sneak" in through the Okanogan Valley on the northern side of the Basin.


Cold air at low levels in the Basin and warmer air above result in an inversion (temperature warming with elevation), which is a very stable feature that acts as a block to atmospheric mixing.

I can show you that such a temperature change with height occurred yesterday (Sunday) through the vertical sounding from a radiosonde, that was launched from Spokane, Washington.

 Temperatures (right line) are below freezing (0°C, shown by the red line) in the lower atmosphere, capped by an inversion (blue arrow) of temperatures warming with height.  The left line indicated the dew point.  The temperature and dewpoint are nearly the same in the low-level cloudy/saturated air.  Aloft the air is not saturated and thus are no clouds in that layer.


I better stop now before the Columbia Basin Chamber of Commerce sends a hit team to my office.


Big Waves in Hawaii. Why?

 There is a lot of excitement in Hawaii today, as large waves from the northwest reach the north coast of Oahu, making possible the  Eddie A...