May 03, 2022

Wetter than Normal on the West, Drier than Normal in the East. But Why?

During the past year, precipitation contrasts across the Cascades were greater than normal.

The normally wet western side was wetter than normal.

The normally dry area east of the Cascade crest was drier than normal.

But WHY?

By the time you finish this blog, you will know!

Let's start by showing you difference from normal of the precipitation over the state from October 1 through the end of March (see below). 

 Hugely wetter than normal over the western slopes of the Cascades and over the northwest side of the Olympics (purple colors).   But eastern Washington was 0 to 4 inches below normal (yellow colors).
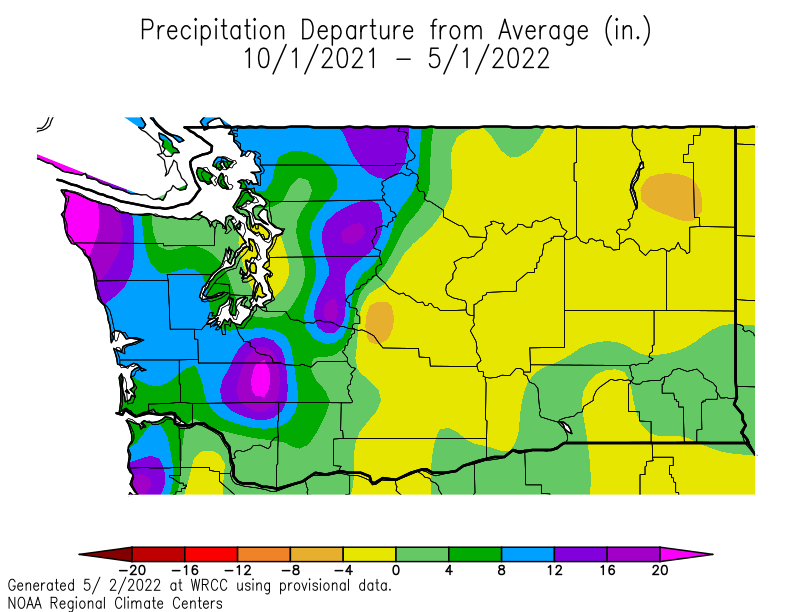


Since eastern Washington is such a dry place, if you really want to be impressed, take a look at the percentage of precipitation for the same period.  Some places on the western side were over 130% of normal, but in eastern Washington, along the eastern slopes of the Cascades and downstream of the Okanagan Highlands, some locations were 50-70% of normal.  

The deficit in inches was small, but if one is talking about an area that is essentially desert, a small drop in inches can be a large percentage.


So why did we get this precipitation pattern, which is clearly tied closely with the terrain?

The answer is La Nina and the large-scale atmospheric pattern it created.  And remember, La Ninas are associated with colder than normal sea surface temperatures in the central and eastern tropical Pacific.

Take a look at the pressures or heights at 850 hPa (about 5000 ft)--see below. 

This plot is showing the difference from normal.  Over the Pacific, pressure were higher than normal at this level.  Over western Canada, the pressures were lower than normal.

The result of these two pressure features was an area of large pressure change over the northwest...and large pressure changes result in winds.  And since winds at this level (around 5000 ft) tend to parallel the pressure lines, this situation produced an enhanced northwesterly wind (from the northwest, see the arrow)
Northwesterly winds cause air to be pushed up the western side of the Cascades...increasingly precipitation there (enhanced upward motion results in more precipitation).

But northwesterly winds also produce more downward flow on the eastern side of the Cascades, resulting in more downward flow that decreases precipitation.

So what does this have to do with La Nina?     Because La Nina situations tend to produce exactly this pressure pattern.  

Want proof?  Here is the plot of differences from normal pressure at around 18,000 ft for La Nina years from a NOAA website.  Mama Mia!  It looks just like the figure above.


So colder than normal waters over the central/eastern tropical Pacific resulted in a strong La Nina this fall and winter, that produced an offshore high and an inland low that led to stronger than normal northwesterly winds, that produced enhanced upslope flow on the western side of the Cascades and downslope flow to the east, which in turn modulated precipitation.

Kind of reminds you of something:


May 01, 2022

A Much Colder Than Normal April: But How Unusual?

 April was a chilly month over the Northwest, but how chilly?   

It turns out the answer depends on where you are located.

The difference between this April's temperatures from normal across Washington State (below) shows that the entire state was well below normal.  The eastern side of the state was particularly frigid:  some areas were more than 6 degrees below normal.

 
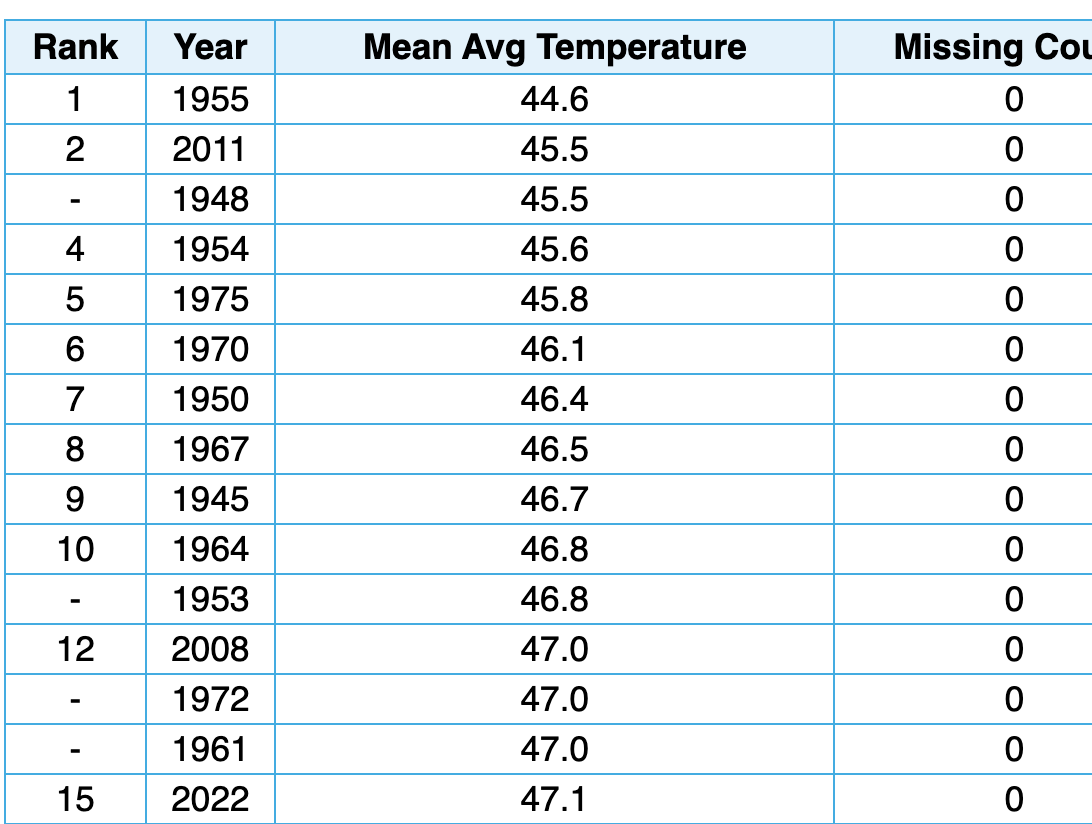
Considering the west side of the state, the April mean temperatures at SeaTac Airport are plotted below.  

This April was the coolest since 2011.


April 2020 was in 15th place for the coolest April since the mid-1940s and was a bit more than 4F below normal.  So if you felt that you were cheated out of normal spring warmth...you are right.


But if you really wanted to experience extraordinary April cold you had to be east of the Cascade crest.

Consider Yakima.  Wow.  It had the third coldest April temperature since the mid-1940s.   And the all-time record in 1955 was only slightly colder.

If you want a longer-term view, check out the April temperatures at Kennewick in the Tri-Cities, whose record goes back to the  1890s.


April was the fourth coolest in over 125 years!  Note the cold period in the 1950s and 1960s--that frigid period is associated with the cool phase of the Pacific Decade Oscillation (PDO), a mode of natural variability in the atmosphere.  

Impressively, this April was way cooler than the early part of the 20th century!


I know the question that is next on your mind.  Will we warm up in May?

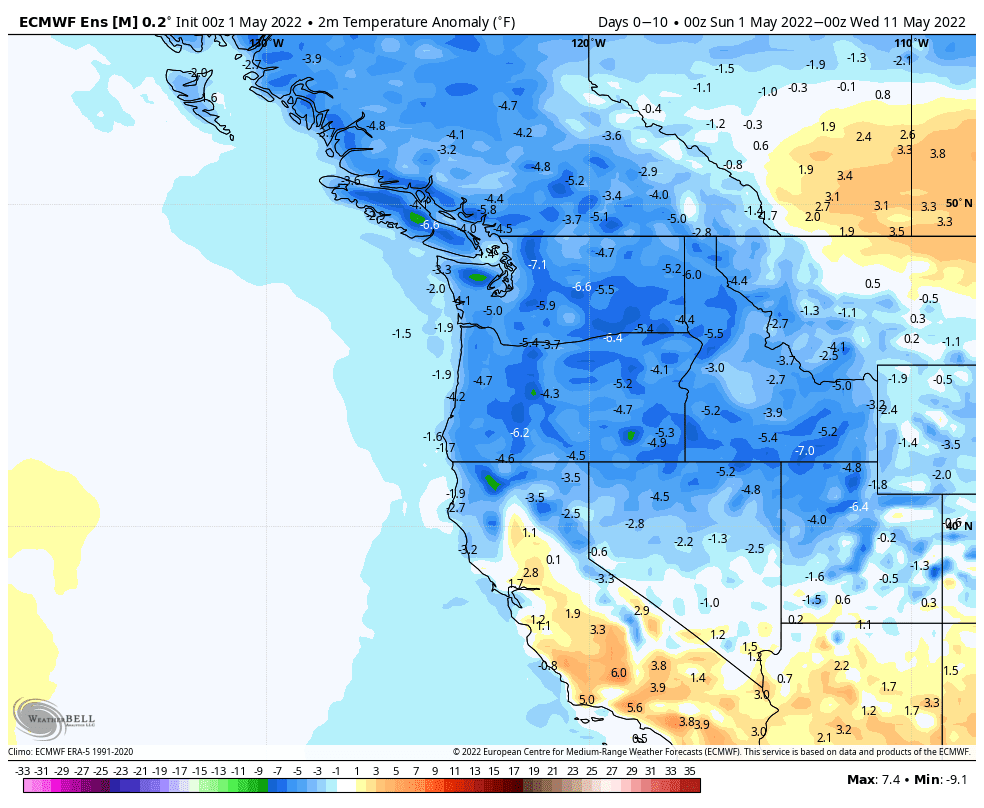
I am a bit nervous about telling you the latest predictions, but here is the latest European Center ensemble prediction for the next 10 days.  Considerably cooler than normal over the entire region.


The official National Weather Service 8-14 day forecast for May 8-14th?   Below normal.


I could show you more, but it might start panic buying of firewood and heating pads.

The bottom line:  don't expect much warming very soon.  

There is good news in all this.  The snowpack situation will get better and better.  The risk of summer wildfires will decline.  The moisture levels in the soils of southeastern Washington look favorable.  And we will have a very extended springtime ski season.

My Mother's Day gift suggestion based on the latest forecast is found below.  Mom will be very pleased with this gift.
 
________________________________________________ 

Reminder:    The Northwest Weather Workshop On May  7

If you are interested, check out the meeting website, which includes the agenda:

https://a.atmos.washington.edu/pnww/

This year, the meeting will include several talks on the June 2021 heatwave and a session on wildfire meteorology.  Plus, more general presentations on local meteorology, regional climate, and weather technology.

You must register on the above website to attend:  the zoom link for the meeting will be emailed to you the week before the meeting.  The meeting is free.


The Meteorology of the Kenmore Air Crash near Sucia Island

On Thursday around 5:15 PM, a Kenmore Air float plane crashed on the south side of  Sucia Island in the San Juans.   An image from the final...