January 30, 2013

A Strange Warm Rain


3 PM View In Seattle
 Today was a day of warm, light drizzle from sunrise to sunset.  Visibility was minimal and air was permeated by an ethereal mist.  Biking home in the drizzle tonight on the dark Burke Gilman trail, I could not remember when I had less visibility.

View from the KIRO Tower Cam...you could barely see the ground!
But although it was drizzling lightly all day, the Camano National Weather Service radar showed nothing for most of the day (see example):

Radar at 3:17 PM

How could that be?

And consider that the origin of the light rain was very different from nearly all of the rain we get here during the winter.

Most rain in the Northwest starts in clouds as ice crystals aloft, often in an environment that also contains supercooled water (water below freezing, but still liquid).   Precipitation develops through the cold-cloud process in which ice crystals collide and grow (aggregation) into snowflakes or ice assemblages, or collect supercooled water that freezes on to the crystal.  As the ice crystals get larger and heavier they fall faster and collect more supercooled droplets and ice crystals.  If the temperatures at low levels are cold we get snow, if warm, the ice crystals melt and we get rain.

Since the precipitation falls from high up and the precipitation particles are fairly large, they show up well on radar.

But today we got some precipitation, the drizzle, from an entirely different process:  the warm cloud process.  In this process, clouds that are entirely above freezing can produce rain.  Shallow warm clouds produce very light rain with small droplets:  drizzle.

Imagine a shallow warm cloud made up of many, many small cloud droplets.  Some droplets are bigger than others and fall a bit faster.  They collect some of the droplets below them and get bigger and thus fall even faster.  Thus, they get bigger and fall faster still, eventually leaving the cloud and falling as drizzle.

Today, the atmosphere was above freezing and saturated at low levels; here are the observations of temperature and dewpoint at Salem, Oregon up to about 7000 ft this morning at 4 AM.  The X axis is temperature (degrees C) and the Y axis is height in pressure.  The rest of the lines you don't want to know about! When temperature (right most line) and dew point (the other line) are the same, the air is saturated (relative humidity of 100%).  You can see that the air was saturated and above freezing up to about 850 hPa (that is a pressure)---about 1500 meters or 5000 ft.

So why did the radar have trouble seeing the drizzle?   Two reasons.  One is that very small droplets don't show up well on radar.  Another is that the radar beam was already quite high when it got to Seattle (about 2000 ft), so it was above the largest drizzle drops, which are found lower in the shallow cloud.

Although warm rain is not rare in the Northwest it produces only a few percent of the precipitation.  So enjoy it...I am sure a dermatologist would tell you it is good for your skin.  And it tends to keep pesky Californians away.


January 28, 2013

Fixing the National Weather Service's Computer Gap

In previous blogs, I have documented the profound inadequacy of the computational resources used for operational numerical weather prediction by the National Weather Service (NWS) and the serious implications this deficiency has for the quality of weather forecasts in the U.S.   I have described how the world-leading European Center for Medium Range Weather Forecasting (ECMWF) now has more than ten times the computer power as the U.S. Environmental Modeling Center (EMC), how U.S. skill in global prediction is in second or third place, and how the lack of computer resources is crippling the NWS's ability to move forward in probabilistic prediction, the next major area of development.
(Reminder:  EMC, part of the NWS, is the operational weather prediction entity of the U.S.)

I have talked to many people about my blogs and assessment, including meteorologists, both inside and outside the NWS, and highly placed managers and administrators in the NWS:  there is essentially no disagreement that we have a serious problem in numerical weather prediction, and that lack of computer power is a major cause but not the only one.

The new NOAA Fairmont Computer Center hss far more capability than EMC's computer center

It is time to fix the NWS's operational computer deficiency and this blog will describe how it can be done within a year using funds that are already appropriated.  But it will take leadership and a willingness to do things a different way.  And an end to highly disfunctional relationships in NOAA and the NWS.  This is going to be a very frank assessment of the current situation and will get somewhat technical in places...so please forgive me or skip this blog if you find it tedious.

The Problem is Worse Than I Thought

When U.S. Senator Maria Cantwell learned about the lack of computer power for U.S.  numerical weather prediction at a luncheon I attended, she asked an important question of the head of the NWS:  how can this be when Congress has appropriated large amounts of funds for weather and climate computers?  He did not answer, but the answer is clear: nearly all of these resources have been unavailable for weather prediction--most are used for climate studies.

But the problem is deeper and more disturbing than that... other groups in NOAA are securing bigger computers than the national operational center, EMC.   And some of these groups are actively working to acquire computer resources for themselves rather than EMC.   A good case is the NOAA Earth System Research Lab (ESRL) in  NOAA's Office of Atmospheric Research.  This lab is tasked with doing research to support operational numerical weather prediction (NWP) in the NWS, even though they are not in the NWS.  As noted in an earlier blog, this is a crazy organizational situation, with those running operational NWP in the U.S. unable to control the research that supports them.  ESRL has been able to find funds for very large supercomputers (the "jet" machines) that far eclipse what EMC has to work with.  ESRL has established essentially operational capabilities and wants to expand it further (they called it Regular Research).  Amazingly, two high administrators in OAR/ESRL told me that I should not be working to secure big computers for EMC but rather should get it for THEM!  I was really taken aback by their attitude.  And recently the Hurricane Forecast Improvement Program (HFIP) received  a large computer resource (placed at ESRL) and HFIP is using them for operational global and hurricane-scale simulations.

NOAA ESRL in Boulder houses supercomputers more capable than those used by the U.S.'s main numerical weather prediction facility

So we have the nutty situation in which operational NWP is starved for computer resources, undermining progress in weather prediction, while climate studies have massive supercomputers available and NOAA fosters active competitors in its organization that are doing essentially operational weather prediction with far greater resources than EMC, the U.S. operational center.   This screams about poor leadership and management in NOAA.

The other problem is that the NWS is wasting a substantial amount of the limited computer power it does have today.  The graphic below shows how the NWS is using their current computer.  A lot of it does not make sense.  Time is on the X axis (entire day) and the Y axis is the number of nodes (a node is a collection of processors) used.  The various colors represent different models or simulations run on this computer.

The red color on the lower portion, the largest use of the computer, is for the Climate Forecast System, in which they run seasonal forecasts.  But they run these forecasts FOUR TIMES A DAY, which makes no sense.  Why run a seasonal simulation that often?  In contrast, running the global model (the GFS), shown by the dirty green color, only takes a small part of the computer.  Furthermore, they run the GFS out FOUR TIMES A DAY to 384 h--why do they do that?  Most other big centers only find it is useful to run out twice a day.  I could find no objective proof in the literature or elsewhere why such frequent runs could be useful.   I can go into more detail, but the bottom line is that the use of EMC's computer is inefficient and not well thought out.  A lot is done for legacy reasons.  A rational evaluation of cost and benefit would clearly change allocations substantially.   But even if they used the current small computers rationally they don't have enough to do what needs to be done.

Production Schedule for EMC's Computer

What do they really need?

      For EMC to serve the nation in a reasonable way, I believe they need the computational resources to do the following:

(1) Run a global ensemble system at 12-15 km resolution (currently they are at roughly 50 km). (Remember ensembles is when you run a model many times with different starting points and model physics, this allows one to get at the uncertainties in a forecast).  This ensemble needs to be running the best physics possible, unlike the inferior physics used in the current U.S. global ensemble system.
(2)  Run convection resolving high-resolution ensembles over the U.S. (1-4 km resolution).  Currently, the U.S. ensemble system is at 16 km resolution.  Many of the runs of the current use inferior physics to save computer time.
(3)  Run a rapid-update system (like ESRL's HRRR) at 3 km resolution.   Eventually, (2) an (3) should be combined.
(4)  Lowest priority but useful.  Run a global model at 2-4 km resolution.

Doubling resolution takes about 8 times the computer power.    My back of the envelope calculation is that the above is doable if EMC had 5-10 petaflops of computer power (well within the range of recently acquired machines by others).  The plan below will give it to EMC for operational use and maintain high reliability.

How to Fix the Problem Quickly

First, EMC needs to get their house in order and reduce the waste in their current schedule, which I estimate is roughly 25% of their current computer.

EMC will get an upgrade this summer of their two .07 petaflop machines (the vendor is  IBM, one operational and one backup) to .2 petaflops.  This is helpful, but not nearly enough.  Congress just passed the Hurricane Sandy relief bill for roughly 50 billion dollars.   Within this bill is 25 million for enhanced hurricane weather prediction and data assimilation and 50 million for hurricane research...money that is going to NOAA.  One thing we learned is that good global weather prediction is the key for hurricane forecasting--that is why the European Center Global Model was the best during Sandy. So you want to help hurricane forecasting?  USE ALL OF THE 25 MILLION TO UPGRADE EMC's COMPUTER RESOURCES.

The German weather service just purchased a 23 million dollar CRAY supercomputer that dwarfs what the U.S. NWS now uses.
Use the 25 million in Sandy money to acquire (EMC likes to lease) ONE big machine, a computer with 1-3 petaflops or more.  My discussions with several computer vendors suggests that the NWS might be surprised about how much they could get for 25 million.  Perhaps as high as 5-10 petaflops if they play their cards right.  I believe this machine could possess at least 99% reliability and folks in the NWS computer hierarchy agree.  (Hell...I have a cluster I use for weather forecasting that maintains such reliability and I do it on a shoestring, surely they can as well!).  The recently acquired NOAA Fairmont machine can serve as backup for the new EMC computer, as well as being available for development and research. 

Thus, the operational load can be split between the current IBM system, which will increase in size again in 2015 to roughly one petaflop, and the new system purchased with Sandy money.  Using these new resources wisely, the NWS operational can jump to world leadership capability in numerical weather prediction and radically improve the products it provides to U.S. users.

Additional Fixes

There is little doubt EMC could quickly take advantage of the increased computer resources (I have confirmed this by talking with their leadership).  However, as noted earlier, the problems in U.S. numerical weather prediction are deeper than lack of supercomputers (although fixing that deficiency would be a good start).  Management and leadership failures have abounded.  To address these problems, immediate attention should be given to the following items:

1. Establish a numerical weather prediction advisory board for EMC that provides recommendations from experts in the entire community.  A big part of the problem is that the National Weather Service folks have been too isolated from the rest of the meteorological community.  They serve the nation but have generally been unenthusiastic and getting guidance and advice from their users, the private sector, and the research community.  This has led NWS EMC to second/third tier status and must change.  For years, U.S. National Academy committees and others have recommended that EMC establish a representative advisory committee that would act as an active partner.  NWS management has pushed back on this and have done nothing.  Enough is enough....this advisory committee should be established immediately and should serve as a sounding board for deciding on which models are run, how they are run, the computer resources, needed and more.
Japan's weather supercomputer (peak .85 petaflops) is roughly ten times larger then U.S. EMC.
2.  Restructure NWP research and development in NOAA/NWS.  The current separation of  weather prediction research from operations has been a continuing disaster and must end.  NOAA leadership finally must deal with this mess.   Moving EMC into NOAA and combining with OAR/ESRL under one manager might work.  Or move ESRL folks into the NWS under EMC. 

3.  Establish a comprehensive verification program for U.S. models.  To improve weather forecasting models you must know their strengths and weaknesses.   The NWS/EMC model verification program is very weak and superficial.  If you want to see how bad things are, check their very poor model verification web pages.  Ask a simple question:  how well the model's verify over the NW?  Better over the mountains or lowlands?  Or how has forecast skill over California changed during the past few decades? You will be disappointed I guarantee you. A lot of the statistics are monthly, making it impossible to determine the trends in model skill.

NOAA money supports the Developmental Testbed Center, which I know quite a bit about (I have been chair of their Science Advisory Board).  The dream was that folks could provide new research innovations that would be tested in an operational-like environment for a wide range of cases.  If successful, they would go into operations.  Sounds good?  After nearly a decade and millions of dollars, this is a dream that never seems to happen.  The DTC should take the testbed role seriously.  Now.

Taiwan's weather bureau has a computer twice as fast as EMCs and has purchased one over 15 times as powerful.

4.  Support a model improvement research program.   The U.S. has the largest meteorological research community in the world, with universities like the U.S. doing cutting edge research on numerical weather prediction and related topics.  NOAA/NWS have failed to take advantage of this huge community, maintaining a miniscule extramural research program.   Any new research funds goes right into NOAA coffers.  This must change.  Let's start with the 50 million in Sandy research money and use most of it for extramural, university-based research. NWS/NOAA extramural weather model research should be targeted to the most acute needs of the National Weather Service modeling efforts.  Trust me, money speaks in the research community.

5.  Create a strategic plan with community input and do it.   Currently, there is NO comprehensive and detailed strategic plan by the National Weather Service on the improvement of numerical weather prediction.   This contrasts with foreign meteorological services (such as our neighbors, the Canadians), who have laid out detailed and aggressive roadmaps of their future direction.   You can't go far without a map.  The NWS needs one and the community should be at the table when it is constructed.

5.  Provide decent documentation of what U.S. modeling centers are doing.

  Want to figure out the details of the models run by the U.S. ?  Good luck.  It is pretty much impossible to do so by going to EMC or its parent NCEP's web sites.  Scanty, out-of-date material is all you will find.  Amusingly, what you WILL find is their response to "certain blogs."  You can't imagine whose.

Let me be blunt: the state of operational U.S. numerical weather prediction is an embarrassment to the nation and it does not have to be this way.  Taiwan, Germany, England, the European Center, Canada, and other nations have more computer power for their weather prediction services.  Our nation has had inferior numerical weather prediction for too long.  New computers are an obvious and relatively easy first step, because they make everything possible.  For the price of a single warplane we could have greatly improved weather prediction that would save lives and property.   Congress and the American public should not accept delays in action.  If this issue was placed before a real leader like President Lincoln, asking him when we should act, I can imagine what he would say (click on the arrow at the bottom of the  picture to find out):


January 26, 2013

Status and Outlook for Northwest Snow

I am getting a number of folks asking about whether there will be lowland snow this winter.   Even the Seattle PI had a story about the fears of a snowless winter.  I know Mayor McGinn and his staff would be disappointed...they are READY for snow, with lots of trucks, deicer, and road sensors providing real-time data. 

But first, what is the status of the regional snow pack during this neutral year (not El Nino nor La Nina).  This graph shows the story.  In general, Washington and Oregon are quite close to normal, which is not surprising during a neutral year when the tropical Pacific sea surface temperatures are close to normal.  A bit above normal snow in the Sierra Nevada, but woe to poor Colorado...quite a bit below normal there.


After bountiful snow during late fall, with deep powder to die for, things went downhill in January.   During the second week we had a period of warmth, high-freezing levels, and rain in the mountains.   There was melting and consolidation of the snow pack and then it got colder.  The result?  CASCADE CONCRETE.  A few inches on top did not help much.  Then it got warm with the big inversion situation and more melting.  And now it got colder. More refreeze.  CASCADE CONCRETE PLUS. When it gets warm you get "spring skiing" on slush.

 I love how the ski areas put a positive spin on bad snow.  Here is the latest  Snoqualmie Summit report:

"the conditions were very soft and great for carving, so this morning's groomers should be super sweet"

Perhaps for ice sculptures....

But I have good news for you skiers.  We have a trough over us, winds are turning northwesterly in the lower atmosphere, and during the next few days there should be a considerable addition of powder.  To illustrate here are the UW WRF model snow forecasts for the next two 72 hour periods.   A foot or two is possible in the Cascades.  And after this period it should dry out until Sunday.   Good skiing may be available next Saturday.


For lowland snow lovers, the situation does not look too good during the next week.  Snow levels will decline to perhaps 1000-1500 ft--not good enough.  And northwesterly flow rain shadows many of you.   But there is still time....the lowlands can get significant snow into the first week of March, but after that the chances drop quickly. 


January 24, 2013

Superstorm in the Atlantic

Although my attention is generally on the Pacific Ocean, I can't help note the weather event that many meteorologists are talking about the last few days:  the development of an extraordinarily intense cyclone in the north Atlantic, a storm much deeper than Hurricane Sandy.

The central pressure of Hurricane Sandy dropped to approximately 940 hPa and was huge in size.  The storm that will be revving up tomorrow is forecast to hit roughly 924 hPa by Saturday morning (4 AM PST).   The is one intense storm.   Here is this morning's forecast of the European Center model made  for 4 AM PST on Saturday.   More isobars (lines of constant pressure) than you can make out.  The shading shows sustained winds at roughly 5000 ft in meters per second (double to get knots).  A large area of greater than 80 kts.  I am pretty sure this is close to what will happen....a wide range of models are giving the same solution and the forecasts have been quite stable.

 Again, our models gave good warning way into the future.  Here is the 120 hr forecast--you can hardly tell the difference from the 48h forecasts shown above.
Just to give you some perspective on this storm, the strongest north Atlantic cyclone on record got down to 913 hPa near Scotland, and getting into the 940s is not unusual in the Gulf of Alaska.

Here is the sustained wind field near this storm when it is predicted to be near its height (note gusts are much stronger than sustained, or average, winds.)  Large area of 50-60 knot winds (shown by shading).  The white lines are streamlines that are parallel to the wind direction.  Huge storm.


The waves produced by this event will be immense.  Here is the latest National Weather Service WaveWatch3 forecast for Saturday afternoon.   Waves off the chart (more than 15 meters-49 ft).  I bet the container ships will avoid this area!

There is an important point here for everyone, including those of us in the Northwest.  Modern numerical weather prediction is now gaining the capability to predict even highly unusual, extreme events days to a week ahead of time.   Time enough for folks and governments to prepare...and in this case for container ships to get out of the way.  It wasn't that long ago that transoceanic shipping would be hit by the big storms, with damage and loss of life.  For example, there is the famous QEII storm (Sept 9-10, 1978(, where the great ocean liner found itself in the middle of an intense storm.

The forecast for the Northwest U.S. will be boring, benign and normal for the next several days.  No more inversions, fog, and crazy temperature variations through this weekend into early next week.  We will get another ridge of high pressure next week...but the US model is suggesting the potential for a lowland snow event...a modest one...next Thursday.  Too early to say much.


January 22, 2013

The Secret of Snoqualmie Pass


How would you like to take a ski lift where you begin with temperatures in the low teens and by the end of your journey minutes later (and after a second lift), you are sweating in the sun with temperatures close to 50F.

Such a trip waited for folks yesterday morning in Snoqualmie Pass, and particularly those ski aficionados enjoying the slopes of Alpental.  Take a look at the temperatures at Alpental courtesy of the Northwest Avalanche Center at the top (5470) and bottom (3100 ft) of the runs.  For hours that morning, the temperatures at the lower lift was below or near 15F, while temps were near 45F and as high as 50F at the top.  You will notice that this difference has increased during the past few days as temperatures aloft have warmed and near surface pass temperatures have cooled.  Even during the afternoon today, the differences were huge.


It is really not unusual to get much cooler low-level temperatures in the lower elevations of the pass and warmer temperatures above, and in fact that is connected with the "secret" that makes skiing in Snoqualmie Pass possible.    But more on that later.


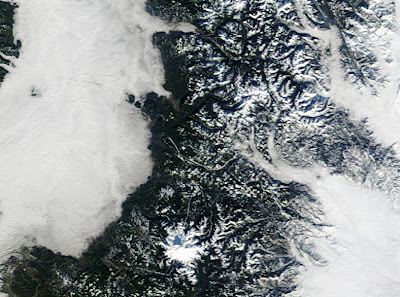
Today, we had pools of cool area in both eastern and western Washington, the latter is relatively unusual, but cold air in the basin of eastern Washington during the winter is par for the course.  In both, the cold air was associated with fog and low clouds.   Take a look at the high-resolution MODIS imagery for yesterday, centered on Snoqualmie Pass.  Pretty impressive.  You can see the clouds on both side, snow over on the mountains, and the big white mass of Mt. Rainier in the lower middle portion of the picture.  Look closely and you will spot fingers of fog-laden cold air moving up the valley from Ellensburg to Cle Elum to the eastern slopes of Snoqualmie.  Why were low clouds pushing in from the east and not the west?   Easy to answer.   Today there was a moderate offshore pressure gradient (higher pressure to the east of the Cascades than to the west, and that pushed the low clouds eastward.


So at Easton, well east of the pass, they were in solid clouds:

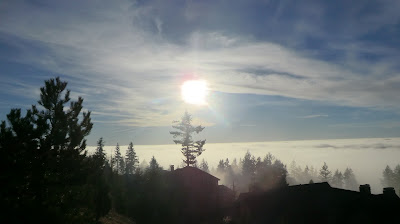
While at Hyak, close to the pass on the eastern side, the low clouds were thinning rapidly.  In the first picture of the blog, taken from the upper portions of the Alpental lift looking eastward, you can see the thinning clouds from eastern WA.

Here is simulation of the temperatures over our state at 10 AM yesterday...the cold air in eastern WA and the fingers of cold in the passes are clear:

 And a model vertical sounding of wind and temperature at this time at Stampede Pass (about 10 miles east of Snoqualmie)  shows the thin, cold  easterlies (red is temperature, the x axis is temperature, the y axis is pressure, 850 is around 5500 feet, 700 around 10000 ft):


Eastern Washington is a reservoir of cold, foggy air during much of  the winter and an offshore pressure gradient is the normal state-of-affairs with the frequent occurrence of low centers over the eastern Pacific.  Thus, even if the air approaching the Cascades sloft is relatively warm....too warm for snow at 3000-3500 ft where the lower portions of the Snoqualmie runs are located....the  veneer of cold air moving westward into the Pass at low levels keeps temperatures cold enough for frequent snow.  The old Mt. Pilchuck skiing area near Everett did not have a pass to supply cold air and skiing there is history.

January 20, 2013

Summer and Winter at the Same Time

What is going right now is quite amazing...summer and winter are within a half-mile of each other in much of the Pacific Northwest.   Move a half mile and you can go from a maximum temperature in the mid-30s to the 60s or even near 70 (that is summer-like around here).  The only detail is that this half-mile is in the vertical.

I have been looking at weather around here for a while, but this has to be one of the most extreme inversion cases I have ever seen.   Take a look at the maximum temperatures yesterday in western Washington.  High temperatures in the mid to lower 30s (even some 20s!) in the western lowlands, but 50s and 60s at observation locations around 2000-3000 ft.  TWO stations in the hills southeast of Olympia got to 73 F.   Yes, the 70s.  Lots of locations in the Olympics were in the 60s.


Looking regionally, you can see this craziness extended into northern Oregon.  Many 70s there. (not sure I believe the 85F reading!).  Cold air is entrenched in the bowl of eastern Washington and warm temperatures (40s-50s) are found along the coast.


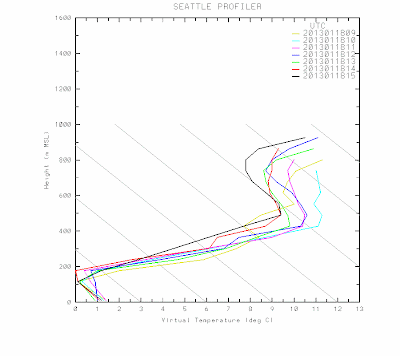
These startling contrast are associated with one of the strongest low-level inversions I can remember.  Here are the observed temperatures above Seattle this morning.  Above a cool layer near freezing that is roughly 200 m (600 ft) thick, there is a huge, sharp inversion, with a temperature change of 14C (TWENTY FIVE DEGREES F) in 400 meters (1300 ft).  You read that right. Hard to believe.

Or you can look at the temperatures from aircraft coming in and out of Seattle-Tacoma Airport at 7:00 AM this morning.  Near 60F at 7AM between 2200 and 2800 ft.  Instead of going to Hawaii, rent a helicopter.

Yesterday, desperate for sun, I took my family and dog up to Cougar Mt. Park (around 1200ft).  It was wonderful, with sun and warmer temperatures.  Driving down the hill I spotted a high neighborhood (the Pinnacles) and parked my car above a slope there.  The view, shown below, says it all:


I didn't want to leave and return to the murk waiting a few hundred feet below.


January 19, 2013

Amazing Contrasts in Maximum Temperatures


These are the maximum temps for the 24-h period ending 10 AM on Saturday.  Amazing contrasts....in the fifties (some near 60F) at locations a few thousand feet above sea level, while it only got into the thirties and very low 40s near sea level.  A number of locations at lower elevations never got above the mid-30s.  It was WAY warmer in Snoqualmie Pass than in Seattle.

This is a real inversion!   I am heading to a local peak this afternoon to enjoy spring-time temperatures and warmth (Issaquah Alps and higher hills on the east side will do)....

January 18, 2013

Relief Aloft

For many folks in the lowlands of western Washington and Oregon, the day was dismal, dark, foggy, and cold.   Here is an example, taken at 4 PM at the top of my building at the UW in Seattle.

But warmth and sunshine was close at hand--you just needed to gain about 1000 ft.

For example, a short drive up to a hilltop (1170 feet) in Bellevue brought sun and ethereal views of the cloud layer below (pictures courtesy of Peter Banda, taken around 4 PM):


Want to stay in Seattle? Just take the elevator ride to the Columbia Center's observation platform (around 1000 ft high) as Joseph Chan did today:


Amazing pictures...the clouds reached up to just under 1000 ft.  And as you rise above the clouds you enter the inversion and temperature warms rapidly--to roughly 50F at 2500 ft!


Super Inversion and Bad Air

Cold air and foggy conditions have dominated the lowlands on both sides of the Cascades, as  shown by visible satellite imagery this afternoon. The irony of all this is that while near sea level the temperatures were in the 20s and 30sF , a few thousand feet up it was sunny and in the lower 50s.

As you know, such situations in which temperature increases with height are called inversions, since they are  opposite to the normal situation of temperature decreasing with height.  Using the capabilities on the SnowWatch web site, here is the temperature variation with height at 5 PM on Thursday--around 50F at 2000 ft and around freezing at sea level.  These are the kind of days I love to hike up Tiger Mountains or other peaks in the Issaquah Alps.....frigid in clouds at the start and low-fifties and bright sun after a short hike.  Maybe this weekend!

Here is the plot of temperature with height around 7 AM Friday morning.  Heights are in meters.  Mama Mia that's an inversion.  There is a lower cool layer about 200 m (600ft thick), topped by a very sharp inversion to 400 meters, in which the temperature increases about 9C (16F)!
Here is a picture from a home in Bellevue at 1170 ft at 8 AM Friday..they are just above the low clouds:

 Inversions are the natural result of a having high pressure over us in winter.  High pressure is associated with sinking air that eliminates upper and middle level clouds, allowing the earth to radiate heat to space.  Thus, the earth can cool effectively and that cools the nearby air.  So we have our refrigerator at the surface.  The sinking of air aloft associated with the high pressure produces warming, since air is warmed as it is compressed as it travels from lower pressure aloft to higher pressure closer to the surface.  A virtual hot plate aloft.  Cool the surface and warm aloft and you eventually get an inversion.

Inversions tend to strengthen in time as long as high pressure remains aloft.   Inversion layers are associated with great atmospheric stability---think of them as atmospheric lids.  Cold air is dense and heavy and likes to stay under the less dense air aloft.

The result of this stability is lots of low clouds, fog, cold temperatures, black ice, and unfortunately air pollution.  In fact, for much of the last week the Puget Sound Clean Air Agency has had a burn ban in effect and during the last day air quality has really declined in places.  Here us a plot of the particulates in Seattle Duwamish Valley.  Not good.  In fact, it is bad enough the PSCAA is declaring the air as unhealthy for sensitive groups.

I should note that the bad air quality in Beijing also has occurred under cold high pressure, but their readings are MUCH, MUCH worse.

The poorest air quality in our region tends to be in valley's or bowls where the cold air can settle and winds are weak:  some of the drainages in Lake Forest Park can be very bad, as can the terrain bowl near Darrington.  Southern Puget Sound is also an air quality problem area.

The local high-resolution forecasts made at the UW also predict the amount of mixing or "ventilation" of the lower atmosphere for the use of local air quality agencies.  Here is the prediction for Saturday morning...not good.


NW air quality has been actually improving for several reasons.  First, a LOT less people burn wood today--it wasn't a long time ago that the Seattle Times had pages of ads for wood burning stoves.  Many folks now have gas fireplaces or inserts instead.  Second, the burn bans are very effective tools, discouraging folks from burning wood when the atmosphere is stable.   So some of you might not be happy with the Puget Sound Clean Air Agency, but their efforts (including burn bans) have a very significant impact on reducing air pollution during the winter. Third, cars and trucks are considerably cleaner now...and more.

The forecast.....cold and low clouds through early next week.  And then on Tuesday we make the transition to our normal weather.  Warmer with rain sounds ok, after sun, fog, and cold.  But first, Tiger Mountain.


January 16, 2013

Strange lines over the northeast Pacific

The visible satellite imagery over the northeast Pacific Ocean looks very strange today, with weird-looking lines and strange shapes in the clouds.  Take a look at image from 11:15 AM this morning from the National Weather Service GOES weather satellite:


You can also see the low clouds over Willamette Valley and the snow in the Sierra Mountains, as well as those infernal lines over the Pacific.  You can get another view of these clouds from the high-resolution MODIS satellite:


What are these lines?   They are commonly called ship track clouds and are produced by the particles emitted by ships that burn oil, diesel, or coal.    We often see ship tracks in the late spring and early summer, but they are fairly unusual this time of the year...and I will tell you why.

Right now, we have a BIG ridge of high pressure over the eastern Pacific, more like a summer pattern than a midwinter situation.  Here is the surface map at 10 AM to illustrate:

With high pressure we don't have storms or fronts, and certainly none of the clouds associated with them, since high pressure is associated with sinking air.   Sinking air produces a stable situation, often with an inversion (a zone of increasing temperature with height) above a shallow marine air.   Without a lot of mixing from the strong winds of storms, this shallow marine air layer gets saturated (it is in contact with the ocean!), with lots of thin stratus and stratocumulus clouds.

But where do the ships come in?  It turns out that Pacific air is relatively clean, often with only 10-20 particles per cubic centimeter.   Cloud droplets form on this particles and thus over the ocean we tend to have relatively few cloud droplets (but bigger ones) in some volume of air.  But combustion from ships produces lots of particles and can increase the numbers to hundreds per cubic centimeter (see graphic).  That results in a lot more cloud particles, but smaller ones.
Having a lot more particles, but smaller ones, reduces the ability of the clouds to precipitate, so the clouds last longer.  And it turns out that clouds with more small particles reflect much more of the sun's light, appearing brighter.    That is the origin of the ship tracks...the pollution of the ships enhancing the clouds and making them brighter.  The ship tracks tend to get wider downstream of the ship as the combustion particles mix into the environment.

We can look at super high resolution MODIS imagery and can almost see the ships.  Here is an example:


The U.S. Navy was very concerned about ship tracks during the cold war, since it was a way the Russians could spot our non-nuclear ships.  

Now could we use ship tracks to combat global warming?  Some people have suggested we do so.   Ship tracks produce clouds that reflect more of the solar radiation back to space (that is why they are whiter!) and thus help cool the earth.   So lets produce many more ship tracks...but we want to do it without burning fossil fuels.   To do so, it has been suggested we build a fleet of giant ships that inject salt water droplets into the atmosphere--the water would evaporate, leaving huge numbers of salt particles to waft into the atmosphere (see picture).   The result, a huge amount of particles and a lot more cloud droplets...super ship tracks and perhaps a bit cooler climate.


The Highest Pressure in Ten Years

 Did you feel the pressure yesterday?    Feel a bit weighted down?    If so, it may not be due to the political energy in the air. Yesterday...