April 30, 2014

The U.S. Slips to Fourth Place in Global Weather Prediction, While a New Weather Service Supercomputer Has Not Been Ordered

It is with considerable disappointment that I note that the U.S. has now slid into fourth place in global weather prediction.  

Yes, the country that invented numerical weather prediction and the one that possesses the largest weather research community in the world is moving further back in the pack, with substantial costs to the American people.  And frustratingly, a powerful new weather supercomputer,  funded over a year ago by the U.S. Congress, has not even been ordered, even though it could radically improve U.S. operational weather prediction.

But first, the statistics, available from the National Weather Service's own verification site (the NWS modelers are not hiding anything, give them credit for that!).  Here is an evaluation of the skill of  major global weather forecasting centers for Northern Hemispheric prediction skill at 5 days for the 500 hPa level (about 18,000 ft) up.  The graphic shows the anomaly correlation (how well the forecasts correlate with an analysis, 100% is best) over the past month.   The order for best to worst:

1.  European Center:  .919
2.  UKMET Office:  .896
3.  Canadian Meteorological Center:  .881
4.  US GFS: .871

You will notice the European Center (red triangle) is uniformly very skillfu) and rarely has large drop-outs, periods, when skill drops precipitously.   But the U.S. National Weather Service's model, the GFS, has major drop-outs with substantial loss of skill.  Such periods would lead to far less accurate forecasts compared to the European Center.

Here is another way of viewing the 500  hPa skill, this time for the entire globe and for various forecast projections..  This graphics shows you the relative skill of other centers compared to the U.S. GFS model. Positive numbers indicate better skill than the U.S., negative worst.    The red line is the European Center...much better at nearly all times. The yellow...the UKMET Office...better for all available times (through 144 h).  Our hockey loving friends to the north (green line), better through 160 hr.


A major reason why the U.S. is failing behind is that the other centers are using far more advanced data assimilation or higher resolution, both of which require very substantial computer power, which the U.S.National Weather Service has been lacking.

But the costs of lack of computer power extends to local forecasting as well.   Big damaging thunderstorms have been in the headlines for days now.  It is no secret what needs to be done to improve these forecasts: we need a  convection-resolving ensemble system, running 50-80 model runs at around 2-3 km resolution.   National Academy Committees have recommended this.  Several workshops have recommended this (I know, I chaired two of them, and was on one of the National Academy Committees).  My colleagues in the NWS admit that they need to do this.

To forecast severe convection, requires state-of-the-art 
high-resolution ensemble forecasting systems.

But the National Weather Service hasn't had the computer power to make this next step towards high-resolution prediction over the U.S. a reality.

But here is the amazing part.  A year ago, Congress gave the National Weather Service the money for a very large, 2-3 petaflop weather supercomputer.  A computer, that properly used, could greatly improve skill in predicting both global and local weather.  To quote Louis Uccellini, the head of the National Weather Service, "a real game changer."

But now a year later, NOAA has still  not ordered the computer (the National Weather Service is part of NOAA).  Why?  Because they made the mistake of signing a very long contract with IBM and IBM sold their server division to Lenovo, a Chinese company.  And the U.S. is nervous about having their weather computer provided by the Chinese.
High-resolution (1-3 km grid spacing) convective forecasting using advanced numerical models in an ensemble setting, has the potential to greatly improve severe storms' forecasting in the U.S.  Unfortunately, the National Weather Service lacks the computer power to do so.

There seems to be no leadership at NOAA to quickly resolve this issue.  And there are many solutions. For example, IBM could buy an American computer from Cray, an American company.  In fact, Cray sold new machinse to the European Center and the German weather service recently.  Or the government could use the Lenovo sale to void the contract with IBM and shop elsewhere (like CRAY).   Or they go ahead with IBM deal, with full knowledge that there is little reason for the Chinese to mess with our weather forecast models, particularly since a number of Chinese operational entities use our GFS.


Would our military be content with 4th best hardware when dealing with threats to national security?  I doubt it.  If we had inferior planes or ships, citizens and congressmen would be screaming from the roof tops.  And we know that the NSA or CIA would not tolerate second-rate computers, yet for weather prediction it is ok.  Better weather prediction is our first line of defense against extreme weather, and I thought this administration was worried about global warming induced extreme weather.

Hundreds, if not many thousands, of Americans are dying of weather-related threats, and trillions of dollars of our economic activity is weather sensitive, and we are content with a capacity far inferior to state-of-the art weather forecasting.  U.S. companies pay the European Center millions of dollars a year to secure the world's best forecasts, a national embarrassment.

Today, Kathryn Sullivan, head of NOAA, will be testifying in front of Congress.  Our representatives should ask her how she will solve the NWS computer acquisition problem, quickly. 

April 28, 2014

How can we be SURE about the upcoming Northwest heat wave?

It is going to get warm west of the Cascades, and meteorologists are very sure about it.

But why are we certain about the warm-up this week when sometimes our confidence is far less?

The answer:  ensembles of many numerical weather forecasts

For example, the U.S. National Weather Service and the Canadian Meteorological Center both contribute 20 global forecasts, twice a day, to create the North American Ensemble Forecast System (NAEFS).

 If these forecasts are mostly on the same page, one has a lot more confidence in the forecast.  If they are very different, less confidence.


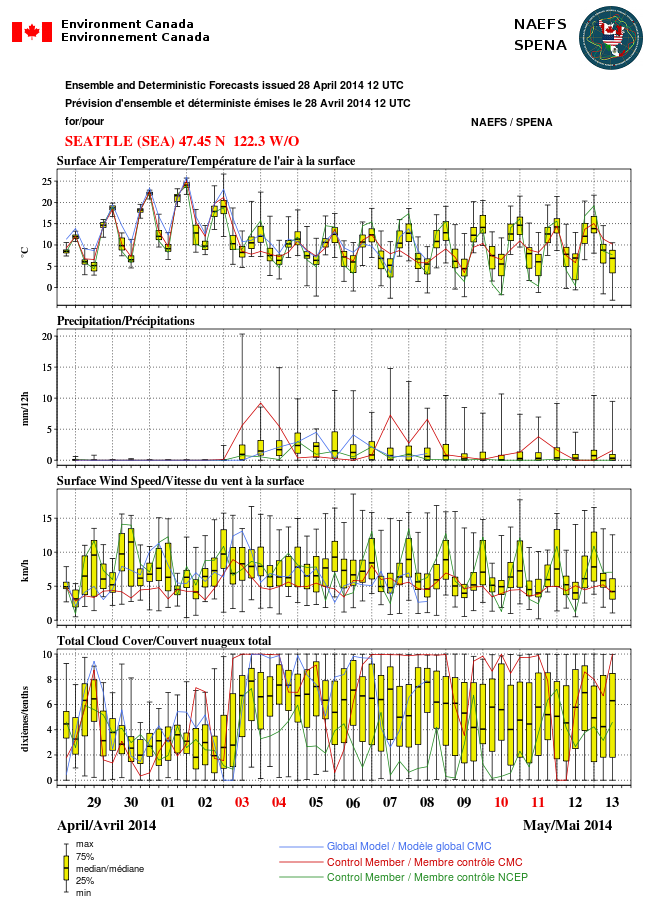
So lets take a look at the latest NAEFS forecast for Seattle.  First, the complete output for several parameters.

You notice a lot of the data points are shown with what we call a box and whisker plot.   The median of all the forecasts is shown by the horizontal line in the middle (half of the forecasts are above and below).   50% of the forecasts (25% below the median and 25% above the median) are within the yellow box.  The extremes of the ensembles are shown by the "whiskers."

Looking at the second panel above, the models are in great agreement that there will be no rain through May 2.   Temperatures are shown every 6 hours (top plot).  You notice temperatures are warming rapidly the next few days, with the models in substantial agreement on the high temperatures (little spread). So we have confidence in this prediction. You will also see that a cool-down is predicted on May 3, but the agreement is less.

The European Center has a VERY good global ensemble system and  here is the ensemble forecast for temperature at about 5000 ft (850 hPa).  The mean of the ensemble is shown by the blue lines--the mean of the ensemble is often a very good forecast.  Quite warm...16C reaching us at that level.  The shading show a measure of how much the ensembles vary (standard deviation).   VERY LITTLE VARIATION, which mean a very confident forecast.


So buy that bag of ice...you WILL need it.   And lets end by looking at the high resolution (4km)  WRF forecast for surface air temperature and wind...which should be very skillful based on the above. Tomorrow at 5 PM, should get to around 70F over western Washington, warmer in the Willamette Valley.  You see the easterly flow?  That will really rev up the temperatures by removing the marine influence and warming air  by compression as it sinks west of the Cascade crest.


Mid 70s on Wednesday afternoon at the same time.


 And looking at the 12-km forecast for Thursday at 4 PM (May 1), temperatures get up near 80F over the western lowlands and the Columbia Basin  But you notice that the winds have switched directions and have begun to flow from offshore...this will be the last warm day.  In fact, the last warm day of the sequence is frequently the warmest.


With easterly flow, the warmest temperatures on several of the next few nights will be over the western foothills of the Cascades (see example below for 8 AM Thursday).  Why the foothills?  Because that is where the air had been sinking and warming as it descending the slopes.


\

April 26, 2014

April Heat Wave!

Get your shorts out.  Stock up on sun tan lotion.  Make sure you have ice and cold drinks.   Because some of the warmest April/early May weather we have seen in over a decade looks increasingly probable for Wednesday and Thursday of the upcoming week.  Maybe even reaching the big EIGHT-OH!


At this point most of the leading models are going for this warm forecast, so I feel pretty confident telling you about it.

Let me show you the 12-km UW WRF model forecasts for this week.    First, we have to get through a some rain tonight and showers on Sunday...sorry folks.  April showers are required.  But then on Monday and Tuesday, upper level ridging  (high pressure) start building over the eastern Pacific.  Here is the upper level (500 hPa, around 18,000 ft) maps  for 5 PM Monday and 5 PM Wednesday.  The will be  a huge ridge developing over the West Coast with very large north-south extent.


 This ridge will warm us up in two ways, first it is associated with general warming of the atmosphere and lots of sun.  But it will also bring increasing offshore flow, which really revs up the heat, as warm, continental air east of the Cascades sinks and is warmed further by compression as it descends into the western lowlands.

Let's follow the 2-m (surface) air temperature and near surface (10-m) winds  that is forecast by the UW model.   First,  at 5 PM Monday:  56-60F over western Washington and a bit warmer near Portland and the Columbia Basin.


Tuesday afternoon, a notch warmer,with 60s over western WA and 70s to the east.

 Wednesday brings real warming. Widespread 70s in western Washington as easterly flow really cranks up, with some areas in SW Washington and the Willamette Valley hitting 80F.  Portland will be warm.


And then Thursday at 5 PM.  What can I say?  We haven't seen April temperatures like this in a decade.  A number of folks away from the water could get to 80+F that day.  I suspect that a 24-h virus may be rampant that day.

 Friday is the transition day, as onshore flow develops, with temperatures remaining warm from Seattle northward, and eastern Washington really surging in the torrid zone as the ridge moves inland.

At this point in time, the official outlets are going conservative, as they should.  The National Weather Service is predicting 79F for Wednesday and 81F for Thursday. Very reasonable.


The Weather Channel is slightly cooler than the NWS:

For those of you those like weather statistics, my colleagues at the National Weather Service have noted that the average first day getting to 80F in Seattle is May 23rd....we will do much better that that this year!   And let me provide an important warning.  Just because we are going to have a few summer-like days, don't think you can put those tomatoes outside yet:  cool weather will come back next weekend! 


April 24, 2014

Are Pacific Northwest Waters Too Risky for Oil And Coal Ships?

Pacific Northwest ports are being increasingly used to ship oil and coal to Asia.  Unfortunately, Northwest inland and coastal waters are some of the most dangerous in the world, with strong winds, powerful currents, rocky shores and river bars.  Unstable, steep slopes threaten train traffic heading to coal/oil ports, and a huge fishery and shellfish industry is at risk if a spill occurs.  With coal and oil shipping potentially increasing substantially over the next decade,  the threat of major or catastrophic environmental damage is substantial.  This blog will discuss many of these dangers and will suggest that they pose an unacceptable risk for the Northwest.

The Pacific coastal water from south of the Columbia River outfall to the tip of Vancouver Island to the north (see map below), is commonly known as the Graveyard of the Pacific, and for good reason.  You start with abruptly rising rocky coasts, add strong winds, and mix in low visibility from incessant fog and rain.

The blue region on the map is known as the Graveyard of the Pacific

Strong winds, sometimes reaching hurricane strength, batter the Washington and Oregon coasts in winter and the foggiest location in the continental U.S. is Cape Disappointment on the northern terminus of the Columbia River (with 106 days a year of dense fog!).   The interaction of the westward moving flow of the Columbia River and incoming waves produces the dangerous Columbia Bar (see picture), with large waves and threatening shoals.  Strong easterly winds exit the Strait of Juan de Fuca, frequently reaching 60-80 mph.

 The Columbia Bar is treacherous for marine passage

A variety of obstacles greet the mariner at the western entrance to the Strait of Juan de Fuca

These dangerous conditions have produced hundreds, of not thousands of shipwrecks, along the Washington, British Columbia, and Oregon coasts (see figures).  Most of these shipwrecks were between 1850 and 1950 and modern navigational aids have dramatically reduced the threat.  But the threat is still there...strong winds, low visibility, rocky shorelines.


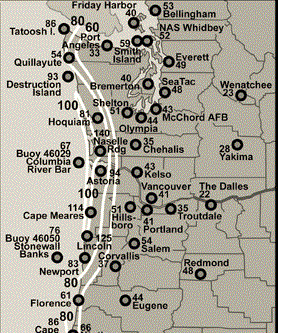
The Northwest may not get hurricanes, because our water is too cold, but our strongest cyclones have winds equaling that of  category 1 or 2 hurricanes, and our storms are far larger in size.  Our shores are no stranger to 100 mph winds, as illustrated by the recent December 1-3, 2007 coastal gale (see map)


Our offshore conditions are so severe that the National Weather Service can not maintain our offshore buoys:  most are broken or adrift today.

Coal and oil ships from Puget Sound and Northwest Washington (e.g., Cherry Point near Bellingham), must exit the Strait of Juan de Fuca, a waterway infamous for strong and often poorly predicted winds.   When air pressure is higher inland and lower offshore (very frequent in winter), the winds accelerate to the west, often reaching 60 mph and more at and east of Tatoosh Island, at the Strait's western terminus--a danger to shipping recognized for many years (see article below)


Here is a simulation from the modern WRF weather prediction model for a modest esaterly  case in 2010, with winds only getting to 60 knots near the western entrance.

And when fronts moves eastward across the region or marine air surges into the Strait during summer onshore marine pushes, westerly winds can increase to 60-90 mph over the central and eastern Strait.   One of these events destroyed Ivar's  Mukilteo Landing restaurant in 2003 and another heavily damaged the Ferry Elwha in Everett Harbor and caused a huge blackout over Snohomish County.


But far more dangers await coal and oil ships heading towards the proposed mega terminal at Cherry Point.   First, to get from the Strait to the terminal they have to wend their way through a maze of narrow passages and islands (see map).

And  a major meteorological lurks in this area:  strong northeasterly winds pushing out of the Fraser River valley.   When there is cold, high pressure in the interior of British Columbia and lower pressure over western Washington, air can accelerate down that gap, often reaching 40-50 mph north of Bellingham and out towards the San Juan Islands.  Yes, we are talking about right over the Cherry Point terminal. These winds can be as strong as 80-90 mph, as illustrated by the event of December 28, 1990 (see map below). The inner dotted line indicates winds exceeding 40 meters per second--that is about 90 mph!


 And here is what happened at Anacortes Harbor that day, or what was left of it.  Let's say many of those boats never floated again.


Not only do the Fraser gap winds make marine traffic difficult if not impossible when they are active, but they would blow coal dust from Cherry Point over the San Juan Islands.  What's not to like?

And what about getting the coal to the Cherry Point terminal?  Trains from Wyoming and Montana would move northward along the Puget Sound shoreline, the location of unstable cliffs containing all kind of glacial deposits.  Heavy precipitation strikes this region, leading to many landslides each year. As you all know, the slopes above the tracks are constantly failing, either closing the tracks or threatening to push trains into the Sound (which has happened).  Can you imagine the potential for a huge oil spill in such a situation?


Strong winds, dense fog and poor visibility, landslides, sand bars, rocky coasts, strong wind shear, and more.   Northwest waters are uniquely threatening to oil and coal ships, at the same time our environment is uniquely vulnerable to a major spill, including a huge shellfish industry and valuable fisheries.  Acting as a huge coal/oil port makes no sense for us.  And it is particularly senseless because the huge carbon export will come back to harm us in two ways:  (1) make a large contribution to CO2 in the atmosphere and thus global warming, and (2 ) some of the the pollution from burning the coal and oil will be spread across the Pacific back over the Northwest.

Marine safety has improved dramatically over the past 50 years, there is no doubt about that.  But human error is still with us, as shown dramatically by the recent sinking of a Korean ferry, the grounding of a cruise liner off Italy, and the loss of the Exxon Valdez in 1989, to name only a few.  Huge increases in the number of oil and coal ships entering our waters enhance the risk that human error will lead to an environmental catastrophe for our region.  And for what?

Life is always about risk versus reward.  In this case, the former is far, far greater than the later.

The grounding, break up, and burning of the new Carissa in 1999 show the threat of ship wrecks continues today.  Oil from the ship polluted the coastline.

Climate 101 Luncheon on Monday in Seattle

If any of you are interested, I will be participating in a Climate 101 luncheon sponsored by the Seattle Chamber of Commerce and mc'ed by Jeff Renner of KING TV.   There is some space left.  For more information go here.

April 22, 2014

Why are there double rainbows?

There seems to have been an unusual number of spectacular double rainbows around the Northwest during the past week, and several have you sent me some stunning pictures.  Let me show you a few samples.

 Picture Courtesy of Tom Kreyche from Capitol Hill, Seattle

Pictures courtesy of Seelye Martin in Laurelhurst, Seattle

Why TWO rainbows?  Most of the time only one is clearly apparent.

As many of you know, rainbows result when light from the sun enters a raindrop and experiences a reflection at the back of the drop and heads back to the observer (see schematics).  Sunlight has all wavelengths of visible light, from short wavelengths (purple and blue) to longer wavelengths (red and orange), with yellow and green in between.  As sunlight reaches the raindrop it is refracted (bent) upon entering the drop, reflected off the back of the drop, and then refracted again when leaving.  The interesting thing is that the amount of bending during refraction depends on wavelength, with longer wavelengths (e.g., red) bent less than shorter wavelengths (e.g., blue).  This is called dispersion, which results in the sunlight being broken up into a spectrum of colors:  the rainbow.


But sometimes, there are TWO reflections in the back of the raindrop, which produces another rainbow, with the colors reversed (see figure below).  This is the secondary bow, which is generally fainter than the primary bow.  Look at the pictures  above; can you see the reversal of colors?  Red is at the top of the primary bow, but at the bottom of the secondary bow.


Quiz time....is this picture of a double rainbow below real or fake?  The answer: FAKE.  No color reversal between the bows. Someone got carried away with Photoshop.


Spring is rainbow season here in the Northwest.  Why?  Lots of instability, so there are plenty of cumulus clouds and their transient showers. The showers are followed by sun, which helps produce the rainbows. Classic spring showers and sunbreaks!  A winter storm with a continuous cloud deck without breaks is no good for rainbows.

Why is it very unstable this time of the year?  Because  instability is associated with a big change in temperature with height and spring has this in spades.  The sun is strong and warms the surface, while the atmosphere aloft has not warmed appreciably yet.

There is one question about double rainbows I can't answer:  Are there two pots at both sides?  I will leave this important question to others more qualified to deal with it.


Come to think of it, maybe I can answer the question.  This is my kind of gold.  And they make it in Ellensburg!


Climate 101 Luncheon on Monday in Seattle

If any of you are interested, I will be participating in a Climate 101 luncheon sponsored by the Seattle Chamber of Commerce and mc'ed by Jeff Renner of KING TV.   There is some space left.  For more information go here.

The Highest Pressure in Ten Years

 Did you feel the pressure yesterday?    Feel a bit weighted down?    If so, it may not be due to the political energy in the air. Yesterday...