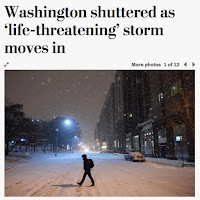
Snow is falling around Washington DC right now-- with some locations already with 6 inches on the ground. About two feet is forecast for the nation's capital, and that forecast has been in place for several days. There is little doubt they will get that much snow at this point. A very successful forecast.
And quite honestly, a relatively easy one with modern forecast technology. It turns out that the difficulty of snow forecasts are not the same....and this one had less uncertainty than many at that location. Let me show you why.
The general set up was favorable, with cold air in place and a developing low center that was large in scale and positioned sufficiently south and east to draw in cool air, while rotating moisture in aloft (see forecast map for 1 AM PST below, shading is precipitation, solid lines are sea level pressure).
A key numerical weather prediction technology today is ensembles, in which we run our models many times, while slightly different starting points or model physics. By looking at the spread of the forecasts, meteorologists can secure an idea about the uncertainty of the forecasts.
Here is the ensemble output (the plume diagram) from the National Weather Service SREF (Short-Range Ensemble Forecast) system made on Thursday at 1 AM for snow accumulation at National Airport (Washington DC) over the next few days. Time increases to the right. The colored lines are the varying forecasts. The black line is the ensemble mean (average of all the ensemble members), which tends to be better than any individual ensemble member. The lowest snow amount was about 12 inches, the mean around 22 inches, and the max roughly 36 inches (click on the image to expand if you like).
Even the driest ensemble member had a foot! There was some uncertainty but this modeling system was emphatic about a major snow event.
The National Center for Atmospheric Research has a more sophisticated and higher resolution ensemble system. Here is the ensemble mean snowfall for runs started at 4 PM Thursday for 24h accumulated snowfall ending Saturday at 4 PM PST. About 2 feet. There is a substantial snow gradient to the SE of DC, but if the positioning was off by 50 miles, there would be still be a significant event.
The forecasts at the periphery of the snow shield would be far less certain, but the DC snow forecast is much easier.
I could show you other ensemble forecast systems, but the bottom line was clear: DC was going to get hit with a big event.
Virtually all of the models available to forecasters locked on to a consistent solution by mid-week. This is not true of some storms, which are very sensitive to the initial state or model physics (e.g., cloud or precipitation processes). Midlatitude storms like this are generally more predictable that systems leaving the tropics that transition to midlatitude storms.
Which model did better for this storm, the European Center or the American GFS? 5-8 days out, the European Center was clearly superior for the runs verifying at 4 PM Friday PST. The U.S. shorter-term forecasts (few days) got the story right. This highly successful forecast shows the power of modern weather prediction, but this was an easy one. Some forecasts will still be in error, even a day or two out, when their are large sensitivities to the model initial state or physics.
This blog discusses current weather, weather prediction, climate issues, and current events
Subscribe to:
Post Comments (Atom)
California and Oregon Have Been Getting More Precipitation Than Washington: Should We Care?
When it comes to precipitation along the West Coast, there are always winners and losers. Sometimes the jet stream, the conduit of storm...

-
In act one of this meteorological drama, yesterday and this morning brought heavy rain and flooding to many sections of western Washington. ...
-
The heavy rainfall is over, but some rivers are still rising. The most impactful atmospheric river event of the past few decades. Consider...


It seems like they knew DC was going to get hit hard, but the forecasts for NY city seemed off a little bit on the low side. They ended up with almost 30" correct? A few days out I think they were predicting less than 10". Why the discrepancy there?
ReplyDeleteCan you give some light to the disputed snow levels in DC? What was forecast vs what was measured? Something about a technique of wiping the gauge down after a reading and whether or not that was done correctly. Seems pretty low tech in this age of high tech.
ReplyDeleteTim, Cliff answered your question in his post. Look at the NCAR ensemble forecast map, NYC is just on the periphery of the snow shield, so there is greater uncertainty on the forecast for NYC. The storm extended a bit farther North then the early ensemble forecasts expected (later forecasts did show NYC getting hit too), so imagine what the forecast would look like for NYC would look like if the NCAR ensemble had the snow shield 50/100 miles further north.
ReplyDelete