December 31, 2018

Fogs Engulfs Seattle

There was a stunning series of images this morning from the Space Needle panocam as inland fog pushed over Seattle.

It was clear this morning around sunrise over downtown Seattle, but a shallow fog bank loomed to the southeast (picture below for 7:30 AM).


By 8:30 AM the fog had begun to move across downtown.

And  by 10 AM the city was well covered, with only the top of the Columbia Center extending above the cloud deck.


At 11:30 AM,  the fog had begun to thin (see below)


But looking towards Queen Anne hill, one could see a wonderful example of a dramatic optical effect--a glory- centered at the top of the shadow of the Space Needle.  Note the circular array of colors caused by dispersion effects of diffraction.  Magnificent.


The fog bank also moved in at the NOAA facility near Magnuson Park in NE Seattle and the vertical sounder there showed how the temperature structure was altered by the fog bank (see plot below of temperature with height a various times).  At 1200 and 1300 UTC (4 and 5 AM PST), temperatures warmed with height in the lowest 100 meters (cyan and yellow lines).  But after the fog moved in (black, red and green lines), there was a large cool down in the lowest 300 meters (about 600 ft).   Not much change above that. 
Finally, the fog was evident in the 10:45 AM image from the new GOES-17 weather satellite (see below).  Fog extended east, north and south along the river valleys, but ended at the Sound.  A wonderful morning to hike up to the top of Cougar or Tiger Mountains and look down on the clouds below.  Great visibility aloft.  And the fog won't last...much will burn off during the next few hours.


December 30, 2018

Year in Review I: The Big Picture

With new year's coming up tomorrow night, it is appropriate to look back on the weather of the past year.

The essential take away:  2018, and particularly the late spring and summer, were much warmer than normal.
We can illustrate this with a nice graph (see below) produced by the National Weather Service for Seattle-Tacoma Airport, showing the observed temperatures (blue line), the normal range (green shading) and the records for each date (high records-red color, low records, blue color).

One is struck immediate by the many dates that were above normal, particularly from May 1 to Sept. 1).    A number of these days hit highs 10-15F above normal.    On the other hand, the annual extremes were not impressive...on day got to 94F and the lowest temperature all year was 24F, with only one cold spell in late February.

Precipitation was a very different story--the annual precipitation will end up slightly below normal (see middle graph, top of light green shows accumulated precipitation), resulting from a wetter than normal first half of the year, a dry summer, and moist late fall.

Snow in Seattle was almost absent:  about 1 inches compared to a normal total of around 6 inches.

A regional view of the differences from normal of temperature and precipitation for 2018 is shown below.   For temperature, the entire region west of the Rocky Mountains has been warmer than normal, particularly the U.S. Southwest.   Here in WA state, roughly 1-2F above normal.   But note the cooler than normal weather over the northern Plains.  That will be important.


Precipitation is more complex.  Most of the west was near normal in 2018, except from southwest WA to northern CA, where is has been quite dry.  The contrast across western WA is really substantial.

So what it the cause of the warm anomaly in the West?

Anthropogenic global warming might be making some contribution, but there is much more going on.    A hint at this comes from taking a broader perspective, looking at all of North America (see below).   This figure shows the temperature anomaly (difference from normal) for 2019.  Blue indicates colder than normal and  red/orange above normal.   The western U.S. is warm, but the middle of the country is cold, while the East Coast is warm.


This pattern was associated with an amplified upper-level wave pattern, with ridging (high pressure) over the West Coast, with troughing (lower pressure) over the central U.S..   This pattern was evident for much of the year, including our warm/dry period in November and during the late spring.

To illustrate, here is a map produced by the National Weather Service showing the average upper level (500 hpa) height anomaly in November (sorry it is blurry, the government shut-down makes it impossible for me to get better graphics).  Red indicates higher than normal heights (ridging), blue indicates troughing).  Ridging produces localized warm surface temperatures, the opposite for troughing.  Ridging also suppresses precipitation, explaining our drier than normal conditions.

There is no reason to expect that this pattern has anything to do with global warming (note:  the "lazy jet stream" hypothesis has been firmly disproved in the peer review literature). 

How much of our warm year might be due to anthropogenic global warming?   We can get some insights into this by using the wonderful Washington State Climatologist climate plotting site (with kudos to Karen Bumbaco and Nick Bond).    The annual temperature in Seattle is shown below.  A small upward trend of perhaps .5F, with human caused global warming undoubtedly contributing during the past 30 years.  Other local stations are similar.

The take away is that most of the warming this year (1-2F)  is due to the anomalous upper level pattern, which is probably the result of natural variability.  Why am I stressing this point?  Because too many people, and unfortunately some in the media, make the assumption that every warm anomaly is mainly the result of increasing CO2 in the atmosphere.   This is simply not true.

December 28, 2018

Another Windstorm Tomorrow

This is almost getting routine.   Another wind event will occur tomorrow (Saturday), but with a bit of a different meteorological twist:  no major cyclone, but a warm front passage, followed by a strong cold front.

Today, I will show you some advanced meteorological technology for wind prediction, something developed at the UW with funding from Seattle City Light and the Northwest Modeling Consortium.   
This figure shows the peak wind gust forecast over the city of Seattle predicted by the National Weather Service (green line), a super-high resolution numerical model prediction  run at the UW(red line), and a collection of high-resolution forecasts (gray lines and blue line).    Showing many forecasts (or an ensemble), each slightly different in their initialization, provides a way of estimating the uncertainly in the prediction. All these predictions were started at 4 PM Thursday.
These forecasts are the gusts (short-term wind maxima), based on a calibration from historical periods.  Virtually all the models are going for a significant wind event on Saturday, with maximum gusts over Seattle getting to 40-50 mph (most places in Seattle will experience less) between 10 AM and 4 PM.    Note how the wind continuously ramp up starting this afternoon....this is associated with a warm front passage.

The above graphic is available to the public on the Seattle City Light Windwatch page (https://atmos.washington.edu/SCL/).  WindWatch was created by my group (mainly research meteorologist Jeff Baars) with support from Seattle City Light.

The latest high-resolution (1.3 km grid spacing) run is in (below).   At 1 PM Saturday, it is windy around central Puget Sound (gusts of 35-40 knots), and if you look carefully you will notice the windshift on the NW coast associated with the cold front.

 Three hours later, the cold front has reached Hoquiam, on the central WA coast, and and strong westerly winds have pushed into the Strait of Juan de Fuca.


Considering all the stress put on trees during the past two windstorms, I would expect for less damage this time, but I am sure there will be some power outages.

To give you a better view of what is going on, here is a plot of sea level pressure (solid lines), low level temperature (colors--yellow is warm, blue is cold) and surface winds.  The situation at 4 AM this morning, shows cold air over the interior and the warm front offshore (transition from green to yellow, and significant wind shift).

 By 10 AM Saturday, warmer air had spread over Washington and Oregon, leaving us in the warm sector.    Note the large north-south pressure difference--that is what will produce strong winds.


The winds should weaken Saturday evening, with cooler and partly cloudy conditions on Sunday.
New Year's Eve should be dry!


December 26, 2018

Mountain Snowpack Update

Few measures of our weather/climate are more closely followed then our mountain snowpack, which brings us both recreation and water resources.

There are, of course, some concerns for this this winter, since we expect El Nino conditions for the second half of our cool season, with El Ninos generally associated with lower snowpack on April 1.  El Nino effects on our snowpack are most profound after January 1, so it is useful and important to know where we are now.

So let's take a look!

The latest USDA Snotel (December 25) reports shows near-normal conditions east of the Cascade crest, which is very important for water resources there.  Near normal in the Olympics and in eastern Oregon, and normal to above normal in the Sierra Nevada.  Colorado is in very good shape.  In contrast, the western slopes of the Cascades in Oregon and southwest WA are below normal (roughly 60-80%).  Overall, we are in decent shape.


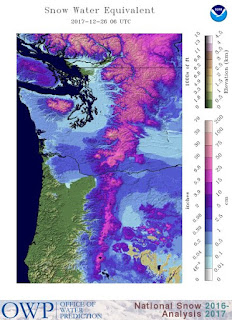
Our snowpack has come a LONG way from the low-snowpack conditions of November and early December, when high pressure was persistent (but with more sun as a result!)  I will demonstrate this  by showing you the amount of water in the snowpack (snow water equivalent or SW) from  last night at 10 PM (left panel) versus one month ago (right panel) from the NOAA National Snow Analysis (below)   Wow...big improvement!  Enough to make skiers smile.

Compared to last year (a La Nina year), our high mountain snowpack is as good or better (see last year on December 16th below), but there was unusual lower elevation snow last year (remember the White X-Mass last year)? 

What about the forecasts for the upcoming week?    For a change, lets look at the accumulated forecasts from the European Center model.  Over the next to days,  they are going for light snow in the mountains, with a low-snow level (2-8 inches in the mountains)

 But there will be MUCH more over the next week, with as much as 2-3 feet total snowfall above roughly 5000 ft.

The bottom line is that our mountain snowpack will start the El Nino season in relatively good shape .

And skiers can get out and enjoy decent conditions, particularly in places like Mt. Baker, Crystal Mt and Whistler, which have plenty to snow.

Finally, I really enjoyed reading the ski area snow reports and particularly love the enthusiasm of the Mt. Baker folks, who are barely able to contain themselves regarding the powder (POW) on their slopes.  Check out the video below.

Dec. 24 Powder & Sunshine from Amy Trowbridge on Vimeo.

December 24, 2018

Sad News: No More BLOB

A lot of folks are interested in the BLOB, the colorfully named area of warm water that periodically appears over the northeast Pacific.  And there is major BLOB news.... it is gone.  Let me describe the sad news.

Starting the autumn, the BLOB was relatively weak.  To illustrate, here is the sea surface temperature anomaly (difference from normal) for the end of October--as much as 2-3C warmer than normal!  This was associated with an area of persistent high pressure over the northeast Pacific.
But compare that situation to two days ago.  The BLOB is essentially gone, with an area of cooler than normal water developing.  Only immediately along the coast is the water temperature slightly above normal.

What killed the BLOB?   Persistent storminess over the northeast Pacific, something that is no surprise to the storm-battered residents of the Pacific Northwest. 

Here is the proof: the anomaly of the mid-tropospheric (500 hPa) heights from normal for the last 30 days.  Blue and purple indicate lower than normal heights, which is associated with more and deeper low-pressure centers, which in turn cause strong winds.  A big area of lower heights (or equivalently pressure) was found over the NE Pacific.


The BLOB forms with persistent high pressure that is associated with weaker winds.  Weak winds do not mix the upper ocean as much as strong wind, thus bringing up less cool water from below.   Persistent low pressure, with higher winds, are good at mixing, thus reducing water temperatures.  That is what has been going on lately.  There is no reason to expect that the BLOB is a sign of global warming.

So during this holiday season, your pleasure in enjoying a few day break may be tempered, at least a little bit, by a touch of sadness about the passing of our our old friend, the BLOB.  For myself, I find solace knowing that the BLOB  is sleeping, knowing that it will surely awake and return one day.

December 22, 2018

A Beautiful Storm Approaches the West Coast

The third major Pacific cyclone is now approaching the West Coast, this time heading farther north towards central British Columbia.  As a result, the wind effects will be lessened over Washington State compared to the last storm.

But forgetting about the wind and rain, there is something else about this storm:  it is beautiful in shape and structure--a gorgeous spiral of clouds and complex structures.   Let me show you.

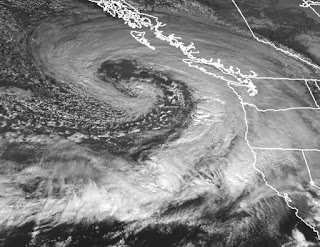
Let's start with the GOES-17 visible image around 3 PM  (below).  Huge storm, with the frontal cloud bands spiraling into the low center.    And if you look closely, the can see the mottled/speckled clouds of cold air instability spiraling into the low center.  Very nice.


But we can do better than that:  here is the view of the higher-resolution MODIS satellite around noon.  Just stunning.  The low center is in the middle of the spiraling clouds.


A closer look at the low center is found below. You can see the frontal cloud band (solid layer) and and instability clouds spiraling around on the outside.


By why stop there looking at this beautiful storm?   Here is the water vapor imagery, showing you the amount of water vapor in the upper troposphere (roughly 20,000-30,000 ft). White means a lot of water vapor, dark means little in that layer.  Cool, dry air is spiraling into the low center.  Exquisite! 


To serve as a comparison, here is the 1800 UTC (10 AM) sea level pressure and frontal analysis provided by the Weather Service;  they estimated the central pressure as 980 hPa--a strong storm, but not an equal for any of greats (like the Inauguration Day-1990 or Chanukah Eve-2006 storms).


The model wind gust forecast for 1 PM today shows two areas of strong winds, on ewith the main front, that was battering the coastal waters at that time, and the second in the region just south of the low.

 By 1 AM Sunday, the low center will be approaching landfall, just north of Vancouver Island, with the strong winds to its south.   Just some spare change for us, here in WA State.  Which is fine.


December 21, 2018

The December 20 Windstorm and the Start of Winter

Yesterday, we had another moderate windstorm over western Washington, one that had even greater effects over British Columbia.   Gusts reached 70-75 mph in "favored" locations and about 300,000 customers lost power in the region.  Even my home went dark.

The National Weather Service surface analysis for 10 AM yesterday showed a fairly deep system (978 hPa) moving northeast into Vancouver Island.


This hand analysis does not accurately show the detailed pressure structure of the storm.  A far better view comes from a short-term, and thus highly accurate, model forecast shown below (6-h prediction by the UW high-resolution WRF predictions).  The solid lines are isobars, lines of constant pressure, and you will note an intense change or gradient of these lines south and west of the low center. 
Classic for a strong marine cyclone.   Strong pressure gradients suggest strong winds.  And that area of intense pressure gradient moved across northwestern WA during the subsequent hours, producing the powerful winds.


How strong?

Gusts reaching 78 mph at Destruction Is along the central WA coast and 70 mph at Race Rocks in the Strait of Juan de Fuca.  Similar winds from a downslope mountain wave on the Olympics.    And gusts to around 50 mph for exposed locations in central Puget Sound.


But lets look at the max gusts for a far smaller area....around Seattle. Around 50 mph for exposed locations (e.g., West Point or in the center of the Evergreen Pt. floating bridge), but locations with poor exposure, bad instrument placement, or poor instruments had far less wind (less than 20 mph).


Winds are a very difficult measurement and unfortunately many wind observations are unreliable. 

Surface winds should be measured at 10 meters (about 30 feet) in open area.  Not on a house.  Not with trees nearby.  Many sensors do not have such exposure, although the official airport stations should all be reliable.  A colleague of mine, Professor Bob Fovell of University of Albany and student Alex Gallagher, just published a very nice paper showing that many cooperative wind observation networks are nearly useless of determined winds during Thomas Fire  (a Santa Ana event).

Today is the start of winter and I have some good news....no big storms in the forecast! 
No rain and partly cloudy today.   Perfect weather for cleaning up debris and doing that last minute holiday shopping.

And remember, we are in an El Nino winter and the impacts of the warm Pacific water (lesser storms, warmer temps) tends to hit after New Years.

December 19, 2018

Another windstorm will hit the Northwest on Thursday

Mother nature is throwing everything in her cupboard against us this week.   We had the first major Pacific cyclone/windstorm, lots of snow in the mountains, heavy mountain rains, a downslope windstorm event on the Olympics, and an EF1-2 tornado.   Meteorological heaven for those who like a good storm.

But the strong storms are not over yet, and Thursday will bring another strong Pacific cyclone to our coast, with strong winds and power outages for many. 

Here are the latest forecasts from the UW WRF model.  We are close enough in time that this evolution should be fairly accurate (and the spread of the ensemble is not that great now).

Let's start with the forecast sea level pressure map at 1 AM Thursday.  A 991 hPa low center is found offshore, with a strong pressure gradient (large change in pressure with distance) off the Northwest Coast.  Thus, strong coastal winds (probably gusting to 30-60 knots) would be in place over the water at that time.


The storm, moving northeast makes landfall on Vancouver Island, and is over southeast BC by 1 PM Thursday afternoon (see below).  The region of strong pressure gradient is over western WA at this time, and particularly NW WA.  Winds would be revving up over inland western WA by this time, peaking a few hours later over Puget Sound.


Let me show you high-resolution forecasts of the surface winds. At 4 AM, wind gusts will have reached 50-60 knots, along the coast, and nearly as high near Victoria and the southern San Juans.  Also note a strong Olympic mountain wave, with strong flow descending the northern slopes of the Olympics.  Deja vu all over again.


By 10 AM (18 UTC), winds rev up in Puget Sound (gusting to 30- 40 knots), with big winds remaining along the coast and San Juans.


 Then the final stage of the wind action, as the low moves by to the northeast, a strong onshore pressure gradient will develop and a westerly wind surge will occur in the Strait of Juan de Fuca (see map for 4 PM on Thursday).   If you were planning a ride on the Victoria Clipper between Seattle and Victoria tomorrow afternoon, bring plenty of Dramamine--it will be a very rough ride.


This event probably won't be more intense that last Friday's windstorm over Puget Sound, but potentially stronger over NW WA and the coast.  There is some variability in the exact landfall position, and  small error could have a big impact on the winds, so keep watching the forecasts. Make sure your batteries are fresh, your barbecue has gas, and your smarphone is charged.

December 18, 2018

Tornado Strikes Port Orchard on the Kitsap Peninsula

Tornadoes are relatively rare in Washington State, generally with 2-3 weak ones per year.   But today, something very rare occurred a midwinter tornado of moderate strength, perhaps as high as EF-2 on the Enhanced Fujita scale.

The action happened in Port Orchard, Washington, near the Walmart Supercenter (see map), shortly before 2 PM.


There was substantial damage with roofs lost and severe structural damage to 6-10 homes, and many trees downed, including entire wooded areas.

There was some great video of the tornado, showing debris ejected hundreds or thousands of feet in the air (see picture taken by Mathew Hargis)


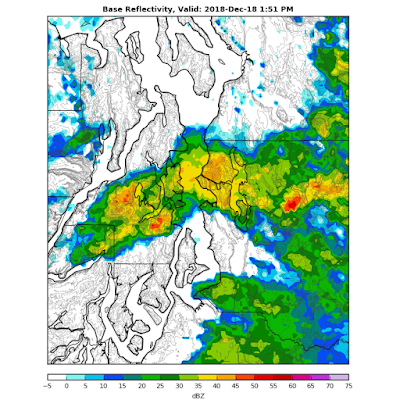
The first thing a meteorologist does in this situation is to look at the radar, and sure enough there was an area of high reflectivity (heavy precipitation) over Port Orchard at the time of the tornado (see radar image below for 1:51 PM).   Such an area would be associated with a strong thunderstorm or convective cell.  But you will note there were others at other locations that were equally as intense.
The next thing is to check is strength of the convective cell, as expressed by its height or "top" (see below).  Just 15,000 to 20,000 ft--pretty wimpy.   Folks in Oklahoma would laugh.


So why a tornado?     Well, the next thing a meteorologist would look at is the Doppler velocities, to determine whether there was local rotation--a mesocyclone.  Such rotation can be spun up into a tornado.  I checked the Doppler radar imagery:  there was a weak hint of  rotation for the lowest beam elevation angle (.5 degrees).    This is illustrated by the adjacent couplet of colors (yellow-blue) in the lowest beam level at 2132 UTC (1:32 PM), 2146 UTC (1:46 PM) and 2151 UTC (1:51 PM)-the light yellow being roughly 5 knots towards the radar, while dark blue being around 40 knots.  That difference reflect a small scale rotation.


And there was no hint of a "hooked echo" in the reflectivity (intensity).  Bottom line: this was a very weakly rotating, non-supercell thunderstorm. 

And a forecast of the amount of "juice" available for thunderstorms/convection at the time of the tornado (something called CAPE, Convective Available Potential Energy) is nothing you would write home to your mother about (unless you were a meteorologist, of course--I write my mother all the time about weather matters).   CAPE values were into the low hundreds-- fairly high for our region, but nothing impressive.


OKAY.... most of our tornadoes around here are not from supercells anyway, and tornadoes usually occur when a modest thunderstorm interactions with an environment with some horizontal shear (change of wind speed and direction with distance).  Such shear represents inherent rotation which can be "spun up" as air is ingested into a thunderstorm.

Was there much shear that day around Port Orchard around 2 PM?  A short-term, high-resolution forecast of wind speed and direction for 2 PM suggested a modest amount of velocity shear around the Port Orchard region, with weaker winds in the immediate lee (east) of the Olympics in contrast to stronger southwesterly winds coming around its southern flank.  So weak shear did exist in the lee of the Olympics.

So where are we then?

The air moving into western Washington was modestly unstable and as a result a number of convective/thunderstorm showers were moving in.  Nothing exceptional.  One of the thunderstorm cells moved into the lee of the Olympics, where some horizontal wind shear existed.  Such shear implies inherent rotation (think of placing a very large pinwheel in such an environment--it would spin).   The modest thunderstorm ingested that air and spun up the rotation in its strong updraft (not unlike a skater can speed up a rotation by drawing her arm toward her/his body).  This created the tornado.


This is not the first tornado that formed in the wind shear zone in the lee of the Olympics.   Several others have occurred during the past decades, such as one near Poulsbo in April 1991.   But a tornado this strong during the mid-cool season is very unusual.


Most tornadoes in WA state are wimpy EF-0s.  (See scale below)  But this one appears stronger, EF-1 at least, and perhaps an EF-2.

No one should criticize my colleagues at the National Weather Service for not forecasting this event earlier in the day.  It is possible that a warning might have been able to be put out a 10-15 minutes before---although is not Oklahoma where they have tornado warning infrastructure in place like sirens.  Interestingly, an amateur group (WA storm chasers), noticed the rotation and tweeted out a warning at 1:37 AM (see below):
I wonder whether the National Weather Service's automated rotation detection software picked up on the rotating storm.

Such weak tornadoes are relatively rare, since everything had to happen perfectly, with the shear and a strong storm coming together at the right time and place.


Blocking Ridge, Dry Pacific Northwest, and Southern California Rain

 Not a boring time for meteorologists.   New Orleans Airport is closed with record-breaking snow and cold, while the Pacific Northwest is st...