Well, the latest snow water map from the USDA SNOTEL network is an eye opener and a study of contrasts (see below). For the Olympics, we are now at 283% of normal, for the fire-prone Okanogan highlands of northeast Washington at 265%, and the Blue Mountains southeast of Walla Walla is around 190%. The western side of the Cascades is very close to normal. In contrast, east of the central to southern Cascades, snowpack is below normal, ranging from 58 to 35%.

One has to be careful about interpreting such snow percentiles of normal. On April 1st, the day water resource agencies like to use as a benchmark, the snowpack around the state was very close to normal. But then we had a warm spell in April and stronger than normal westerly winds that resulted in a faster-than-normal melt in some locations (such as the eastern slopes of the Cascades).
During the season of snowpack melt off, small differences can produce wacky percentages of normal, either above or below normal.
Take Waterhole, a site in the Olympic Mountains where snowpack is nearly 300% of normal today (blue is this year and red is normal for snow water equivalent or SWE). That location was above normal in March and early April and then hit the normal rapid decline in May. Right now, the amount is above normal by a huge percentage....but there is hardly any snow left (and will be gone in a few days). The huge percentage above normal is really meaningless.

Now consider a site on the eastern slopes of the central Cascade (Morse Lake), where the percentile is very low (around 20%). Again, we started out with a normal snowpack, but the warm weather caused a quicker than normal melt-off (by a week or so.) The melt-out is a few days early, but you would think the end of the world is here because of the advance of a few days.

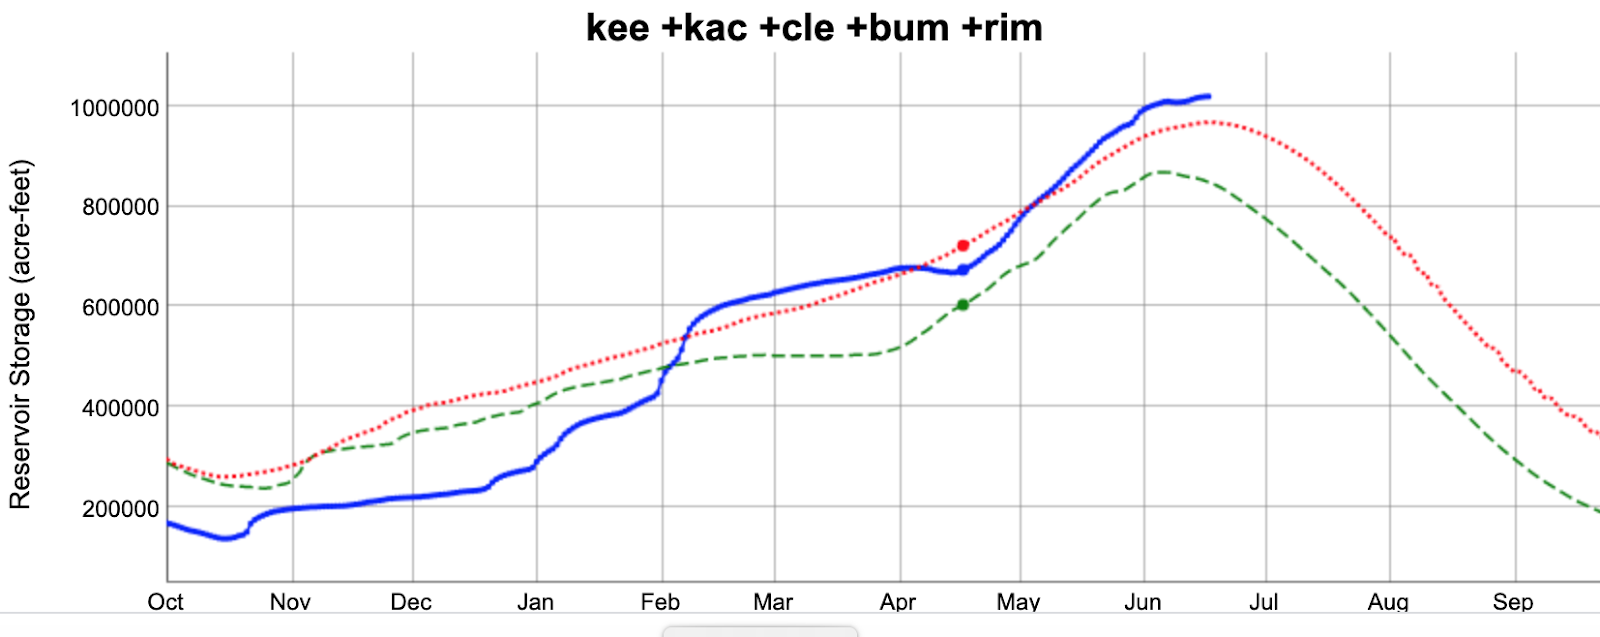
And even with an earlier melt-off, in the Yakima drainage much of the water was saved in the reservoir system, ready to aide agriculture and fish passage (see plot below). In the plot you can see the rapid rise of the stored water (blue line) in April and the fact the water level is now above normal (red line). Last year is the green line.
At Stevens Pass, the melt-off was June 5th, 3 days later than normal (which means more snow than normal) and the view today at Paradise on Mount Rainier still shows plenty of snow (see below)

The bottom line is that we need to be careful when interpreting snowpack numbers in late spring and early summer, since differences that are meaningless can produce HUGE percentile anomalies from normal. And as we go into this summer, the snowpack and water situation is quite reasonable and not far off from normal. Agriculture will have its water and one should not expect unusual wildfire activity. Something not to worry about.


Today, the temperature reached 70F for the first time this month and the first time since 5/30 at my location in NW Bellingham.
ReplyDeletePlus even if high elevation snow is high, the percentage of topography at that elevation is very low. Most if not all of the low and medium elevation snow is already gone. It's like saying "geez there's alot of snow at the top of ranier right now". Not as meaningful
ReplyDelete(Chester)Morse Lake is on the western slopes of the Cascades.It's where the south parts of Seattle and King Co.water supply comes from.
ReplyDeletefrom my observations snow (hiking, dirtbiking, snow mobiling, backcountry skiing) snow pack is very low in Mt Hood South Side of Mt Adams. I think you are drawing conclusions on an extremely sparsely sampled dataset, therefore invalid conclusion. For example I do not think we are measuring the effect of elevation on our snowpack very well. Higher elevations seem to be at near normal (colder areas), but lower elevations (warmer areas) have very little snowpack.
ReplyDeleteWe live in western Washington. My wife owns a wheat farm (dry farming) in eastern Washington. She subscribes to the Wheat Life magazine. In the June issue they stated “According to the U.S. Drought Monitor, much of central Washington is in a moderate drought situation with a swath of that region sitting squarely in a severe drought designation”. Chad Smith (Horse Heaven Hills) said “We need rain. I think it will be a bad fire season. All that is saving our butts right now is the cool weather. If it was 90 degrees, I tell you, nobody would be cutting a damn thing”.
ReplyDeleteMy wife’s farm is unseeded this season but the ground might be too dry for next year’s crop.
Interesting circumstance to me a fellow dry lander. Curious what county the wife's farm land is in. As it turns out the same county Chad Smith is in will yield some very good and very bad harvests this year. We had some beautiful rains following the article which should make the year a success.
DeleteIf you'd look at the recent outlook for Oregon, much panic and dread regarding the upcoming fire season. This doesn't jibe with a few years back when there was literally no snowpack during the winter, whereas this year the YTD precipitation and snowpack was close to normal by the end of Spring (except SE Oregon).
ReplyDeleteCliff,
ReplyDeleteWhy is it drought is always controversial in our area?
I know the state legislature defined drought at a specific level choosing a higher number than most people considered drought. I suppose they were leaving a safety margin to ensure drought wasn't a surprise as they would look into it sooner rather than later. In the recent past, that seemed to be a lot of the problem regarding peoples' drought expectations.
It would be nice to clear up the confusion regarding drought so we could move on to other topics.
Where it comes to water resources assessment (hydrology, hydrogeology), I've long since come to see that "snowpack" as just one piece of the supply puzzle. In most respects snow depth is little better than a harbinger. To begin with, snow is just a part (a fraction) of incoming water that drives the total hydraulic system – yes, even in the mountains. “We don’t get our water from snow.” Far from it. Much of the land area in the state is never fed by glaciers and “snowmelt” at all. For vast areas, aquifers are recharged by local snowfall to the extent that the ground can absorb it, plus direct rain (infiltration).
ReplyDeleteAt high elevations, through the cold winter months there’s very little melt, and yet perennial streams and rivers flow. Stop to think about “the why” of it. If the kiddie-book perception that “our water comes from snow” were true, streams and rivers would stop flowing (run dry, blink!) when it’s cold on-high. But that isn’t what happens, yet people keep thinking snowmelt drives all. Perennial streamflow is supplied by groundwater “baseflow” – think “water tables” – the wet, liquid-state water that’s accumulated in the ground over time when it rains and snow melts. Surface runoff also contributes a great deal to surface flow when it’s raining. The start-stop contribution of rain (runoff) is clearly evident on hydrographs. When it stops raining, the depth of surface flows go back to groundwater baseflow levels.
As for snowpack contribution over time, some snowmelt infiltrates into the ground year-round (in some cases, depending on soil and slope, that may be quite a bit). This is grossly under-studied because simply measuring snow depth is easy. Lazy, lazy “science” IMHO. While during the summer - when temperatures rise - snowmelt surely constitutes more to surface flow than it does the rest of the year, snowmelt is at the best of times “ephemeral”. Where it comes to water supply, water that’s in the ground – baseflow – “drives the bus.” Heck, the majority of land area in most watersheds isn't even land with mountain headwaters. The coastal areas (think Bellingham, for example) doesn’t get any of its water supply from mountain snowmelt. I've seen years tagged as "drought" because there had been little winter snow, while in reality we were being continuously drenched, real-time - "wet drought". It's T (total) precipitation - wet water, not snow - that matters most.
PS - At least near Mt. Baker, I'm seeing more unmelted snow remain over summers. Why? Nobody's studying that phenomenon. I know overnight lows have been trending down. Beyond that, frozen water doesn't flow. "Tip of the iceberg" is what snowpack looks like to me.
GlacierBake has valid points. lpazazz 2-26-2021
DeleteI live in Mason County, Mason Lake area. Our community is served by well water sourced from a large underground aquifer.
I located online,a USGS/UW study published in 1970.
This comprehensive report presents a hydrogeological history of the formation of groundwater storage. As the 1970 report states, Pacific NW geological formations arose from multiple Glacial recessions of massive Ice movements, the last ice recession dating back 14,000 years. The carving out of the Puget Sound salt water/freshwater basins, now forming our Northwest terrain, left underground storage aquifers in Mason County. Mason County well water is recharged annually from rainfall, ranging from 70 inches/yr.(Belfair) to 120 inches/yr. (Potlatch). Rainfall recharges the aquifers for water wells drilled in Mason county. The Skokomish River snow pack in SE corner of the Olympic Mountain supplies snow melt water flowing into Hood Canal, good for salmon and other aquatic species, but as GlacierBake states river flow is not a significant source for aquifer recharge.
Right. So I assume next November - when the fear-mongers are out in droves in every media outlet because we have 2" on the ground instead of 8" and we are "at 25% of snowpack!!!!" - you will write the same blog post?
ReplyDeleteIt happens every year. it will happen again next year. It's carved in stone now.
Why they publish these in June (or November) has never made sense. Oh wait, it does if they are meant to scare people. I answered my own question.