It is very unfortunate when government entities provide information that is incorrect and exaggerated.
Misinformation made worse by the willing repetition by click-hungry media.

There are few better examples of the dissemination of exaggerated and inaccurate information than the drought claims of the U.S. Drought Monitor, the combined effort of several U.S. Federal agencies.
The latest Drought Monitor graphic for Washington shows SEVERE DROUGHT over much of western Washington and southeastern Washington (see below).
And EXTREME DROUGHT over the western slopes of central and northern Cascades and extending into Bellingham.

To put it politely, this graphic is silly and totally exaggerates the situation.
To quote from the National Weather Service's official drought webpage:
a drought is a period of unusually persistent dry weather that persists long enough to cause serious problems such as crop damage and/or water supply shortages.
An EXTREME DROUGHT would be expected to have devastating impacts.
The current situation is very different. A drier than normal past year for sure, but plenty of water for nearly all needs. Few impacts. Plenty of water for human consumption.
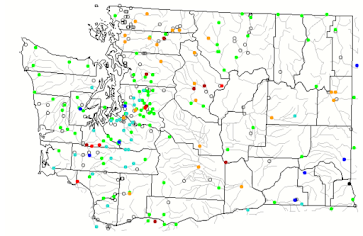
Let's explore the current situation with real data. The current streamflow is shown below. Most locations observe near-normal streamflow, including in the "Extreme Drought" area along the western slopes of the Cascades. As many above-normal streamflows as below. Looks pretty normal to me!

What about water supply? Is there a lack of water in the reservoirs for our use? Take a look at Chester Mores Lake, the main water reservoir for Seattle, over the past year. The levels are down from earlier in the summer, but similar or higher than last year in early fall. Plenty of water for human consumption.

None of the major cities in the region have any problem with sufficient water supplies for its population. For example, Tacoma's supply is green (ample):

Tacoma Washington Water Supply
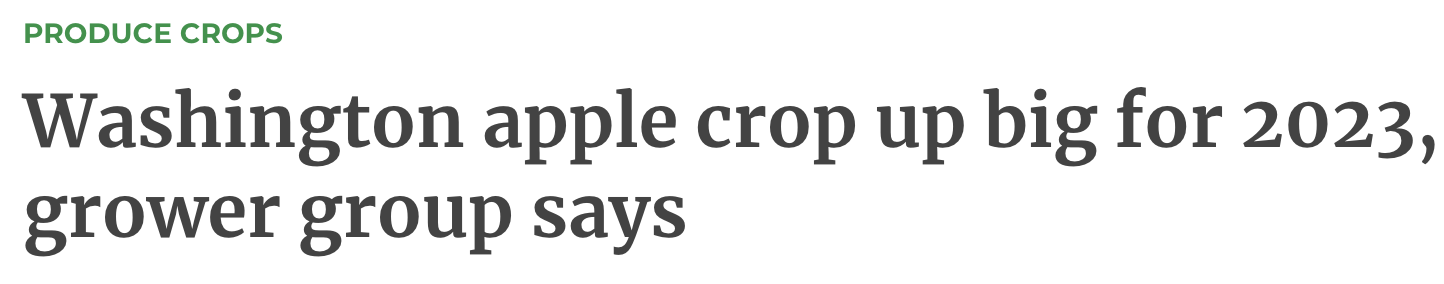
What about agriculture? With all the drought going around you would expect poor crops.
But that is not what happened.
The apple crop, the biggest of our state, is way up:

The Water Year Precipitation
To get a better idea of how serious the current water situation is, let's take a look at the historical rainfall. The water year runs from October 1 to October 1 and is perfect for examining the situation today.
Here is the plot of water year rainfall at Olympia going back to the 1940s. A green line smooths out the year-to-year variability. This year is on the low side, but certainly, many years have been lower. Little long-term trend is apparent.
.png)
.png)
.png)
.png)
Finally, the precipitation at Seattle's Tolt Reservoir was near normal historically.

Do these actual numbers suggest extreme drought?

The Bottom Line is that the last year was drier than normal in terms of total rainfall for several locations. But it was well within normal variability and there was still plenty of water for human consumption and most agriculture.
To call the situation a severe or extreme drought is simply deceptive and wrong. It is counterproductive in many ways and undercuts the confidence of citizens and local agencies. The Drought Monitor graphic is done subjectively and is a real roadblock for rational decision-making.
Let me note that there is no basis for predictions of a dry fall. September was much wetter than normal and forecasts call for bountiful precipitation (see forecast for the next two weeks from the European Center ensemble system). Looks moist to me. El Nino years CAN have wet falls.

Crying wolf has never been a good approach.


And the MSM wonders why the majority of the public refuses to be stampeded into supporting their claims anymore.
ReplyDeleteUnfortunately the narrative of long-term climate change causing short-term extreme drought in Washington state is falsely disseminated by Government agencies. This feeds into conspiracy theories and negates honest scientific inquiry into atmospheric trends and their effects on our economy and well-being. What is the data basis behind the "extreme drought" nonsense? Just because we had a few months of lower than average precipitation?
ReplyDeleteI see we here in the Sno Valley are experiencing between severe and moderate drought. We're more than a month into our annual feeding frenzy on Concord grapes, with a month to go and lots given away. A hundred chum salmon are swimming in a pool of the Raging River half a mile away, meaning the river is full enough for them to brave their way over the rocks. The ground is wet. Some people only believe what they read online, it seems, not what they see with their own eyes, and feel with their fingers and taste with their mouths.
ReplyDeleteSounds about right for government though. Hype it up and draw upon fear to get the followers to open their wallets to fund their nonsense.
ReplyDeleteWho is doling out money based on the USDA drought monitor? Followers? Are there USDA fans out there that I don't know about? And what exactly are they buying/funding based on the drought map?
DeleteOh wow, you don't know? That's too bad. Washington Ecology declared a drought emergency this summer, what do you think that does? Oh yeah frees up state funds for drought issues. YOU AND ME tax payers are paying for that. Oh, here is another example:
Deletehttps://hr.uw.edu/cfd/2023/08/04/washington-in-a-statewide-drought-advisory
Sorry you were so unaware that "emergencies" get all sorts of funding to combat them also sorry you couldn't figure out who a follower may be, maybe check into who is donated to the groups that are on that link and you can search for others.
You're clearly working off different definitions of the word drought explaining how this same article is perpetually rewritten. My confusion comes as to why you easily accept the definition of one Federal agency (NWS) but not "the combined effort of several U.S. Federal agencies.." Isn't it possible that all those agencies combined have put a little more thought into it and that there are other factors and nuance beyond a one-sentence definition? I think the answer is likely yes.
ReplyDeleteAlso isn't the Drought Monitor meant to just show you their appraisal of how things stand now? I'm just trying to understand the relevance of your close, as I didn't think they did any prognostications at all.
The problem is that they HAVE NOT put careful thought into drought monitor. It is a subjective product. Very disappointing. And very deceptive.
DeleteThanks for all you do, Cliff. Truly, crushing the fear porn narrative is key during this 'brief' period of neo-Marxism oppression, especially in the Seattle Corridor. The technocrats will fade away and/or re-spin their narrative so they aren't liable for all the damage they have done socially.
ReplyDeleteRegarding the WA apple crop - to come -
ReplyDeleteI checked a few weeks ago and believe this year is up so much because last year during blossoming the weather was not cooperating. Thus, this is more of a normal year.
A fire {Braid Springs, near Quincy} ran into a friend's vineyard and took out irrigation tubes, posts, and some vines. They will come back, being on their native roots. WSU researchers tested some of the grapes and found the highest 'smoke' readings encountered in WA. WSU has been investigating such things for all the various reasons.
Thank you so much, Professor Mass! What else can be done to get the word/science out?! So tired of the fear-mongering on everything.
ReplyDeleteI work as a manager for a Western WA reservoir. It is a challenging time to bridge between the quicker faster snowpack run-off, and the long dry summer. This is a growing trend, and I disagree that it's being overstated. Reservoirs were sized on a given a historical hydrology which data shows is changing. I don't understand the downside of warning people to reduce discretionary consumption (lawn watering) when inflows are below normal.
ReplyDeleteThe use of inaccurate terminology like "severe drought" in cases like this are deceptive and crying wolf. In the long term, it is counterproductive. The reservoirs are low...but not that low...as you know. We are going into the cool season and rainfall was well above normal in September and model forecasts (which I hope you use) showed a lot more rain. Can you tell me the value of telling people there are in a severe drought? Can you tell me the value of telling them to reduce lawn watering when that season is over and rain is falling?
DeleteAdmittedly we had a drier-than-average spring, which is probably what's got them worried. But now that it's raining, and people will not be watering much anyway, we can shut off the alarm bells. I do hope that we don't have another dry late winter/early spring, though. We had a La nina last winter, which is supposed to be wet and it wasn't. Hopefully El nino will also behave in an unusual manner (in the opposite direction) and give us a wetter-than-expected season.
DeleteRegarding: historical hydrology
DeleteI recall reading about 25 (+/- 7) years ago that it was known that hydrology data had been based on a wet period. I do not recall the specifics, nor even if any were given. The research to confirm this is beyond my skill set.
I think it’s prudent to signal that reservoirs are low, and no one has 100% prediction capability on refill. If you look through Seattle’s Water Shortage Contingency Plan, it’s been triggered 6-times since 1987, 7-including this year. That’s about 20% of years, and it’s coming as a voluntary recommendation. From the utilities perspective it seems prudent to let customers know where we are in historic context, and let them know they can do voluntary reductions. The fear is of an outlier winter which could make things get scary, and have the skeptics then say why didn’t you do more to reduce demands sooner.
DeleteAs you know journalists sensationalize, because no one would read or click on a boring headline. But I don’t think there’s anything insidious here.
Last winter was predicted as a wetter/cooler La Nina winter. However, for parts of Western Washington there was historically low precipitation for the June 2022-23 water year. This year was predicted to be an El Nino winter; are we to assume that we’ll see more precipitation than average? September had above average rainfall, but does that mean that the reservoirs recovered to an average condition? No.
Nothing insidious here? Scott, please - read the room. We all know that this is the hysterical MSM pushing a fear-based agenda to make everyone comply with the elites' plan to make us live in 15 minute cities, eat bugs, and give up electricity.
DeleteCongrats, you just played yourself - again, again and again:
Deletehttps://www.weforum.org/agenda/2022/02/how-insects-positively-impact-climate-change/
https://time.com/5942290/eat-insects-save-planet/
https://www.weforum.org/agenda/2022/03/15-minute-city-stickiness/
Do you ever actually look up anything before you post here?
You got me. Some random blog posts and articles about the potential benefits of eating less animal protein and living in dense, commutable cities are clear evidence of a conspiracy.
DeleteThe pipeline from Time magazine to new laws being passed by congress is well established; we are definitely on the cusp of being force fed bugs in FEMA managed 15 cities, which we all know are just open air prisons.
BLI had its driest water year in the 74 water years in its period of record.
ReplyDeleteThat is true. On the other hand, the water supply for Bellingham is from Lake Whatcom, which is slightly ABOVE normal levels. There is no water problem. No "severe" drought.
DeleteLake Whatcom is augmented by a diversion of water from the Middle Fork of the Nooksack which is primarily glacial melt water during this time of year.
DeleteThe soil-moisture-based metric of drought, e.g. the Keetch-Byram measure of the amount of water needed to saturate the upper eight inches of soil, maxed out in mid September in Bellingham area at a score of 800. This means that eight inches of rain would be required to saturate the upper eight inches of soil. A few comments: First, many of the September rains that hit Seattle just gave Bellingham dreary but dry weather. (Rain shadow?) Second , I can attest (from our own garden) that by mid-September the ground was extremely dry. The kind of "powder dry" I have never before seen here. Third, even after the rains through today (still generally light), the soil is powder-dry below four inches depth.
DeleteI agree with Cliff that irrigation from Lake Whatcom water is available now, but that does not help the plants and trees that do not have irrigation. And Dan McShane's point above should be pondered carefully: The main source of summer infill to Lake Whatcom will go away when glaciers are gone.
McShane: The city of Bellingham has often denied that it's still diverting water from the Middle Fork to Lake Whatcom. Where's the diversion-history data?
DeleteAgreed, Cliff.
ReplyDeleteWhat you have never really explained - or seemingly interacted with and/or described - is the inputs and assumptions of the USDA drought model. You do this very well with meteorological models. But for the drought monitor, what data is included? What is the source of this data? How do we calibrate these models? No. There is no educational value by suggesting the verbiage is bad so the analysis is bad despite the underlying data being valid.
ReplyDeleteI'd be much more inclined to take this post seriously if you were to describe the data input to the drought model. This is a multi-discipline assessment and reducing it to comparing the snow pack 6 months ago, the rain falling outside your door, and the apple harvest, is a joke.
The drought monitor is not longitudinal. It builds week by week. The rain started what, two weeks ago? Much of that in large flash events which discharges as runoff primarily. I'm not sure you are interacting with the data in a serious manner. It is more than the simple measure of precipitation in a graduated cylinder.
The problem is that the drought monitor graphic is SUBJECTIVE. There is no simple quantitative formula. It is not rigorous. Don't believe me....go to their website and you will see this is true....cliff
DeleteThe Palmer Drought Index, which I believe is objective, showed drought steadily increasing over western Washington through this past summer, reaching the severe to extreme drought stage about mid September, then showing a decrease in the index during the last half of the month, but with western Washington still in the category of severe drought at end of September. We would need another wet period to continue to reduce the drought index and this may be coming up.
Deletewxman...you are not correct. The Puget Sound region shows no anomaly on the Palmer Drought index...the same is true of eastern Washington. Please check the charts again..cliff
DeleteThis is what I see on the Palmer Drought index, Extreme Drought for September improving last week of September.
DeleteMichael...the Palmer Index from NOAA (based on division data) is here
Deletehttps://www.cpc.ncep.noaa.gov/products/analysis_monitoring/regional_monitoring/palmer.gif
PS: the naming (eg "severe drought) is entirely subjective and quite honestly doesn't make much sense...cliff
Looking at the Palmer drought map on the site you suggested still shows most of western Washington in moderate to severe drought status. That may not match what the actual conditions are but it is an objective measure. You can call the Palmer naming of "moderate" or "severe" subjective, but any classification you want to assign to it would also be subjective, unless you have some other objective measure of drought.
Deletethe numbers of the Palmer Index is objective since depends on temperature and precipitation. But calling it severe or extreme is TOTALLY subjective. And clearly it does not match reality, with locations of EXTREME drought with plenty of water of human consumption and for maintaining river levels.
DeleteCliff, your putting hope In a model that shows wetter weather so what, models can be wrong the point is that the drought monitor is reflecting the current situation. And what happens in the the future is irrelevant.
ReplyDeleteTim..you miss my point... the drought monitor DOES NOT reflect the current situation. There is no severe or extreme drought occurring here.
DeleteCliff correct me if I am way off base. I will take a stab at explaining why subjective.
ReplyDeleteTake all the historical data of precip, ground moisture and other data sets, come up with and average. Now take said data and let's break it down to shorter timeline. Let's go extreme, pick today Oct 5th. And let's compare. Picking out numbers at random let's say on average today on average you get .10 rain. Let's make an arbitrary scale to compare. Rainfall less .07, .05, .03, .01 correlates to the drought index. If you get no rain today and the moisture of the ground is drier then you will be in exceptional drought. Well we know no one would buy into a 1 day comparison, but comparing it to a 3 month time period isn't any better. We have a radio telescope here because we have "300 days of sunshine on average" which means long stretches of time without rain. We are 110% of average of precip for the year, but for the current measure of time the USDA has us abnormally dry. That's why it is subjective You can't just look at current, you have to look at trends to get accurate read.
Also looking to future is irrelevant? Than why the fuss on climate change. Can't have both ways my friend.
I've been observing weather here near Mt Baker as it relates to water supply and the environs for almost fifty years, and while - yes - this year and last year are "below average" in many respects, there has been no real evidence of "severe drought" in that most vegetation has remained alive - and even some local crops have benefitted greatly. Extreme wet conditions can take as much of a toll on vegetation and wildlife as dry conditions. There were many reports for months about "bumper crops" of apples, pears, grapes, and also wild blueberries, mushrooms, etc.
ReplyDeleteAs-for the drought monitor - "soil moisture" and any number of other factors aren't considered. Comparing one week to another, or even one year to another, can be completely misleading. Time and again, the "monitor" has failed to represent actual conditions and I have virtually no respect for the thing (or how it's used). This opinion is based on years - decades - of objective observation.
Thank you for calling out the lying media and govt.
ReplyDelete