March 30, 2025

April 1 Water Status

On April 1, water managers and others often appraise the water situation as the wet season ends and the dry West Coast dry season approaches.

So a day early, let's get a look.

For the water year (since October 1), the Western U.S. has been a mixed bag, which is not unusual.  Eastern Washington, most of Oregon, and northern California were considerably wetter than normal (see percentage of normal precipitation below).  Western Washington and central California were modestly drier than normal, while southern California and Nevada were much drier than normal.


With most of the large reservoirs in northern CA and last year being wet statewide, most CA reservoirs are in very good shape with lots of water (see below).


Looking at river levels, which reflect precipitation during the past weeks, many rivers are running above normal in Washington, Oregon, and northern California, and near normal in most of the rest of California.  Good for fish.


Snowpack?   Well above normal in most of Oregon and northern CA, near normal in southern WA state, and modestly below normal over northern WA and central CA (see below).


Here in WA State, the westside reservoirs are near normal.  But the really good news is that the Yakima Basin storage, which was much below normal, appears to be rapidly recovering.


Bottom Line

I wish I could provide you with a dramatic story, but the wet reality of this winter is quite normal and typical, with some places being a bit wetter and drier than normal. 

Looking forward in time, the European Center seasonal prediction for March-May is wetter than normal over western British Columbia, Washington, Oregon, and northern California, with drier conditions over the Southwest (the map below shows the difference from normal).


March 28, 2025

The Predicted Severe Storms Never Occurred. Why?

Several of you have asked for an in-depth look at the forecast failure on Wednesday night.  The prediction of severe convective weather that never verified. 

This blog will talk about this issue in more depth and note what I think was the real problem:  over-reliance on models and the lack of forecast updates by the National Weather Service.


First, the good news. 
  

Weather prediction models skillfully predicted the passage of a line of thunderstorms on Wednesday evening several days in advance.  

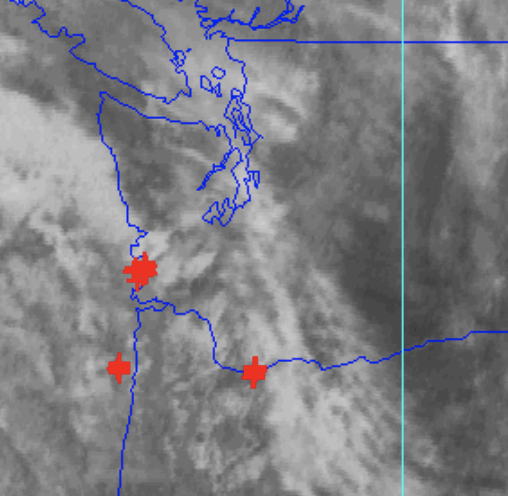
To illustrate, the figure below shows the observed radar imagery at 7 PM Wednesday (left panel, yellows and reds indicate the heaviest precipitation), while the right panel presents the predicted radar at the same time (from a 26 hr model forecast).

Really not bad....the model overdid things a bit, but the general pattern....a line of strong storms moving northwards--was forecast over a day in advance.

We knew it would rain.  That thunderstorms with lightning would move through that evening.

30 years ago, we could not have done this with any skill.  Real progress.

The Severe Weather Forecast That Did Not Verify

Weather models were predicting extreme values of key convective parameters, such as CAPE (Convective Available Potential Energy), a measure of how much energy would be available to drive thunderstorms.  

Predicted values exceeded all-time observed records for this season...which alone should have raised some suspicions.  The Northwest is not Oklahoma and there are huge complexities forced by terrain and land-water contracts.  Complexities that are often poorly handled by NOAA's and other models--such as the inability to maintain shallow cool air near the surface.

Storm Prediction Center graphics indicated that the severe thunderstorm threat would cover a very broad area (see map below):  much larger in area than even the extreme model projections.

To prove this to you, consider the HRRR model 34-h forecast of CAPE (again instability) for 3 PM Wednesday.   The most extreme values were only along the western slopes of the Cascades, with MUCH less threat near Puget Sound.  Most of the region would never get extreme thunderstorms.


In contrast, the NOAA Storm Prediction Center graphic shows major threats extending over a much broader area.  Not good.


This error was repeated in the Seattle NWS Office for tornado and severe winds outlooks.


An Even More Serious Problem

Human forecasters should really earn their pay by continuously monitoring the fidelity of the model forecasts and letting the public know when the forecasts are failing....and what they think will really happen.

By early afternoon on Wednesday, it was clear that model forecasts were going seriously wrong and that the chances of severe convection over western Washington were essentially nil.

For example, the instability forcing thunderstorms is driven by low-level warm temperatures, which help produce a large change in temperature with height.

But it was clear that cool air was holding and that predicted surface temperatures were much cooler than expected.  

Want the proof?  Here are the model-predicted temperatures and actual temperatures  (orange dots) from the state-of-the-art UW forecast system prediction started the morning of the previous day.  The NOAA models did the same thing.

The observed temperatures were MUCH cooler than the forecasts.  Fatal for the thunderstorm forecasts.


But the problems were worse than that!   Easterly winds were developing aloft, with sinking and warming air above the cool low-level air.   This situation was being observed in real time by aircraft coming in and out of Seattle and Portland.

The aircraft vertical profile at 3 PM is shown below.  The red line is temperature, and the Y-axis is height.  

A strong low-level inversion existed with temperature warming with height....this is fatal for severe convection.


Any reasonably trained meteorologist should have recognized that the severe weather threat was toast, and this message needed to get to the public and the media, who had been headlining the threat of tornadoes, hail, and powerful winds.

I was not a little disappointed that the Seattle NWS office did not realize what was going on and did not put out a message about the threat being over.    

When it became clear that they were not doing so, I decided to put out a blog about it.  

The amateur weather sites, who so hyped the threat on YouTube and BlueSky/X, did not pull back either. 

The Seattle NWS got a lot of complaints on their social media and put out a graphic "explanation" of the failure (see below).  Not satisfactory.


Bottom Line

Weather prediction has gotten immensely more skillful during the past decades.   But as good as models have become, they still have failure modes, and this event played to them (e.g. over over-mixing of shallow cool air,  complex orographic effects, and more).  

Experienced human forecasters are still needed to catch model failures and to make necessary adjustments to ensure the public is not underwarned or overwarned.

Clearly, the NWS could have done much better in this case and I think a serious review is in order.


March 26, 2025

Thunderstorms Have A Cold Problem

 Severe thunderstorms were forecast for tonight....but they won't be as severe as some have predicted.

Why?   Because cool air has held in at low levels.

Take a look at the vertical profile of temperature at SeaTac Airport at 4 PM based on aircraft landing and taking off. 

Cool air in the low 60s at the surface and warmer temperatures aloft (the dots are the temperatures).  This is not good for severe thunderstorms, which like temperatures warm at the surface with rapid cooling in the vertical.

The latest NOAA HRRR forecasts are recognizing the "cold problem" and are backing off the strong thunderstorms.  This is illustrated by the forecast of simulated radar reflectivity for 9 PM, which shows a weakened and delayed line of showers.


The forecast for 11 PM is essentially the same story (see below).  Some showers, gusty winds, and lightning, but no severe weather


The 6 PM radar image shows showers to the south, with some being strong (red). Note that the strong ones are heading to the western Cascade slopes.


The 5 PM lightning strikes in the incoming band is unimpressive:


Cold air holding in at low levels is a persistent model problem, and one reason I tried to dampen some of the excess enthusiasm for this event.


March 25, 2025

Are Tornadoes and Severe Thunderstorms Coming to the Northwest on Wednesday?

I have gotten nearly two dozen emails about it.  The media are calling.  The amateur websites are going crazy. 

All have heard rumors of the potential for severe thunderstorms tomorrow in the Northwest.   How much is truth and how much is hype?    This blog will examine the situation

The NOAA Storm Prediction Center in Norman, OK is responsible for putting out official severe convection/thunderstorm storm warnings for the US.  Their severe storm warmings for tomorrow (Wednesday) predict the main action over the Northwest, which is unusual (but not unprecedented).


They have a 15% chance of hail in the Willamette Valley and SW Washington.


And a 2% chance of tornadoes.   Needless to say we are not twister country.  But there are typically a few weak tornadoes each year over the region.  One even damaged Bill Gates old home in Seattle.


One of key reasons folks are getting so excited is because of the great instability predicted tomorrow, with large instability promoting thunderstorms (also called convection)

The most familiar measure of the potential for vertical instability is called CAPE, Convective Available Potential Energy.    Drop such terms at a party and folks will be impressed.😀

Around here, meteorologists get excited when CAPE gets into the low hundreds.  Tomorrow, it will exceed 1000 in some locations.   For some perspective, in tornado-alley areas in the midwest, values can rise to 3000-4500.

Here is the NOAA HRRR model forecast for CAPE for tomorrow at 3 PM.  Huge values (yellow and red colors), mainly near the western slopes of the Cascades. Wow.


To release this CAPE, you need some uplift get the convection going.  In this case, it will be supplied by a weak trough of low pressure moving up the coast (the situation at 500-hPa, 18,000 ft)  around 8 PM is shown below.

My group at the UW runs the highest-resolution forecast model in the region and strong thunderstorms are exactly where it shines.  Let me show you a sequence of simulated satellite images based on the latest forecasts.  You will see the development of some potent thunderstorms!

By 5 PM, thunderstorms are breaking out (the white blobs are the upper cloud shields of the storms)

At 8 PM, thunder and rain will spread into NW Washington and thunderstorms will be revving up east of the Cascades.


And by 11 PM, boomers will over widespread over eastern Washington


Expect localized heavy rain and gusty winds. And there will be lightning.  

This event will not be unprecedented so I hope the hypesters will keep things realistic.


March 24, 2025

Super Rain Shadow

There is a lot of attention given to the heavy precipitation that falls on the windward side of Northwest mountains.  But perhaps the most remarkable aspects of Northwest meteorology is not where it is raining but where it is not.

Our region is also the land of rain shadows....some of the most profound in the world.

Most are aware of the classic climatological rain shadows of our region:  northeast of the Olympics and east of the Cascades (see below).  This is why folks retire to Sequim and Port Townsend--Los Angeles rainfall in the Northwest!

But during the past few days, one of the most dramatic rain shadows in memory has occurred in a different location than normal:  over central Puget Sound.

This blog will describe and explain why.

Consider the accumulated rainfall over the past 48 hours (ending 6 AM this morning) shown below.

Over 5 inches over the windward (western) side of the Olympics, but only 0.01 inches over Puget Sound.


You read that right.  Over FIVE HUNDRED TIMES more precipitation on one side versus the other.  Mama Mia....that a world-class rain shadow.   

The Cascades were almost as impressive.   Roughly 5 inches on the western side and 0.01 inch on the other.

The weather radar images have been stunning in showing the profound rain shadow effect (see below for a few samples).


You could even see a rain shadow "cloud hole" in the visible satellite image from yesterday afternoon....some luck folks around the Hood Canal were able to see the sun, while rain was falling around them.


Why did the rain shadow move over central Puget Sound?  And why was it so strong?

Rain shadow location and strength are dependent on the wind speed and direction of the air approaching  the associated mountain barrier.

As air approaches a  barrier it rises, resulting in enhanced precipitation.   As it sinks on the downstream (leeward) side it dries out, producing a rain shadow.


For most of the winter, moist air approachies the Olympics is from the southwest, producing a rain shadow to the northeast of the barrier.  Thus, the most significant drying is around Sequim and Port Angeles.

But yesterday, the winds approaching the barrier were not only strong, but coming almost directly out of the west, thus producing an intense rain shadow nearly due east of the Olympics. 

It illustrate, here are the winds around 5000 ft during mid-day Sunday (the barbs show wind direction and speed...almost 50 kt at the level).   Strong westerly winds hitting the Olympic crests and then descending over Puget Sound.


Enjoy the weather contrasts....it is why meteorologists love this region.


March 22, 2025

Dealing with Turbulence on Flights

I have received several emails from folks asking about the meteorology of aircraft turbulence and how to avoid it if possible.   Where is the best place to get aviation turbulence forecasts?   

I don't claim to be an expert in this area, but let me give you some meteorological insights and practical advice.  Any pilots who read this can chime in.

Which Aircraft Should You Fly?

 Not all aircraft handle turbulence equally.   Bigger, heavier aircraft (like the Boeing 747, Airbus 380) don't bounce around as much.  Something called wing loading, the ratio of the weight of the aircraft to the wing area, has a large impact, with larger wing loading reducing turbulence.  Big, heavy aircraft have large wing loading, but so do some newer planes like the Airbus A320neo,

Some aircraft, like the Boeing 787 and the Airbus A320neo, have active systems that modulate control surfaces to reduce the bumps. 

So if you dislike turbulence  and can choose your aircraft, pick aircraft such as the Boeing 787 or Airbus A320neo if you can.

Where should you sit?

Generally, it is best to be over the wings, while the back of the aircraft is the worst. Over the wings you are near the aircraft's center of gravity and there is less lateral motion

When Should You Fly?

In general, the earlier the better.

Heating of the ground produces surface-based turbulence than can cause light to moderate turbulence in the lowest few thousand feet.  This is particularly noticeable when landing in arid regions during the summer.

Cumlus convection and thunderstorms are even more important and are often driven by surface heating.  Thus, there are much more of a problem latter in the day.


Aircraft Turbulence Apps

If you want to prepare yourself before flying, the are several free apps that allows you to view forecasts of aircraft turbulence.     

Most of these apps use the turbulence predictions made by the NOAA Aviation Weather Center--another reason why NOAA is important. 

 They start with NOAA global model predictions and then calculate parameters related to aviation turbulence, such as vertical wind shear.   A key forecast parameter related to turbulence aloft is called Turbulence Forecast Potential, with an example shown below from the website of turbulenceforecast.com).


A very easy to use aviation turbulence site in call Turbli.com.    You tell them what flight your are on and they provide a predicted timeline of turbulence on your flight (see below).


How good are these forecasts?   I have used them dozens of times and have examined some of their verification statistics.

They are useful, but far from perfect.  Why?

First, the NOAA global model model forecasts are imperfect, and yes, it is rated the fourth best in the world.  

Second, the resolution (13-km grid spacing) is too coarse to get fine-scale features and it does not do well with thunderstorms.

Third, the connection between predicted weather and turbulence is imperfect.

Fourth, the route (both horizontally and vertically) taken by aircraft are often different than assumed in the projections.

So consider it useful guidance.  

Finally, if you are interested in seeing where turblulence is being observed at a time, you can view pilot reports (call pireps), which are available in text or plotted on a map (see below).    


I find pireps very useful for research.  For example, I am doing an extensive examination of the meteorology of the LA wildfire and the severe turbulence reports suggest intense mountain wave activity.


March 20, 2025

Drought-Buster Storms This Week

 The latest U.S. Drought Monitor graphic suggests that the only area with drought over the Northwest is on the western side of the Washington Cascades (see below).

Whether the term drought is appropriate can be debated.   For example, reservoir levels for Seattle, located in the moderate drought area, are near normal (see below)


And most westside rivers are near normal (green colors below).

But whether you think we are in a drought right now, we won't be in a week, as a series of storms and a potent atmospheric river will hit our region.


Consider the forecast accumulated precipitation through next Tuesday at 5 AM (below). 

Clearly, divine intervention.

Huge amounts in the mountains, with the greatest precipitation where the Drought Monitor suggested that drought is occurring.  We are talking up to TEN INCHES of liquid water at the highest elevations (see below). 


Much of the precipitation will occur over the weekend as a potent atmospheric river moves into our region from the southwest.  To illustrate, the graphic below shows you the amount moisture transport at 5 PM Sunday, with the red and white colors indicating a massive horizontal movement of moisture into our region.

No wonder there will be a deluge in the mountains as massive amounts of warm air are forced to rise on the terrain.


The strong southwesterly flow associated with the atmospheric river will move warm,  moist subtropical air into our region, resulting in temperatures at SEATAC surging into the 60s from Monday through Wednesday (see below).   

It will feel like spring.  And yes, spring began early this morning.  The atmosphere must be watching the calendar.


But rain will return later next week.   

Rivers will surge higher.  For example, the Snoqualmie River will go from below-normal levels right now to well above normal flows, even breaking some daily records on March 28.

As I have stated before, heavy rain or snow in late March and early April is golden....far more valuable than earlier in the season.  The water is all retained (no flooding worries), the ground is moistened before the dry summer, and the snowpack is topped off.


The Day of No Weather and SuperBlue Skies

When I get up in the morning, one of the first things I do is check the latest satellite image. Today's imagery (below) was stunning: no...