The temperature of the coastal ocean is so important for Northwest meteorology that I like to keep a close watch on it.
So let's see what is going on right now.
Below is the difference from normal of surface ocean temperatures (the anomaly from climatology in weatherspeak). Much of the NW coast is cooler than normal (blue colors), particularly south of the capes.

Here are the actual sea surface temperatures (not anomalies),at much higher spatial resolution. Several; areas near the coast are as cool as 9°C (48°F), with an even cooler water south of Point Blanco, on the Oregon Coast.

When winds are northerly (from the north) along the Northwest coast, coastal upwelling of ocean water occurs. As shown by the attached figure, such upwelling brings colder water from below up to the surface.

This upwelling is enhanced south of Cape Blanco when there are northerly winds, for reasons I can review in a future blog.
To get upwelling along the West Coast, one needs northerly coastal winds....and such winds are associated with high pressure offshore (see schematic map below).
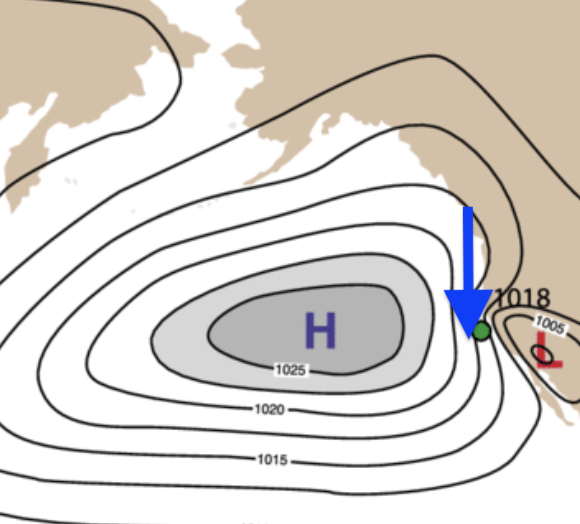
During the past month, the Pacific sea level pressure has been stronger and farther north than usual, as indicated by the sea level pressure anomaly map (difference from normal, with red indicating above normal pressures).


This has resulted in stronger northerly winds than normal and greater upwelling of cold water from the ocean depths. The high pressure offshore has also resulted in drier-than-normal conditions over our region.


Can anything be read into this for summer weather, or return (or not) of the Blob of warm water in the pacific that ruins our winters?
ReplyDeleteThe temperature anomaly map is larger scale/lower resolution compared to the SST map but the SST map shows rather chilly water in the Strait of Juan de Fuca and northern inland waters. What effect on our weather does this have compared to the cooler upwelling water along the Pacific coast?
ReplyDeleteIt also appears that there is a sharp contrast in SSTs through the Strait of Georgia, with substantially colder temperatures along the northeast coast of Vancouver Island and an area of warmer water southward until the confluence with the Strait of Juan de Fuca. Thus, the Georgia Basin is appears to be a study in contrasts. What mechanisms are at play here and what of what significance are they to our weather?
The Strait of Georgia south of Campbell River and north of roughly Salt Spring Island gets very warm during the summer. August SSTs can be 70 or above in areas. On long sandy beaches around Parksville (mid-Vancouver Island) the shallow waters of course get even warmer, can feel like a bathtub at times. It's fascinating how it's so different from further south and north, I assume because of less upwelling. Must affect summer overnight low temperatures too.
DeleteThis post made me think of your post "April is the Month of Drying" on 4/7 in which you should how the progression of mean sea level pressure anomalies is related to the change in precipitation regime of the PNW as we move from the wet season into the dry season.
ReplyDeleteDo you have models at your disposal that can predict how this area of anomalously high pressure located anomalously far to the north will evolve and how that progression might affect our weather as we transition into our dry season?
Washington never creases to amaze me with its weirdness. The subject being water temperature, I noted long ago with puzzlement that Hood canal actually gets swimmable in midsummer- the only part of the Sound that gets surface temps in the 70's. But Henderson Bay, where I used to sail in my late teens, does not warm up that much- even though it is at least as remote from the ocean.
ReplyDeleteOf course, this cool water eventually leads to June gloom. What's interesting to me is when there's periods of time where the water right off parts of California's coast is actually cooler than the water off Washington's. As far as I know, there's no such occurrence along the east coast. The gulf stream pumps up a stream of water that consistently cools as it travels up the coastline.
ReplyDeleteSounds like a formula for reduced rain and increased chance of the "drought" getting worse.
ReplyDeleteNow that precipitation has come to end for the 2024-2025 wet season in Bellingham, it’s time to tally up the total October-April precipitation at my location: 28.84”; just a bit more than last year’s wet season total of 28.08” and far more than the wet season of the historically dry 2023-2024 water year at a paltry 21.71”.
ReplyDeleteThe normal wet season precipitation at KBLI, ~2mi north of my location, is 26.85” and ~29” of precipitation has been measured there, pending the addition of this morning’s accumulation.
Correction: the historically dry season was that of 2022-2023.
ReplyDeleteI find this a most-fascinating post! A number of thoughts crossed my mind as I read it - call them "puzzlements" (if not questions). In respect to the first image that illustrate(s) climatological 'normals,' I can't help but wonder how many years (decades) of tangible measurements contributed to what's considered "that normal." My understanding is that while there's a far denser network of ocean temperature instrumentation (and data) now than there was (say) fifty years ago or more. The Pacific is immense, and it has all sorts of currents. I do not know (but wonder) about the placement of instruments (during 50+ years+) in respect to the Pacific currents. I don't know if "pineapple express" events are outliers averaged-in...and so forth. And I've often pondered how and if "Pacific currents" are driven by tide mechanics (is the Moon's influence something of a constant driver, pulling water that creates a slow-motion 'wave in itself'?). And I've wondered about the (very active) geothermal influence of the "Pacific ring of fire." Too many puzzlements, too little knowledge and computing power in my head - but when it comes to ocean temps' affect on wind and weather, I do ponder 'what drives it all.'
ReplyDeleteThat said, maybe your circuit will lead you to give a talk in the NW-most corner of the NW one of these days/years. I'd definitely like to attend a workshop or 'talk' if one were held in Bellingham-dash-Whatcom.
Really interesting breakdown, Dr. Mass. I always enjoy how you connect ocean temperature shifts with broader weather patterns across the Northwest. The explanation about coastal upwelling and the role of northerly winds makes a lot of sense — it’s fascinating how even subtle changes in sea surface temperatures can ripple into regional climate effects. Living far from the coast, I often forget how dependent local weather systems are on ocean behavior. It reminds me how interconnected everything in nature truly is. Even here in Alkaline Water Las Vegas, where desert conditions dominate, we see how temperature and moisture patterns elsewhere can subtly influence air quality and seasonal changes. Your post is a great reminder of how important it is to keep an eye on the world’s “natural thermometers” like the Pacific coast.
ReplyDelete