April 19, 2015

Siberian Smoke Reaches the Northwest

Few things communicate the environmental interdependence of our planet better that the movement of Asian pollution across the huge Pacific Ocean and its impacts here in North America.

And we have had a good demonstration of this long-range transport during the past few days, as smoke from huge fires over southern Siberia  have wafted across the North Pacific, producing hazy skies and enhanced sunsets/sunrises over the U.S. West Coast and western Canada.

We don't think about it very much, but the air we breath in Seattle today was over Asia 3-7 days ago.

Yesterday morning , I was walking with a friend along the Sound and the reduced visibility of Rainier and other features was striking.   An image from the UW web cam yesterday afternoon illustrates this.  Sunrises and sunsets have been accentuated with enhanced red colors--a good sign of smoke.

Western Asia has been an environmental problem zone the past week.   The initiator of the problems was a strong low center that moved eastward over Siberia, producing strong winds over the region (see weather map with sea level pressure and 5000 ft  above sea level wind speeds  for 1200 UTC April 15th).  The colors show wind speed and greens are winds about 40 knots.


Some farmers in Siberia prepare their fields by burning debris from the previous year and unfortunately the winds caused the fires to burn out of control, causing a massive conflagration that has killed at least 30 people, destroyed thousands of homes, and created a huge smoke plume.


The same strong winds have picked up dust and sand in Mongolia and northern China, resulting in one of the worst dust /sand storms around Beijing in years.


NASA satellites have documented both the fires and the smoke/dust rising up over Asia and have tracked it crossing the Pacific.   This image from April 14th shows the fires and if you look closely you will see the smoke plumes (greyish shading in contrast to the clouds, which are more white).


Here are a sequence of NASA images showing clouds and the smoke (colored), starting over Asia and moving our way.  You can see the substantial value of NASA satellites that observe our atmosphere at many wavelengths, showing everything from clouds and precipitation particles to aerosols and pollution.


Not convinced of the Asian origin of our air the last few days?   Well, to confirm the above hypothesis I ran an air trajectory model (NOAA Hysplit) to see where the air over us come from.
Specifically, I found the origin of the air at 11 AM Saturday ending over Seattle at three levels: 1000, 2000, and 3000 meters above sea level (shown by red, blue, and green lines in the figure).  Our air came from Asia, with the air ending at 3000 meters above us (roughly 10,000 ft) starting OVER SOUTHERN SIBERIA.


Air quality data at the surface over our region has shown little impact, suggesting most of the Asian smoke has stayed aloft.


April 17, 2015

The Meteorology of the Solar Power Revolution

There is a quiet revolution in energy production that will change the lives of many:  the solar energy revolution.

With the cost of photovoltaic solar systems dropping rapidly, there has been a rapid expansion of solar power installations, both commercial and residential, around the U.S., with particularly rapid growth in California.

Consider the geographical distribution of the resource:  where are the best locations in the U.S. for solar power?

By considering both solar angle, cloudiness, and other factors,  NREL (National Renewable Energy Lab) has produced solar energy resource maps for the U.S.   Here is the annual average values (per day in kilowatt hours per square meter).   The southwest U.S. is the Saudi Arabia of solar energy, with the highest values stretching from western Texas to California.    It is really better than Saudi Arabia, since there is huge population hungry for energy  in the Southwest (e.g., Los Angeles, San Diego, Las Vegas, Phoenix, Tucson, etc.)  Lots of sun during the day, exactly when folks need it for air conditioning and their daily lives.
There are, of course, two main factors than produce this geographical distribution.  First, annual solar radiation increases towards the equator.  But more importantly there is the distribution of cloudiness with the desert SW have less clouds (see map)

For us here in the Northwest, there is substantial solar energy potential over eastern Washington and Oregon.  This is particularly true during the summer months when our region enjoys clear skies and LONG summer days.  To illustrate, here is the solar resource for July.  The Columbia Basin is world class, as good as California.

There is a factor that enhances the NW solar energy potential, making up a bit for the fact we are relatively far north:  our temperatures.    It turns out the photovoltaic cells are sensitive to temperature, with efficiency greater at COOLER temperatures.    Thus, high temperatures in the

desert southwest works against solar cell efficiency.  But cooler temperatures makes our solar panels more efficient, partially leveling the playing field for us a bit.

The amount of solar energy being produced today is far greater than many people think, particularly in California, the U.S. state with the most installed solar units.  Here is a plot of the renewable energy output for California yesterday (April 16, 2015).  Solar energy is the dominant source of renewable energy during the daytime hours.


But here is the amazing thing.  The next plot shows total energy production yesterday in CA from all sources.  Renewables (mainly solar) are roughly 25% of the total energy production during the day--and this does not include solar production at individual homes!


But what about here in cloudy Seattle?   It turns out that solar energy from photovoltaics can make sense for local residents, particularly with all the Federal, State, and local subsidies.   One of the faculty members in my department installed a solar system two years ago.  He finds that for the sunny six months of the year be pays nothing for electricity AND produces enough juice to charge his Chevy Volt for all his local driving.  His estimated payback period is 7 years.   Even without subsidies his solar array would make financial sense.  Electric cars are a perfect adjunct to solar energy, allowing excessive power to be stored in the car's batteries for transportation and other uses. Warm climates like the U.S. Southwest are also good since energy demand (for air conditioning) is closely related to solar output.

The U.S. is hardly tapping it potential for solar energy, and with supportive policies U.S. solar generation could easily be 10 times larger than today in ten years, supplying 10-15% of all U.S. electricity demand, and much more in the solar rich regions like the southwest U.S.  These are conservative numbers--I bet we could do much better.

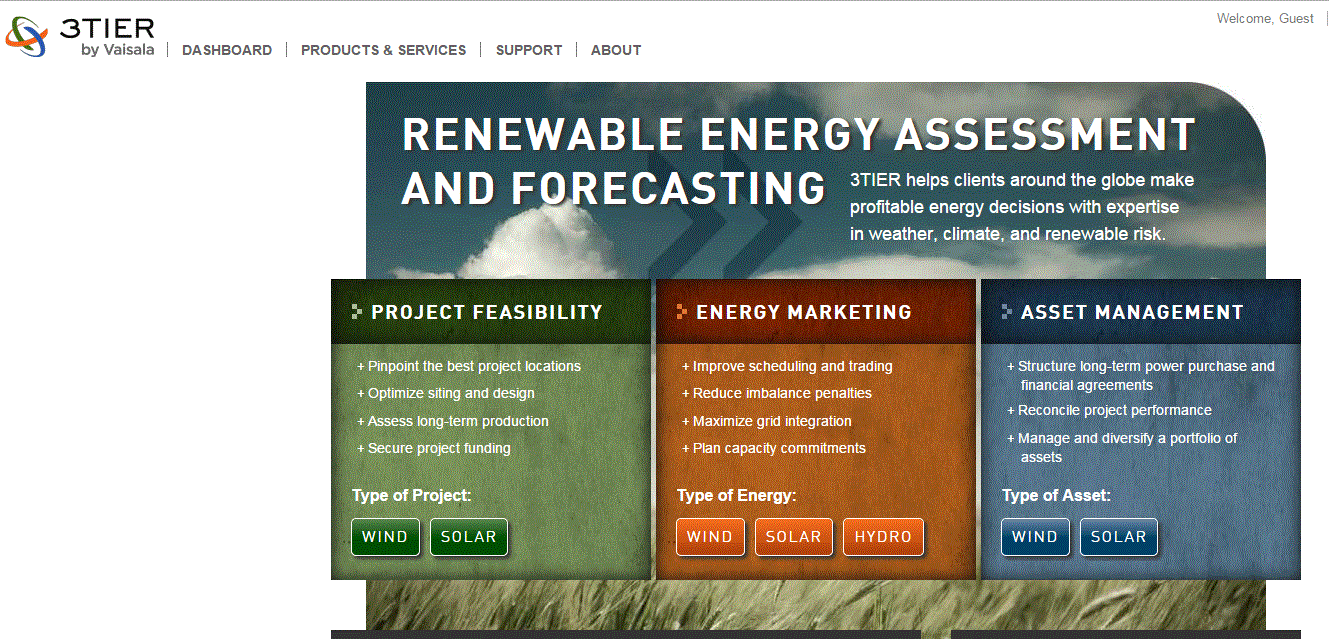
There are several firms, with meteorological modeling and statistical expertise, that supply solar energy forecasts for industry and others.   One of the biggest is here in Seattle:  3-Tier/Vaisala:


In short, solar energy collection is growing rapidly today, but is only a shadow of what it could be, particularly since prices are dropping rapidly and the technology is progressively improving.

Forecast Triumph

Yesterday, a strong front, associated with strong winds gusting to 40 mph or more, moved through the region, resulting in numerous power out...