The most important western Washington weather feature is probably the Puget Sound convergence zone, a band of clouds and precipitation that stretches roughly east-west across northern Puget Sound and into the Cascades (see schematic)
Puget Sound Convergence Zones typically occur when the low-level winds on the coast are from the west to northwest, peel around the Olympics, and then converge over Puget Sound. The converging air streams cause upward motion, and thus clouds and precipitation. Spring is the big season for convergence zones: westerly winds are more frequent than any other time of the year and the air is often unstable, which gives lots of clouds/rain when the air is given an upward nudge.
Such conditions were evident yesterday (Wednesday). A satellite image around noon showed the telltale signs of a convergence zone with a band of clouds across the north sound and clear zones to the north and south. Why clear? Due to sinking on the Olympics mountains and the mountains of Vancouver Island.
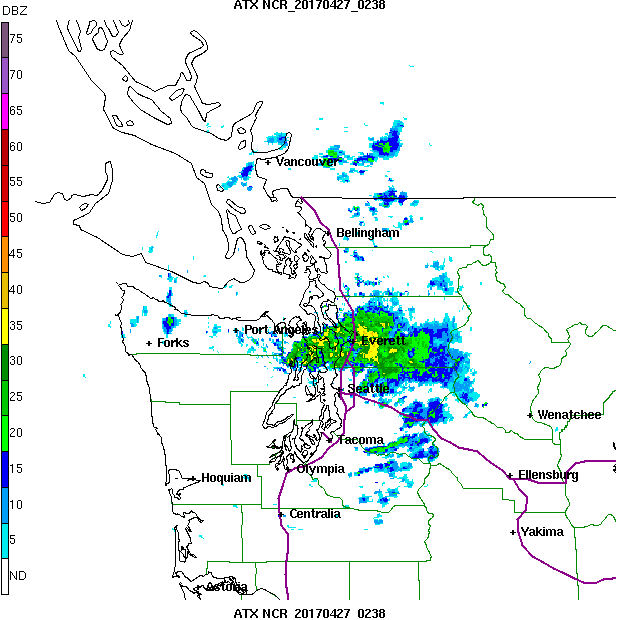
The convergence zone held into the early evening, as suggested by the Camano Island radar image at 7:30 PM. Wow...that is a nice band of precipitation north of Seattle!
Convergence zones typically drop modest to heavy precipitation from north Seattle to Everett, and this one was no different. To illustrate, here is the 24-h precipitation ending 5 AM Friday morning. A few hundredths of an inch over south Seattle, a half inch north of the ship canal, and roughly an inch over Snohomish county. Even more around Monroe and the Cascade foothills.
A radar-derived 24-h precipitation total from Seattle RAINWATCH suggests a similar picture.
When the convergence zone moves southward, the weather changes as it crosses a location are dramatic. Around noon, the convergence line passed the UW, resulting in an abrupt wind shift (southerly to northerly), a few tenths of an inch of rain, a jump in relative humidity from 60 to over 90%, the loss of most of the sun's radiation, and a roughly five degree temperature drop (see below).
Now let me show you how good high resolution numerical weather prediction of the convergence zone has become.
For example, here is the 27-h forecast of the 3 hr precipitation ending at 8 PM Wednesday from the high-resolution (1.3 km grid spacing) UW WRF model forecast started on 5 PM Tuesday....very nice convergence zone.
Or the 24 hr total ending 5 AM Friday from the same run. Looks good, with heavier precipitation north of Seattle and dry zones to the north and south. An expanded view over Puget Sound is also shown.
A decade ago we couldn't make such skillful forecasts, but today it is not an outlier. It represents the impacts of better data and use of data over the Pacific Ocean, higher resolution models, better model physics, and much more.
The Puget Sound Convergence Zone got me interested in NW weather and I still find it fascinating.