March 30, 2012

Record Wet March

 NEWS FLASH: 7.71 inches in Portland (KPDX) at 10 AM, with 15 hours remaining in March 2012, makes this the wettest March in the historical record going back 73 years to 1940. The previous wettest March had been 1957 with 7.52 inches.

The complaints have become a crescendo.  Our Gortex jackets are hopelessly saturated and basements are getting sodden.  For many, it's just too much.   After a relatively dry February, March has been very wet month, and record breaking in some locations.
Probably the most anomalous precipitation has been over eastern Washington, where a some locations have received their  RECORD March precipitation.   Take Spokane, where they established a new  monthly record (4.26")...and they are not done yet.  This record is particularly noteworthy since observations there go back to 1881! But wait, more March monthly record's were also broken throughout eastern WA and Idaho, at locations such as Pullman, WA; Cour D'Alene, ID; and many more (see graphic, courtesy of the Spokane, NWS Office)


Yesterday, a number of western Washington observing sites experienced record rainfall for the date.  Here are some examples listed by the Seattle NWS office:
A RECORD RAINFALL OF 1.08 INCHES WAS SET AT SEATTLE-TACOMA WA
AIRPORT YESTERDAY. THIS BREAKS THE OLD RECORD OF 0.92 SET IN 2010.
 
A RECORD RAINFALL OF 1.04 INCHES WAS SET AT SEATTLE WA WFO
YESTERDAY. THIS BREAKS THE OLD RECORD OF 0.66 SET IN 2010.

A RECORD RAINFALL OF 1.98 INCHES WAS SET AT OLYMPIA WA AIRPORT
YESTERDAY. THIS BREAKS THE OLD RECORD OF 1.38 SET IN 2010.
 
A RECORD RAINFALL OF 1.8 INCHES WAS SET AT QUILLAYUTE WA AIRPORT
YESTERDAY. THIS BREAKS THE OLD RECORD OF 1.37 SET IN 2011.
So far this month Quillayute, on the Washington coast, has received 20 inches of rain (19.93 inches to be exact).  Most western Washington locations have received roughly double their normal amounts for March.

Another way to look at the current situation is this map of the percentage of normal of precipitation over the past 30 days.  Much of eastern Washington is amazing with totals of 200-300% of normal.
Well, what about the future?   Well, if you want dry weather, don't read any further.
Here is the predicted precipitation over the next 72 h.  Much of the coast will get 2-3 inches, with the Olympics and SW BC mountains getting 3-6 inches.  Best bet for dry weather?  Eastern Washington around the Columbia River in the vicinity of the Tri-Cities. 
Later Monday and early Tuesday should be particularly wet as a well-defined atmospheric river of moisture from the subtropics heads right for us.  Here is the water vapor integrated through the vertical column for late Monday morning---the river of moisture is heading straight for us!

Let me remind all of you about supporting public radio and particularly the radio station I do the weather on: KPLU.  KPLU has been a wonderful new home for my weekly weather segment--far better than a past radio station I won't mention--the one with an ENDLESS pledge break.  Please support KPLU if you listen to their excellent programming.
 
Finally, in many parts of the country folks love to tell jokes about why the chicken crossed the road.....

In our part of the country, because of our unique meteorological conditions, our humor is somewhat different, with the chicken replaced by something else:


March 28, 2012

We Can Fix the K-12 Educational System

"The Road to Hell is Paved with Good Intentions"

Some good-intentioned, but misinformed, folks in our state legislature, on the editorial board of the Seattle Times, among the very rich, and in some major foundations are now hell-bent to "solve" the education problem with a devilish brew of charter schools, teacher assessments, union bashing, and "ed reform" ideas.  These folks are well meaning but don't address the real problems, and their solutions will quickly fail while crippling efforts to make real improvements. (In fact, the jury is already in for a number of their failed panaceas--like charter schools and small high schools).  The Seattle Times has reported and opinionated about the conflict over "ed reform" including the debate in the state legislature and the unhappiness of the frustrated ultra wealthy (e.g., Nick Hanauer) in getting their way:  see this article as an example.

We can solve the K-12 education problem, but we need to throw away ideas that quick fixes and "market reforms" will do the trick.  We need to get down to basics and become willing to learn from countries that are successful.  This blog will describe a different approach, one based on fundamentals.  Some basic tenets I believe are important, include:

1.  No more jumping from one edufad to another
2. We need to define exactly what we want kids to know
3.  We must insure that teachers have deep subject knowledge of what they teach.
4.  Teachers must be respected and given substantial autonomy
5.  Education approaches must be guided by empirical testing and research
6. Ed schools need to be reformed and improved.
7.  Pre-school education is a critical component of future learning.
 8.  All kids are NOT going to college, and that is NOT a problem. K-12 education should be flexible to allow varied directions.
9.   Good education costs money

So lets talk about these points:

 1.  Enough of edufads
Education seems to be full of snake-oil salesman, promising a miracle cure that doesn't take a lot of hard work.  Charters schools, Teach for America, new math, whole language reading, discovery math, integrated math, assessment-centered teaching, small high schools...the list is endless.  What virtually all of these have in common is that they are adopted or applied before there is robust evidence of their value.   We wouldn't do that with medicines, why are we willing to try out unproven remedies on our children's education?  Many of these edufads are pushed by the ultra wealthy.  Just because someone is rich as Midas, that does not mean they know anything about education.  And the editorial board of certain newspapers (hint:  Seattle T---S) is particularly irresponsible in pushing fads (and bashing teachers).

2. We need to agree upon and define what we want kids to know

Our state and the nation require clear, well-thought-out standards and curricula that describe with great specificity the knowledge and skills we expect our children to possess upon graduation.  Many states lack this.  In Washington State we have made great progress in some areas (like our new math standards), but we still have a long way to go.   University educators and businesses in our state should have substantial input to these standards; in the end they are the ones that will have to deal with K-12 graduates.  Today, a new edufad is taking hold in the standards/curriculum domain:  the Common Core standards devised by an independent commission under the auspices of the National Governor's association.   They are generally poorly written. The math standards of Common Core are inferior to our state standards, but State leadership is jumping on board in the hope of getting Race to the Top cash. (see my previous blog on Common Core)

3.   We must insure that teachers have deep subject knowledge of what they teach.
   
This sounds obvious but is not true in many cases.  We must insure that all teachers know the subjects they teach at a far deeper level than they are providing instruction.  Elementary school teachers must be competent in middle school math, middle school teachers should be competent in high school math, and high school math teachers need to have college level competence (such as being a math major in college).  Same for other subjects.  You can only teach well when you have subject-area knowledge well beyond your instructional level.  There is a fixation on assessing teachers among some "ed reform" types.   Ok, why don't we begin by testing teacher competence in the subjects they will be teaching, before they enter the classroom and when they move to different grades/subjects?  I can't imagine the teacher's unions objecting to this!  Ed-reform advocates don't seem interested in teacher knowledge, and even push ideas like Teach for America, in which essentially untrained teachers (5-weeks!) are thrown into the classroom

4.   Teachers must be respected and given substantial autonomy

The "ed reform" folks, including the Seattle Times, The Gates Foundation, and the Ed-Reform lobbyists (Alliance for Education, League of Education Voters, etc) are really big on assessing teachers by measuring student progress.  Many of them are into micromanaging what a teacher does in the classroom (Bellevue's past superintendent Riley was particularly excessive in this domain).  Teachers that don't improve student progress are given more training or let go.  Many of these assessment activities are blatantly disrespectful of teachers and ill-informed.  Some are obvious attempts to weaken the teacher's unions.  I am acquainted with a lot of teachers and they are some of the most altruistic people I know, working long hours for modest pay.  The percentage of incompetent teachers are small.  And considering the substantial correlation between student background and their progress in school, no assessment program that I know of is viable.  Teachers need the flexibility to do the best they can and adapt approaches for the varying students for which they are responsible for.   The leading nations in education (e.g., Finland) follow such an approach.

5.  Education approaches must be guided by empirical testing and research

   Education must be guided by scientific, empirical methodology, rigorously testing various approaches (curricula, teaching methods). In contrast, current teaching approaches bounce from fad to fad and education "research" is not rigorous and is highly subjective.  The National Academy of Sciences evaluated education research on math teaching methodologies and found that none (repeat none) of them met basic standards of statistical rigor.  The Academy also suggested that schools of education begin teaching their students proper statistical methodologies.  Lets say there is a debate on how to teach math.  Fine, try various approaches in classrooms with kids of identical demographics and see what works.  Then adopt the best approach system wide.  Keep this testing and replacement going and eventually schools will get much better.  Here in Seattle the administration seems content to squash experimentation.


6. Ed schools need to be reformed and improved.
 A major part of the problem lies in U.S. education schools. Many fill their curricula with theoretical concepts and material that is more appropriate for a social work program than for education.  Many see their role not as educators, but as agents for social change.  I have direct experience with this:  my wife went through two local education school programs.  In addition, I have had many reports from local teachers saying the same thing. Relatively little time is given to classroom management and subject mastery.  And what ed schools call research, would not be considered research in most university departments of science and engineering.

7.  Pre-school education is a critical component of future learning.
 The educational establishment likes to suppress a basic fact of education--the highest correlative with student performance has nothing to do with the classroom...it has to do with the family backgrounds and demographics of the kids.   The educational and family situation before they enter Kindergarten or first grade has a huge impact on their performance in school.  It is thus critical that we do all we can as a society to provide less privileged kids with substantial support and enrichment before they enter school (WAY BEFORE), insuring their basic health needs and that they receive the intellectual stimulation and advantages that their peers in wealthier families enjoy.  There is substantial evidence that Head Start and similar programs have a positive and lasting influence on disadvantaged students (e.g., here)

8.  All kids are NOT going to college, and that is NOT a problem. K-12 education should be flexible to allow varied directions.


There is a lot of talk about college prep and that all students should be given an education the will prepare them for college work.  But the majority of students are not going to college, and our K-12 system must recognize that. There are so many good jobs in building our society and maintaining the complex technology upon which we depend--and many do not require a college degree.  We are not serving these students well today.  We have stripped technical and job-skills training from our schools, and we are failing to provide many of our students with general skills (essential math and communication skills for example) needed in many jobs.  So many times I have heard from master carpenters and tradesman who complain that new employees lack the basic math skills needed for such work.  And in many districts that ideas of tracks, in which more motivated or gifted students are allowed to move ahead faster, is considered to be some kind of right-wing, fascist plot.


9.  Good education costs money, but we need to spend it wisely.

 Quality education is not cheap.  Ask any teacher: smaller class sizes make a real difference, one reason well-to-do folks send their kids to private schools.  We need to pay our teachers salaries that reflect the highly educated professionals we expect them to be.  And our schools must be safe, positive surroundings that are properly equipped.  And the number of children in classrooms need to be reduced.

Here in Washington we are 38th in per capita spending among the states, while we have one of the most educated populations, with many employed in high technology industries.  Not good.

But to be fair, our state and the U.S. on average spends far more per pupil than nearly every country in the world...even countries doing far better than we in educating their kids (e.g., Finland).  Part of this is certainly our varied demographics, but quite frankly we waste a huge amount of money...money that could have been spent in the classroom.  Seattle is a prime case in point.  First there is the loss from extensive corruption and mismanagement (which led to the exit of several superintendents over the past few years).  Then there was the multi-decadal waste on busing, which only succeeded in permanently damaging the district and sending families to the suburbs and private schools.   We have wasted HUGE amounts of money on thick, colorful textbooks that often had little pedagogical value (sometime I will blog about the corrupt textbook publishing industry).  The district has had a large bureaucracy of highly paid middle managers and "curriculum specialists"  and nearly worthless "math coaches."  And on the state level we wasted a billion dollars on a useless WASL exam and hundreds of millions on questionable training programs for teachers in the latest "research-based pedagogy."  

So let K-12 education clean up its financial house, reduce waste, and then our society much insure that the necessary funding for a first-class education is in place.

We can either deal with the fundamentals of our problems....as suggested above...or keep chasing the latest edufad.  To use a meteorological metaphor, edufads are similar to getting rich by finding the pot of gold at the end of the rainbow--sounds good and is awfully appealing....but you can never get to the end of a rainbow.  And we won't properly educate our children unless we are willing to do the hard work, guided by facts, with sufficient resources.

Support Local Public Radio:  Pledge Drive at KPLU
KPLU has been a wonderful new home for my weekly weather segment.  Please support them if you listen to their excellent programming.

March 26, 2012

The Strengthening Sun

We have had a lot of sun the past few days and one thing that is apparent is the gathering strength of the solar radiation we are receiving.   It seems strange, but the sun right now is roughly equivalent to that of mid-September, before summer's end.  Just to illustrate, here are monthly radiation values from NREL, the U.S. government agency that gathers such information (the black line is the mean over 30 years, shading shows extremes in individual months) for Seattle and Spokane:
Seattle Radiation

Spokane Radiation
There is a huge increase in solar radiation between January and March and then a slow rise to the peak in July.  So at the end of March we are over 1/2 way to max radiation.    This figure factors in average clouds.  Spokane obviously does a bit better than Seattle.

 Lets compare our radiation to that of Honolulu (see below).   In the summer there is not much difference, since our northern latitude is balanced out by our longer days.   During the winter..... well...you don't need a meteorologists to tell you about that. 


Here is the actual radiation reaching the surface that last few days, based on the measurement at the UW:


On some days (like March 23rd), in which the skies are nearly clear all day, the radiation looks like a near perfect cosine curve, while on other days (like today), there are plenty of clouds the reduce radiation significantly.

A number of folks are experimenting with solar collectors in our area as a way of acquiring more green energy for their homes.   There are significant number of solar contractors and non-profits ready to do installations around here.  Sounds crazy for cloudy Seattle?  It turns out that we get more solar radiation than Germany and they have a very large installed base of photovoltaic and other collectors (see map).


 Clearly, the SW U.S. is just perfect for solar energy:  LOTS of sun and a huge population that wants air conditioning while the sun is blazing.  Our country needs to do more....a LOT more...to take advantage of this huge resource.


March 24, 2012

Hook Echo on the Washington Coast?

Ask any tornado stormchaser.  You want to find severe convection, tornadoes and big hail?  Look for a hook echo on the weather radar.  In fact, one of the big meteorological breakthroughs in the 1950s was when we tried out WWII surplus radars and found that severe convection, and often tornadoes, were associated with hook echos (see sample).

Today modern radars paint out a wonderfully nuanced image of such echos, most of which are associated with huge supercell convective storms:

This image is from a intense storm over Oklahoma.

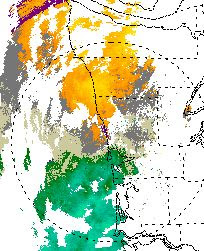
So why I am bringing this up now?  On Thursday, I received an email from a Canadian forecaster who was excited to see a well-defined hook echo along the Washington coast (viewed by my favorite new radar, Langley Hill).  Here is an example (the times was between 10 and 11 AM on Thursday, 1800-1900 UTC)


You can see the well-defined hook just offshore south of Quillayute (UIL).  So was there a supercell storm and tornadoes/hail off the WA coast, or was there some other explanation of this amazing image?  We are fortunate that this feature was extremely well positioned to be seen by the Langley radar.  Ok, lets play detective!

First, one would expect very high reflectivities (intense radar echoes) and some rotation (called a mesocyclone) as viewed by the doppler capability of the radar.   Here is what the radar showed.  First, the reflectivity:

Values reaches the yellows...heavy rain, but not exceptional, with no hint of the reds (50s) that are often indicative of hail.  Strike 1.

The radial velocities (towards or away from the radar) are next.


 Mesocyclones (regions of rotation with supercell storms) generally show couplets of velocities towards or away from radar--that shows rotation.   Looks like this:

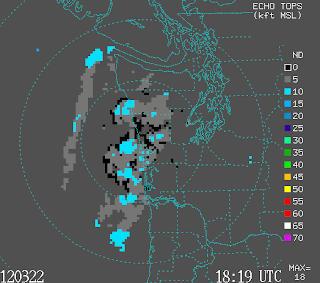
No hint of that pattern here. Strike 2.  Furthermore, supercell storms generally have high tops.  Here is the top of the radar echos for this feature:
5-10 thousand feet. VERY unimpressive.  Big storms in the Midwest can get to 50-60K feet and supercells around here up to 25-30K ft.  Strike 3.

So when we look under the hood, it does not appear that this is a supercell storm.  So why the hook echo?

We had a nice line of heavy showers approaching the coast relatively slowly.  If there was enough horizontal wind shear, that could roll up the convective shower line into such hooked features.  In fact, if you look at the first image above, there are hints of other rolled-up echoes.  The Doppler velocity figure suggests that there was some shear at low levels offshore.   There are some very limited surface wind observations that indicate the same thing:

Observation at 10 AM
Moderate southeasterlies at Destruction Is and southerlies offshore.  Put a pinwheel in there at the right spot and it would tend to rotate.  I suspect that is what happened... the tendency for rotation in the winds (we call it vorticity in the biz)..caused a roll-up of the convective shower line. A fun oddity, but no big storm along the coast (if any of you were out there then, let us know what it was like!)

PS:  the western weather satellite is repaired and back online!  And mild weather is ahead. 

March 22, 2012

It's a Miracle: Normal Weather Returns

 Check out my KPLU podcast on the weekend weather:  here.


 It is hard to remember such an extended period in March where snow was falling somewhere over the lowlands of western Washington and Oregon.  Even yesterday, the persistent snow plagued our region, with the area south of Portland and extending down to Eugene not only getting snow, but record-breaking snow.  Eugene had a storm total of 7.5 inches...the most they ever had so late in the season.

  But I have good news...I think snow is over for the lowlands...and probably for the rest of the spring.  The large scale atmospheric pattern is shifting enough that we should enjoy near normal temperatures for a while (like mid 50s) and believe it or not Saturday should be dry and perhaps a few showers over the western sections on Sunday morning..  During the next few days a deep trough will build in the eastern Pacific and all the weather will head south to California. Here are the upper level maps for Saturday and Sunday...not the best time to vacation in lotus land, but they will get acutely needed precipitation. We are left high and dry...and I mean dry, with a weak ridge extending over the NW.  Saturday may get up near 60F. 


Here are the 24-h precipitation maps ending Saturday and Sunday at 4 PM.  We will see some middle and high clouds and some showers may slip up from Oregon on Sunday, influencing mainly the coastal portions of WA.

The extended models, including gold-standard ECMWF, suggests we will stay in a milder pattern, with rain returning next week.  But after 5 weeks of generally below-normal temperatures, 50s will feel quite comfortable and this weekend spring-like.

GOES-West Weather Satellite Fails

 Update:  It appears that the problem has been identified and can be fixed.  Satellite might be back online by Friday.

Yesterday the National Weather Service GOES-West (GOES-15) geostationary weather satellite failed. In a geostationary orbit that allows it to stay above the same location in time, GOES-W is positioned over the equator at 135W at around 36,000 km above the surface.


The folks at the National Weather Service are trying to bring it back, but right now there is no information on how long this will take or whether they will succeed.

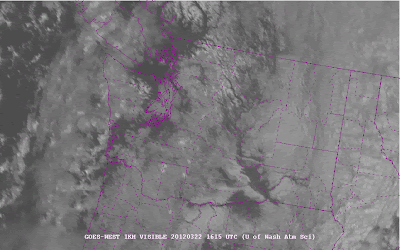
In the meantime, we are getting images from the other U.S. geostationary satellite (GOES-E) positioned over the equator at 75W, but that results in distorted images over the Northwest, with coverage rapidly fading/smearing out over the Pacific (see two samples of images this morning...the first infrared, the second visible).


 In addition to the geostationary weather satellites, the U.S. has several polar orbiting satellites that circle the earth at a much lower altitude (about 800 km) and view the earth in relatively narrow swaths (about 2000 km wide).  The trouble is that this coverage is not continuous, but at least we get a view everywhere at regular intervals.

The weather satellite systems are hugely expensive, and their costs are now squeezing out other functions of the National Weather Service.  But their value is also substantial, and much of the credit for the improvement of weather prediction goes to the availability of huge amounts of satellite data everywhere over the planet.

Of course we have our coastal radar painting out approach weather along the Washington coast!  As you can see below, a line of showers is approaching us Thursday AM...

March 20, 2012

A New View of Seasonal Changes

Doesn't  it seem like the warmth of spring and the comfort of summer takes an eternity to occur here in the Northwest?   (and astronomically, today is the first day of spring by the way).   In this blog, I am going to show you something that is in no meteorological textbook--at least none I know of:  maps of temperatures change between the generally coldest month of winter (usually January) and the beginning of spring (March) and the middle of summer (July).

Does it warm up faster or slower here compared to the rest of the country? 
What states warm up the most? 

All will be revealed here!

First, take a look at March minus January mean temperatures (F), shown both in numbers and colors (thanks to Neal Johnson of the UW for putting together these graphics).
Big range!  Florida and California only warm up by 7 degrees, while the Northwest, the far southwest, and the southeast/Middle Atlantic coasts warm up by around 10F.  But take a look at the upper Midwest:  they warm up by roughly 20F.  But lets face it, they start real cold.   So the bottom line here is the Northwest complainers really don't have much on their side regarding March temperatures.

But what about the temperatures change between January and July?  There we might complain a bit.  The West Coast, downwind of the Pacific, only warms up by about 30-34F, and of course, subtropical Florida warms up the least (24F).  But take a look at the upper Midwest...some states (MN, ND) warm up by 61F!  Can you imagine sixty degrees warmer on average in July than January.  No wonder they have a lot of cracked concrete there.  The northeast U.S. and the central plains warm up by 45-55F---summer really means something in those climes.
The Northwest warms up in those six month about the same as Louisiana and Georgia, which somehow does not make me feel any better.  So get away from the moderating effects of water and head north and you can enjoy a real summer warm-up--but is it worth it?

And now for some good news.  For the first time, in what seems like months, the NWS Climate Prediction Center 8-14 day forecast is not predicting for us to be below normal.


Just normal.  Somehow the huge warm anomaly to our east takes a bit of the pleasure away from our moderating temperatures.  The eastern two-thirds of the U.S. have been extraordinarily warm this winter, while a veneer of cold has hugged the West Coast.  Southern California is going to be getting the brunt of weather systems starting this weekend as the jet moves south of us.  More on that in another blog.

Attention Animal Lovers!   King County and Missing Pet Partners are looking for volunteers for Mission Reunite.  Training will take place on Saturday, March 24, from 1-3 pm at the RASKC Pet Adoption Center in Kent.  For more information, you can go to this website.   As someone who has lost a dog (and still looking!) I cannot exaggerate the importance of such groups.  They are full of some of the most giving, altruistic folks I have met.

March 18, 2012

The U.S. Has Fallen Behind in Numerical Weather Prediction: Part I

 Part II found here.

It's a national embarrassment.  It has resulted in large unnecessary costs for the U.S. economy and needless endangerment of our citizens.  And it shouldn't be occurring.

What am I talking about?   The third rate status of numerical weather prediction in the U.S.  It is a huge story, an important story, but one the media has not touched, probably from lack of familiarity with a highly technical subject.   And the truth has been buried or unavailable to those not intimately involved in the U.S. weather prediction enterprise. This is an issue I have mentioned briefly in previous blogs, and one many of you have asked to learn more about.  It's time to discuss it.

Weather forecasting today is dependent on numerical weather prediction, the numerical solution of the equations that describe the atmosphere.  The technology of weather prediction has improved dramatically during the past decades as faster computers, better models, and much more data (mainly satellites) have become available.
Supercomputers are used for numerical weather prediction
U.S. numerical weather prediction has fallen to third or fourth place worldwide, with the clear leader in global numerical weather prediction (NWP) being the European Center for Medium Range Weather Forecasting (ECMWF).  And we have also fallen behind in ensembles (using many models to give probabilistic prediction) and high-resolution operational forecasting.  We used to be the world leader decades ago in numerical weather prediction:  NWP began and was perfected here in the U.S.  Ironically, we have the largest weather research community in the world and the largest collection of universities doing cutting-edge NWP research (like the University of Washington!).   Something is very, very wrong and I will talk about some of the issues here.  And our nation needs to fix it.

But to understand the problem, you have to understand the competition and the players.  And let me apologize upfront for the acronyms.

In the U.S., numerical weather prediction mainly takes place at the National Weather Service's Environmental Modeling Center (EMC), a part of NCEP (National Centers for Environmental Prediction).   They run a global model (GFS) and regional models (e.g., NAM).

The Europeans banded together decades ago to form the European Center for Medium-Range Forecasting (ECMWF), which runs a very good global model.  Several European countries run regional models as well.

The United Kingdom Met Office (UKMET) runs an excellent global model and regional models.   So does the Canadian Meteorological Center (CMC).

There are other major global NWP centers such as the Japanese Meteorological Agency (JMA), the U.S. Navy (FNMOC), the Australian center, one in Beijing, among others.   All of these centers collect worldwide data and do global NWP. 

The problem is that both objective and subjective comparisons indicate that the U.S. global model is number 3 or number 4 in quality, resulting in our forecasts being noticeably inferior to the competition.  Let me show you a rather technical graph (produced by the NWS) that illustrates this.  This figure shows the quality of the 500hPa forecast (about halfway up in the troposphere--approximately 18,000 ft) for the day 5 forecast.  The top graph is a measure of forecast skill (closer to 1 is better) from 1996 to 2012 for several models (U.S.--black, GFS; ECMWF-red, Canadian:  CMC-blue, UKMET: green, Navy: FNG, orange).  The bottom graph shows the difference between the U.S. and other nation's model skill.

 You first notice that forecasts are all getting better. That's good.  But you will notice that the most skillful forecast (closest to one)  is clearly the red one...the European Center.  The second best is the UKMET office.  The U.S. (GFS model) is third...roughly tied with the Canadians.
  
Here is a global model comparison done by the Canadian Meteorological Center, for various global models from 2009-2012 for the 120 h forecast.  This is a plot of error  (RMSE, root mean square error) again for 500 hPa, and only for North America.  Guess who is best again (lowest error)?--the European Center (green circle).  UKMET is next best, and the U.S. (NCEP, blue triangle) is back in the pack.


Lets looks at short-term errors.  Here is a plot from a paper by Garrett Wedam, Lynn McMurdie and myself comparing various models at 24, 48, and 72 hr for sea level pressure along the West Coast. Bigger bar means more error.  Guess who has the lowest errors by far?  You guessed it, ECMWF.


 I could show you a hundred of these plots, but the answers are very consistent.  ECMWF is the worldwide gold standard in global prediction, with the British (UKMET) second.   We are third or fourth (with the Canadians).   One way to describe this, is that the ECWMF model is not only better at the short range, but has about one day of additional predictability:  their 8 day forecast is about as skillful as our 7 day forecast.   Another way to look at it is that with the current upward trend in skill they are 5-7 years ahead of the U.S. 

Most forecasters understand the frequent superiority of the ECMWF model.  If you read the NWS forecast discussion, which is available online, you will frequently read how they often depend not on the U.S. model, but the ECMWF.  And during the January western WA snowstorm, it was the ECMWF model that first indicated the correct solution.  Recently, I talked to the CEO of a weather/climate related firm that was moving up to Seattle.  I asked them what model they were using:  the U.S. GFS?  He laughed, of course not...they were using the ECMWF.

A lot of U.S. firms are using the ECMWF and this is very costly, because the Europeans charge a lot to gain access to their gridded forecasts (hundreds of thousands of dollars per year).  Can you imagine how many millions of dollars are being spent by U.S. companies to secure ECMWF predictions?  But the cost of the inferior NWS forecasts are far greater than that, because many users cannot afford the ECMWF grids and the NWS uses their global predictions to drive the higher-resolution regional models--which are NOT duplicated by the Europeans.  All of U.S. NWP is dragged down by these second-rate forecasts and the costs for the nation has to be huge, since so much of our economy is weather sensitive.  Inferior NWP must be costing billions of dollars, perhaps many billions.

The question all of you must be wondering is why this bad situation exists.  How did the most technologically advanced country in the world, with the largest atmospheric sciences community, end up with third-rate global weather forecasts?   I believe I can tell you...in fact, I have been working on this issue for several decades (with little to show for it).  Some reasons:

1.   The U.S. has inadequate computer power available for numerical weather prediction.  The ECMWF is running models with substantially higher resolution than ours because they have more resources available for NWP.   This is simply ridiculous--the U.S. can afford the processors and disk space it would take.  We are talking about millions or tens of millions of dollars at most to have the hardware we need.   A part of the problem has been NWS procurement, that is not forward-leaning, using heavy metal IBM machines at very high costs.

2.  The U.S. has used inferior data assimilation.  A key aspect of NWP is to assimilate the observations to create a good description of the atmosphere.   The European Center, the UKMET Office, and the Canadians using 4DVAR, an advanced approach that requires lots of computer power.   We used an older, inferior approach (3DVAR).  The Europeans have been using 4DVAR for 20 years!   Right now, the U.S. is working on another advanced approach (ensemble-based data assimilation), but it is not operational yet.

3.  The NWS numerical weather prediction effort has been isolated and has not taken advantage of the research community.   NCEP's Environmental Modeling Center (EMC) is well known for its isolation and "not invented here" attitude.  While the European Center has lots of visitors and workshops, such things are a rarity at EMC.  Interactions with the university community have been limited and EMC has been reluctant to use the models and approaches developed by the U.S. research community.  (True story:  some of the advances in probabilistic weather prediction at the UW has been adopted by the Canadians, while the NWS had little interest).  The National Weather Service has invested very little in extramural research and when their budget is under pressure, university research is the first thing they reduce.  And the U.S. NWP center has been housed in a decaying building outside of D.C.,one  too small for their needs as well.  (Good news... a new building should be available soon).

4.  The NWS approach to weather related research has been ineffective and divided.  The governmnent weather research is NOT in the NWS, but rather in NOAA.  Thus, the head of the NWS and his leadership team do not have authority over folks doing research in support of his mission.  This has been an extraordinarily ineffective and wasteful system, with the NOAA research teams doing work that often has a marginal benefit for the NWS.

5.  Lack of leadership.   This is the key issue.  The folks in NCEP, NWS, and NOAA leadership have been willing to accept third-class status, providing lots of excuses, but not making the fundamental changes in organization and priority that could deal with the problem.  Lack of resources for NWP is another issue...but that is a decision made by NOAA/NWS/Dept of Commerce leadership.

This note is getting long, so I will wait to talk about the other problems in the NWS weather modeling efforts, such as our very poor ensemble (probabilistic) prediction systems.  One could write a paper on this...and I may.

I should stress that I am not alone in saying these things.  A blue-ribbon panel did a review of NCEP in 2009 and came to similar conclusions (found here).  And these issues are frequently noted at conferences, workshops, and meetings.

Let me note that the above is about the modeling aspects of the NWS, NOT the many people in the local forecast offices.  This part of the NWS is first-rate.  They suffer from inferior U.S. guidance and fortunately have access to the ECMWF global forecasts.  And there are some very good people at NCEP that have lacked the resources required and suitable organization necessary to push forward effectively.

This problem at the National Weather Service is not a weather prediction problem alone, but an example of a deeper national malaise.  It is related to other U.S. issues, like our inferior K-12 education system.  Our nation, gaining world leadership in almost all areas, became smug, self-satisfied, and a bit lazy.   We lost the impetus to be the best.   We were satisfied to coast.    And this attitude must end...in weather prediction, education, and everything else... or we will see our nation sink into mediocrity.

The U.S. can reclaim leadership in weather prediction, but I am not hopeful that things will change quickly without pressure from outside of the NWS.  The various weather user communities and our congressional representatives must deliver a strong message to the NWS that enough is enough, that the time for accepting mediocrity is over.  And the Weather Service requires the resources to be first rate, something it does not have at this point.

Part II will discuss the problems with ensemble and high-resolution numerical weather prediction in the U.S.

March 16, 2012

The Revenge of La Nina

 Forecast Update and More on La Nina on KPLU at 9 AM Friday or online.

Last winter we were securely in La Nina conditions and the region experienced a miserable, cold, wet spring that lasted into mid summer.   Horror to all soccer and Little League parents.

This winter we have also been in a La Nina and since early February we have been colder and wetter than normal, with snowpack surging in our mountains.

Yes, it appears we are dealing with  the revenge of La Nina.

Beware the white side of the force
So how bad has it been?


 Here is the plot of temperatures at Sea Tac versus normal highs and lows for the past month.  Only four days have equaled or exceeded normal, while a large number of days have been below normal. 
Here is the departure of temperature from normal for the past 30 days:  the western U.S. has generally been colder than normal (dark green and blue), with western WA and Oregon, MUCH cooler than normal.  Maddeningly, nearly all of the nation east of the Rockies had been much WARMER than normal.
Precipitation has been greater than normal over the Cascades and western WA, resulting in a rapid build up of snowpack.  As you can see from the snow water equivalent on March 15th, much of our area is above normal.  But CA is still in a snow drought.

Between the 9th and 14th of March, Mt. Baker  added 59 inches of snow and now is virtually tied with last year's total on the same date (251 inches on the ground today, 252 inches a year ago).  Take a look at the snow water for the Seattle watershed (Cedar/Tolt)--way above last year and normal.  We are already well above the normal winter max snowpack at that site.

The fascinating thing about La Nina years is how often we have seen this late winter surge of snow, cold, and precipitation.   You never give up in February...March is often a big snow month.

So what is going to happen?   Are we going to have to endure a non-spring like last year?
There is some suggestion that our fate is different than last year...we will suffer...but the wet, chill will not last into summer.

First, the suffering.  The last extended runs of the best modeling system in the world (the European Center), indicates that upper troughing with cold, wet weather will last for at least the next ten days.   In fact, we will get quite cool this weekend, with a chance of lowland snow in the Puget Sound convergence zone on Saturday morning (but nothing heavy) and low snow levels (roughly 500 ft) ocer the weekend.  That means higher hills could see some flakes....but no real accumulations until you get to 1000 ft.   Continued snow in the mountains.

But something is changing:  La Nina is rapidly weakening.  As shown in the next picture, the cold anomalies in the central tropical Pacific are rapidly declining and some parts of the tropical eastern Pacific are now warmer than normal.   Predictive models suggest that La Nina will be over by the end of April.

As explained in previous blogs, La Nina often forces ridging in the eastern Pacific and troughing over the NW--producing the cold/wet pattern.   By early summer the La Nina forcing should be over.

The NWS runs a climate prediction system four times a day that predicts the weather out several months.    Here is what it is showing for temperature.  A bit colder than normal for early Spring, followed by near-normal temperatures for late spring into summer.  Maybe, just maybe, we will get out this infernal pattern.

I am buying my tomato seeds this week! 

Jabba the snowman is not happy.

Tomorrow's Windstorm in Four Acts

 Each atmospheric "play" is different and according to high-resolution forecast models, I can describe the four "acts" t...