As I have described in previous blogs (here and here), the proximate cause of the unusual weather has been a persistent ridge of high pressure (ridge) over the eastern Pacific and low pressure (trough) over the eastern U.S. Let me give you a better view of this by showing you the anomalies (differences from climatology) of heights of the 500 hPa pressure surface (located at around 18,000 ft) for the last two winter seasons (Nov through Feb). (see below) You can think of 500 hPa height like pressure (higher heights mean higher pressure, etc.) Blue colors indicate lower than normal heights (a.k.a., troughs) and yellow/orange suggest higher than normal heights (ridges).


You will note that both winters have a similar pattern with a line of alternating low and high pressures extending from near Hawaii to the north Atlantic. This is called wave train and reflects a large scale atmospheric wave pattern emanating out of the tropics of the central Pacific. Both winters (2013-2014, 2014-2015) have ridging over the West Coast and troughing over the eastern U.S., but if you look closely there has been a subtle eastward shift of the pattern.
Last year's West Coast ridge was centered offshore and this year's ridge is nearly on the coast. This subtle shift has had its effects, such as causing this winter to be warmer over our region, with a bit more precipitation over California.
So the question of why our weather has been so unusual is really about the upper level wave train: why did it form? Why so strong this year? Why in in this configuration?
Fortunately, during the past few decades meteorologists have gained a deep knowledge of such wave trains, with much of the fundamental work done here at the University of Washington.
One early insight was that large areas of convection (thunderstorms) in the tropic Pacific Ocean, generally located over warmer than normal water, could create an atmospheric wave train that moved into the midlatitudes. You can think of the intense vertical motions in the tropical thunderstorms as big rocks dropped into a large (planetary) pond, with waves propagating away from the disturbed area (a young man below demonstrates this).


For example, we have learned when warm tropical Pacific waters shift eastward, with the big thunderstorms following---something known as El Nino---the changes in the position of the wave train greatly influence West Coast weather, causing low pressure over the eastern Pacific and wetter conditions over California. Here are two plots: one showing the sea surface temperature anomaly during El Nino years and the second, the associated impacts (anomalies from normal of the 500 hPa heights, again around 18,000 ft) over the entire globe. The impact of the warm tropical water in the eastern Pacific are profound, including a deep low off (purple) of North America. La Nina events (colder water in eastern Pacific, warmer in the west) have the opposite effects.


So what does this have to do with the wacky weather of the past two winters? Just about everything, as demonstrated by a series of recent research papers.
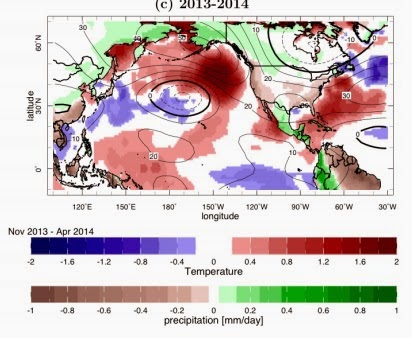
During the past two years there has been a sea surface temperature anomaly in the western tropical Pacific that strengthened and extended westward in 2015. Below are the sea surface temperature anomalies (difference from normal) for November to February of 2013-2014 and 2014-2015, with red and orange indicating much warmer than normal temperatures. In 2014, you can see the warmer than normal temperatures near the equator NE of Australia (and the warm BLOB off our coast). This year the warm waters extended eastward and the warm BLOB moved to our coast.


Several researchers, including Saeger et al and Hartmann 2015, to name just a few, have shown the including the observed tropical sea surface temperatures in numerical simulation models produced midlatitude wave trains (positions of highs and lows) very similar to observed. Here is an example from Seager et al., showing the winter 2013-2014 the sea surface temperatures anomalies (color shading over the oceans) used to forced the models. In turn, the model produced dry conditions over the West Coast and an upper level ridge (shown at 200 hPa, around 40,000 ft) along and just offshore of the West Coast, with a trough over the eastern U.S. Very similar to what was observed. Magic.
The key point is that the observed sea surface temperature distribution in the tropics can forced the observed anomalous weather patterns in the midlatitudes.
Dennis Hartmann's 2015 paper demonstrates this pattern reflect a mode of natural variability called the North Pacific Mode. The positive phase of the North Pacific Mode has a sea surface distribution very much what we have seen the past two years (see figure below, which shows sea surface temperature anomalies for NPM years)


The bottom line of the bulk of the recent literature by top NOAA and university scientists is that the unusual conditions we have seen this year and last reflect natural variability, with much (but not all) of it associated with the North Pacific Mode. Thus our unusual weather is probably not the result of anthropogenic global warming, and it appears that trendy theories of the impacts of polar warming are probably without merit. The best news is that since it is natural variability one might expect that it will soon end.
.png)


Thank you very much, Prof. Mass.
ReplyDeleteI've asked Hartman to describe the difference between NPM and PDO.
ReplyDeleteAre they the same thing?
No they are not the same thing....different modes. And their have very different time variations...cliff
ReplyDeleteThank you, I did receive a response explaining the difference. Still learning as I go.
DeleteI'm hoping the NPM is responsible for the lack of snow up here in South Central Alaska and it is shorter lived compared to the PDO.
No they are not the same thing....different modes. And their have very different time variations...cliff
ReplyDeleteNo they are not the same thing....different modes. And their have very different time variations...cliff
ReplyDeleteDarn it all; I knew I should have organized that trip to dump a bunch of ice cubes into the Pacific last summer!
ReplyDeleteIf that 500hPa trough 'above' Hawaii continues on a linear path, it should reach us in a few years. :P Maybe I'll have learned to ski by then.
Hi Cliff- can you project on this summer's forecast? After such a nice winter, I'm a little afraid the other shoe will drop. Will we have 100 degree weather for days on end (that was terrible last time) or the worst summer on record for being overcast and rainy (2010 repeat?)
ReplyDeleteThat final graph shows that large warm anomalies often end with an abrupt "crash" to cooler-than-normal sea temperatures, which I would wager a guess produce the opposite sort of conditions. So there may be hope for an epic snow season to compensate for the two disappointing ones we've recently had.
ReplyDeleteI would like to believe it is all natural variability, but this is not yet convincing to me. The polar ice cover is plummeting at a historically unprecedented rate over the last two to three years especially. Arguably Cliff's chart shows a reduction in the frequency of extremely cold years, and we don't actually know whether the historical natural variability will continue in the future. In other words: this study shows that we have had variability in the past, but does not prove that we have not entered a new regime, with significantly altered variability, in the last decade.
ReplyDeleteIs it possible the increasing pollution in the far east is causing these changes in weather over the Pacific?
ReplyDeleteYes, as Rob Jellinghaus says, the natural variability hypothesis implies that there is no forcing influence upon that variability due to warming. The Pacific Ocean is huge, complex and is being subjected to a warming climate now. How that expresses itself in the future is not something that can necessarily be explained by past natural variability. How many "unusual winters" will we need to see before Cliff admits that warming is having effects upon our weather systems now and that we have entered a new regime now - today, not some time in the future. Three? Four?...Ten?
ReplyDeleteProfessor Mass,
ReplyDeleteCould you compare the sea temps of other winters such as 2012 and 2008 to the last two winters for us?
Thanks, Cliff. Very well laid out, and the 'no-trend' variability graph is especially interesting.
ReplyDeleteBut I just read of a study published by Sloan and Sewell in 2004 predicting effects of decreasing arctic sea ice on high pressure areas over the eastern pacific & reduced rainfall in west (brief summary with link to original article: http://thinkprogress.org/climate/2014/03/07/3370481/california-drought/).
It will be interesting to see, over time, whether random variations continue as arctic sea ice declines or whether a trend line starts to emerge.
I'm still trying to understand the implications of your claims about polar amplification, if thats what they are. Is it true that this belief is widely held or is it just you and some others? Is there a consensus among your peers either way? Is what is happening in the north pacific indicative of elsewhwere in the world in regard to polar amplification theory or other theory? Is there in fact any observed increase in "amplification" behavior that seems to parralel polar temp increases? Just curious as to how strong this refutation is. Thats how we roll you know. It dosn't matter what one guy says... whats the consensus if there is one?
ReplyDelete" How many "unusual winters" will we need to see before Cliff admits that warming is having effects upon our weather systems now and that we have entered a new regime now - today, not some time in the future. Three? Four?...Ten?"
ReplyDeleteI'm guessing enough winters so that we can use DATA to resolve and confidently get to the bottom of the issue, if in fact the cycle changes. I commend Cliff for providing a rational science-based take on this. And when the DATA suggest otherwise I'm sure he'll do so as well.
Thanks you for a great blog! I have a question about the BLOBS of warm water in the Pacific that drive our weather. Have oceanographers and geologists looked at this situation and offered any opinions as to weather (pun intended) geothermal/volcanic activity is a factor in generating or controlling the BLOBS?
ReplyDelete"Professor Hartmann analyzed the observed magnitude of this mode over the past several decades (shown below). Note how it is has grown rapidly over the past two years. But also observe that no long-term trend is apparent. This suggests that the anomalous conditions are not reflecting global warming, which has revved up substantially over that period."
ReplyDeleteI can see that there is no apparent trend in the graph. The graph seems to limited in the timeline to see any larger trends though.
To all of the global warming buffs, go back and look at the conditions found in the North Pacific in the late '50s and the late '70s and you'll see a remarkable resemblance to what we have today. This happened back when everyone was concerned about global cooling. I remember the late '70s event and recall having some snowy winters in Seattle by the early '80s (a good dumping in '81 comes to mind along with very cold temperatures).
ReplyDeleteIt appears some scientists at Stanford have come to a different conclusion:
ReplyDeletehttp://news.stanford.edu/news/2014/september/drought-climate-change-092914.html
From the article: "We've demonstrated with high statistical confidence that the large-scale atmospheric conditions, similar to those associated with the Ridiculously Resilient Ridge, are far more likely to occur now than in the climate before we emitted large amounts of greenhouse gases," Rajaratnam said.
Can you comment on this study?
Hey Eric, do you trust yourself to draw conclusions about causation in the two examples? I know I'm not even though i could probably create a plausible story that creates a parralel. It really dosn't matter much what we "remember" especially considering how well known how error prone memory is. Data is good and process is good but it don't mean shit unless you have expertise to infer meaning. Thats why we invest trust in institutional expertise rather than incompetent assumption. No I'm not saying you are incompetent but I 'm comfortable guessing that most us followers of this blog are. We need to be told what it is true because we can't test to verify. Thats why i keep asking cliff to verify the claims of refutation of polar amplification. Who are we trusting on this claim besides Cliff?
ReplyDeleteThank you, Professor Mass. The lack of snow this winter has me down. Can you see my frown? The Summit at Snoqualmie is ready to renew, but the decision has got me blue. To renew or not renew that season pass. That is the question for Professor Mass. Deep in your crystal ball, what does it say? Lock it in now or wait until Fall.
ReplyDeleteSra Mac- a quick read of that link suggests that those conclusions were entirely drawn from a forward modeling/statistical based approach. This is obviously another tool in trying to understand how various degrees of freedom in (nonlinear) climate interactions might produce outcomes, but is very different from the kind of data-driven approach that Cliff is using here (unless I am misunderstanding the whole shee-bang). Apple and oranges maybe? Be great to get Cliff's response.
ReplyDeleteRelatives in California say "Climatologists down here are saying the low rainfall/warm winter pattern will be with us for many years." I am curious as to who this refers to, do you know of researchers in California who draw different conclusions than Cliff? (Excluding the Stanford article referenced elsewhere in this blog, which in fact was over-hyped by Stanford's PR department.)
ReplyDeleteI would like to believe it is all natural variability, but this is not yet convincing to me. The polar ice cover is plummeting at a historically unprecedented rate over the last two to three years especially
ReplyDeleteTwo things. First, while polar sea ice is low, the snow cover in northern Canada is very high, as is ice on the Great Lakes. Secondly, the arctic and the antarctic typically "trade" -- when one is "warm" the other is "cold."
And that's what has happened lately. Sea ice is at record levels in the antarctic, and temperatures there are at record lows.
Ye gads.... I put the same question to you Placeholder as I did to Eric. Are you confident in your competency to draw conclusions of causation or meaning in your above claims of observation?
ReplyDeleteCliff, you must be fully aware by now that there is a perception that your "messaging" appears contrary to prevailing expert opinion. I know that generally you have stated that our future is warmer under AGW but your message often seems to down play this. That is our perception generally and I first noted it when CBC radio interviewed you about our unusual winter.
You must realize that a significant problem the great unwashed confronts - including me - is that we are critically disadvantaged in determining fact ourselves, no matter how much "data" is available. This means we have to trust expert opinion. We don't have a choice - we can't verify or validate.
Could you please once and for all unambiguously define your opinion on institutional integrity and the role of consensus in determining best known as a means for us poltroons to determine fact. This in my mind is the fundamental problem with public opinion on matters of science. Hell of a good article in National Geographic this month BTW, addressing this precise problem. Its titled the War on science. It has entirely to do with perception of integrity.
Bruce,
ReplyDeleteMy "messaging" is quite consistent with mainstream atmospheric scientists, include those in my department who have participated in the IPCC. I am communicating what I believe is the state of the science and I believe I am doing so without bias. Keep in mind that the media in general is not communicating well. ..cliff
To add a little clarity, the significant problem with blogs is the tendency for all of us to search for confirmation for our biases. I focus on your "messaging" on JF's theory on polar amplification for instance. That is a bias of mine, mainly because I assumed her theory was accepted by her peers. I like to think i can change that "bias" if it looks like my assumptions were wrong.
ReplyDeleteThe essential problem is that I need trusted expert advice to inform my belief. I and all other incompetents in the domain cannot validate the work ourselves -it is impossible.
That is the essential problem highlighted in the National Geogtaphic article. Well meaning but totally incompetent laymen are drawing their own conclusions based on their own woefully inadequate capabilities rather than look to institutional expertise to be informed. It is a classic case of assumig "common sense" has some value in an uncommon domain.
Anyway, we all do the bias thing, its just a matter of being aware of it and having an ethic of trying to minimize it rather than feed it.... unless bias is all one is really interested in!
The above comment was prefaced by a previous one that appears to have vanished.
ReplyDeleteIt said this: could you comment on the role and validity of "consensus" as a means for laymen to determine best known understanding. If it exists - and in some situations it does not - an expert consensus is the best method for the layman to gain confidence that bias is not dominating the decision. When it comes to institutional trust, the presence of bias is the biggest road block, other than straight up Dunning Kruger effect.
I think if the goal of this blog id to provide "best known' then it is a reasonable topic for discussion.