Today, NOAA released the latest drought update for the U.S., through their Drought Monitor website.
The updated map for Washington State, shown below, indicates normal conditions for western Washington and the western side of the Cascades.
But east of the Cascades, it indicates large areas of moderate drought, severe drought, and even EXTREME drought.
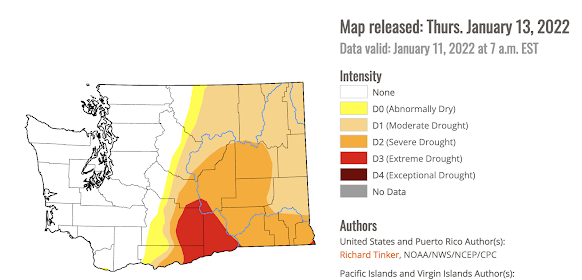
I am very troubled by this drought depiction. As demonstrated below, it simply doesn't appear reasonable.
Such excessive drought depictions are frequently provided by this source. A major issue is that media and politicians pay a lot of attention to the Drought Monitor graphic, and it serves as one source of the ever-present drought narrative that is constantly being thrown around on social and traditional media (see below from CNN).
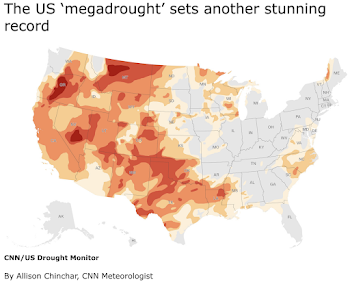
Courtesy of CNN, January 13th.
So is "extreme" or "severe" drought reasonable for eastern Washington State?
Let me provide you with the data and YOU make your own appraisal. As an aside, the NOAA drought monitor is a subjective graphic based on an analyist looking at a number of data sources. It is not objective.
The Data
First, consider the precipitation departure from normal during the past three months (below). Cumulative precipitation is WAY above normal in the west, and slightly above normal ove the majority of eastern Washington.

Snowpack? The critical source of water during the summer? Snowpack is well above normal for the entire state.

River levels? Well above normal in the western part of the state, near normal in the east.


The extreme drought (red) area of the Drought Monitor depiction includes the drainages of the Yakima River, which provides critical water resources for agriculture for that area.
How full are the important Yakima reservoirs? (see below). Mama Mia! The Yakima Reservoir system is HUGELY ahead of normal (blue line--this year, red line--average year). On January 13th the reservoirs are as full as they would normally be on April 1. Plus, we have a huge snowpack that will top off the reservoirs even without any more rain. The Yakima area is in good shape. I mean VERY good shape.
The water from the Columbia River is also important for agriculture, fish, and water usage in eastern Washington.

How about soil moisture in the upper layer (10 cm) around the state? As shown below, most of the state has above normal soil moisture, including much of the "drought" area. And a portion of eastern Washington is near normal (while).


Finally, what about the famous Palmer Drought Severity Index, that includes both temperature and precipitation influences over an extended period of time (see below). Eastern Washington is near normal.

.
What is the predicted flows of the Columbia in mid-May, right before the summer season? Good news (see official prediction below)! Predicted flows coming into the Grand Coulee dam are well above normal.
How about soil moisture in the upper layer (10 cm) around the state? As shown below, most of the state has above normal soil moisture, including much of the "drought" area. And a portion of eastern Washington is near normal (while).
How about deep soil moisture (one-meter deep)? Virtually ALL of the extreme drought area has WAY above normal deep soild moisture (green and blue). The only place that is dry is along the eastern slopes of the north Cascades where there is record-breaking snow above it. That soil will not be dry for long.
The Bottom Line
I don't see how one can argue that portions of eastern Washington are in extreme drought. Or severe drought. Or ANY drought.
Virtually every data source shows just the opposite (and there is more I could have provided to you).
Unfortunately, this exaggeration of drought by Drought Monitor is found in other areas as well. The nation is not well served by exaggerating drought. As a result, poor decisions are made.
And all the resulting drought talk scares the population, and is used by some to exaggerate the impacts of global warming.
NOAA needs to carefully review the approach used for its Drought Monitor graphics and make changes that will lead to a more reliable, useful product.


One more example of agenda driven data interpretation. I am tired of all.of it. And some wonder why we don't "believe" the science.
ReplyDelete"And all the resulting drought talk scares the population, and is used by some to exaggerate the impacts of global warming."
ReplyDeletePretty much says it all. Lather, rinse, repeat.
Have you noticed Lake Mead levels? How is that political?
DeleteGreat information from Cliff with facts provided, thank you Cliff!
ReplyDeleteMy son gave me your PNW weather book for Christmas, it's been a good read so far and has a lot of information I didn't know about until I read it, so thank you for teaching me new things about the PNW weather!
And your posts have taught me a lot for forecasting, and it's been very helpful over the years! Thanks cliff!
Ignore the people that will be rude to you about your opinion, that HAS FACTS provided! They just get offended by someone who dares to have a different opinion than them and CNN.
Thank you Cliff!
Cliff, you need to get on board here. Irrationally scaring the public is how political support is drummed up these days. Nuance neither elects candidates nor passes bills into law.
ReplyDeleteIf I may ask, how is the drought monitor compiled? What data do they draw from, and how is it subjectively interpreted to give the answer that eastern Washington is in drought?
ReplyDeleteExactly. They need transparency in how this information is derived. If they are looking over 6+ months, and Cliff is only looking 3 months, that might explain the difference. Transparency could also dispel the idea that the drought monitor is politically driven.
DeleteOr prove that it is, like most other 'science' that gets spoonfed to us.
DeleteI am wondering if the same dynamic is in play when it comes to Arizona and New Mexico where I'm thinking of moving.
ReplyDeleteI've heard that it takes more than one year to get out of a drought. Is this dependent on the soil saturation?
ReplyDeleteIt’s now widely accepted that if you have good motives, it’s OK to fudge the facts to fit the conclusions. Unfortunately that attitude has decreased public trust in science. It’s no wonder people fear vaccines, when they don’t trust scientific research any more, and think everything is spin.
ReplyDeleteHow do aquifer levels imapct the drought evaluation in Eastern WA? I seems reasonable to conclude less water going in over the course of a year, and the same if not more water going out would lead to a consistent drought condition over time?
ReplyDeleteGood question. Certainly this wet season would help, but aquifer levels might well be low.
DeleteTaking a snapshot of drought conditions on January 13th is silly. Let's put a pin in this and revisit on August 13th. In the meantime, we should increase efforts on educating public on water conservation, building healthy soils, and responsible agricultural processes.
ReplyDeleteUm, so you are suggesting things dry out in the summer in eastern WA? Interesting. The point is looking at the truth behind the alleged long-term "extreme drought" conditions we are being told are happening. The evidence doesn't support that.
DeleteIt appears that we currently have three different individuals using the moniker "unknown" as their signature. Could you please use something else to identify yourself, since it's basically responding to the wind at this point.
DeleteHow long is "long term"? Clearly last summer was extremely dry and they must be including that period, tho it's not clear how they came up with the shadings on the map.
Delete"is used by some to exaggerate the impacts of global warming"
ReplyDeleteBetter to belittle the impacts of global warming.
That way people can continue to go about business as usual in a pleasant manner.
"Don't look up"
Wow, someone actually used a massive entertainment failure that the public has ignored entirely in order to make an entirely unsubstantiated point. Nice work.
DeleteHi Eric- I was being sarcastic- sorry if it wasn't apparent.
DeleteThank you for this article. I have driven through CA in areas shown as moderate or extreme drought on the map yet there were small lakes and ponds scattered all over seen from I5, high rivers, and very muddy farm fields and I was wondering how this could be seen as a severe drought.
ReplyDeleteI'm also curious about the influence of aquifer recharge. Having worked in the central California valley in the past it was common to see rains and winter snow melt do little to influence drought conditions for farmers. They would regularly have to drill new wells to chase the ever dropping aquifers, because a season's rains (or just a shorter time period as in the drought monitor), would do little to help a drought from an agriculture perspective of available surface water.
ReplyDeleteI'm also confused by the statement about river levels since the lower Yakima station at Kiona shows "much below normal" for the timeframe when the drought monitor report was issued. This would be an influence on the report would it not? According to the NOAA website, the USDM "Is not a forecast. Unlike most of the weather maps people see in the news, the U.S. Drought Monitor is not a forecast. In fact, it looks backward. It’s a weekly assessment of drought conditions, based on how much precipitation did or didn’t fall, up to the Tuesday morning before the map comes out."
Looking at the "extreme drought" zone in red, it seems like there is evidence for drought conditions during the days that the USDM was issued. So while I agree that people should be more careful in how they use the information, based on my experience as a hydrogeologist working in agriculture areas, based on the information you presented that shows low soil moisture on the lower Yakima, it is possible that the first week of January would qualify as drought.
I agree with you that with all the snow, and reservoir levels where they are that it is unlikely this should be the case in the coming weeks. But the USDM isn't looking at the future and where a snowpack and reservoir levels are going to help in the future, it looks at the past to determine where things are now. Seems like several of the points raised here are red herrings not directly addressing the actual purpose of the USDM. Unfortunately the same is done in the other direction by people who scream about the end of the world because of one week of extreme drought in one part of the state that is most likely going to change in the coming weeks. But it isn't the job of the report to predict the future, that information can be found elsewhere, and even according to NOAA, the forecast is good for water and drought reduction.
I found this data analysis quite interesting. I really appreciate posts like this one - I agree that the drought has been used to drive a potentially misleading narrative. But I'm having some trouble getting my mind around this one. Here in Spokane we had a very long dry spell last spring and summer, setting records for days without measurable precipitation. I also noted last year that ski season had an abrupt ending in Feb/Mar - which is usually a time when snowpacks are still expanding. As mentioned in some of the other comments, it's difficult for me to justify how it is that the soil moisture and aquifer levels are back to normal or even above normal in such a short time. Can you address this further?
ReplyDeleteThose of us who are not scientists, let alone weather scientists, are better not pulled into scientific arguments. What would be more useful is explaining whatever it is that the drought index measures, and why it often does not apply. This seems to be a particularly often problem in eastern Washington.
ReplyDeleteMy analogy would come from mapping. Map makers know what they want to measure and depict, they do it more or less successfully. It somehow represents a reality of the physical world. The may user, on the other and, is looking for specific information which may or may not be well depicted on that map. Reality may have changed, the map maker almost always gets some things wrong, and the map reader likely makes their share of mis-readings.
https://www.livescience.com/21469-drought-definition.html
DeleteI agree with this blog to an extent. The mapping is off based on this season's precipitation total (rainfall and snowpack. However this winter season as been an anomaly compared to previous seasons. The west and the NW has been in drought for years. I live in the Oregon Southern Willamette valley and follow the weather stats almost daily. Our temperatures continue to be higher and rainfall less almost every year. In fact, NOAA's new climate normals based on Eugene's weather 1991-2020 overall was dryer and warmer. https://www.wrh.noaa.gov/pqr/pdxclimate/EUG.pdf Also, the higher rainfall and snow recently experienced in NW Oregon and Western Washington state missed SW Oregon and Southern Willamette valley. In the last week Eugene has had about 0.15" rain. Our normal is 0.19" per day. Currently there are not any weather makers per the PDX latest weather discussion. Let's hope this is a temporary winter pattern, and the rains and snows will return not just for NW OR and Western WA state.
ReplyDelete