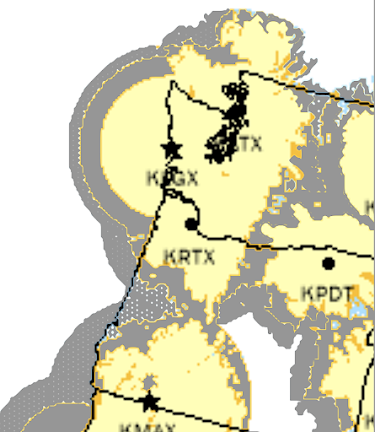
As I have noted on several occasions, Oregon has some of the worst weather radar coverage in the nation, with a huge radar gap off its central and southern coast and another in eastern Oregon
Important weather features approaching the coast can be missed, reducing the skill of short-term forecasts from western Oregon into western Washington. Perhaps including the missed Portland snowstorm of February 22.
Below is a National Weather Service radar coverage map, with yellow indicating the regions of low-level coverage (coverage below 3000 ft above ground level). The coverage would be much worse near sea level. Western Washington and the Washington coast have good coverage thanks to the Langley Hill radar (Hoquiam), the Camano Island radar north of Seattle, and the Portland radar.
But most of the Oregon Coast has no coverage. The Portland radar is blocked by the coastal mountains at low levels and the Medford radar is poorly placed, positioned so high (7500 ft) that the radar beam reaches the coast at 13000 ft and is even higher offshore.
Eastern Oregon is a radar disaster, with no coverage for vast areas.
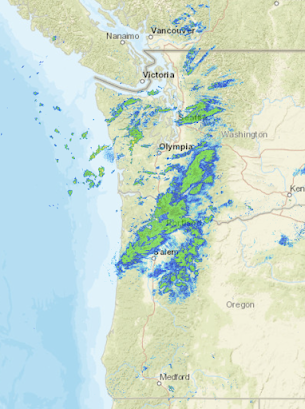
So what are we missing with such poor radar coverage? What would we see if a radar was there?
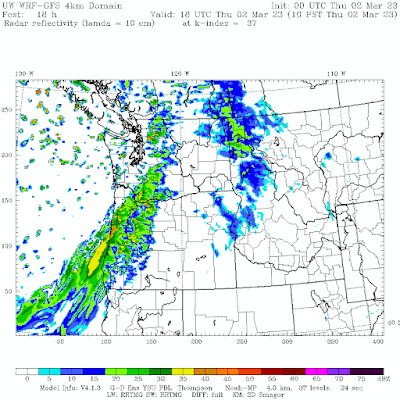
I think I can tell you, using our regional high-resolution forecasting system.
Believe it or not, we can simulate what a radar image would be like using the 3-D precipitation produced by forecast models.
Consider yesterday evening at 6 PM. A short-term (2-h) forecast predicted heavy precipitation along and offshore of the central and southern Oregon coast. Western Oregon is experiencing showers, and some precipitation has crossed the Cascades into eastern Oregon.


In other news, this has been the coldest first third of March for Western Washington since the very cold first third of March, 2019.
ReplyDeleteJust checked the numbers...this is not true for any of the major stations I checked.
DeleteThe information source I used is the National Weather Service NowData.
DeleteIt is the case that for 3/1-3/9/23 (3/10 data isn't available until 3/11 for most sites) the following sites have a colder monthly average temperature than for any first 9 days (yes, technically not the entire first third of the month but I suspect my claim will still be true once today's data is available) of March since 2019:
Quillayute Area, Seattle City Area, Bellingham Intl, Everett, Everett Paine Field, Forks 1 E, Hoquiam Bowerman AP, Humptulips Salmon Hatchery, Longview, Mayfield Power Plant, McMillin Reservoir, Mud Mountain Dam, Quillayute AP, Renton Municipal AP, Seattle Boeing Field, Seattle Tacoma Airport, Shelton AP, Cedar Lake, Concrete PPL Fish Station, Cushman Powerhouse #2, Diablo Dam, Newhalem and Upper Baker Dam.
The only sites I checked for which my claim was false were Port Angeles AP (March 1-9, 2020 was colder) and Monroe (March 1-9, 2020 had the same average temperature as March 1-9, 2023).
The mean monthly temperature anomaly for all 24 sites listed above is -4.4F as of this writing.
I'd be interested to know what data you used.
Doctor Mass,
DeleteWould it be too much to ask for you to share with your readers: the data which shows which "major stations" have had a colder (i.e. mean temperature) first third of March (3/1-3/9) than this year since any year subsequent to 2019 (i.e. 2020-2022)?
Thanks,
Your response is much appreciated
If you plot the highest max temp at say Olympia for the first 10 days of March, here is the list from coldest to warmest... this year is number 4, the coldest since 1971.
Delete1 1951-03-10 44 0
2 1956-03-10 47 0
3 1971-03-10 48 0
4 2023-03-10 49 2
5 1997-03-10 51 0
- 1991-03-10 51 0
You might use this website to confirm this:
https://xmacis.rcc-acis.org/
Thank you for clarifying and providing me with a new information source. My point was that the first third of this March has been the coldest in terms of overall mean temperature for nearly all of Western Washington since 2019, and also that the first third of March, 2019 was particularly cold - the coldest, in fact, at SeaTac AP (and I suspect most locations in Western Washington) this century. Interestingly, March 2019 started notably cold but also had an episode of extreme heat from 3/18-3/20 during which SeaTac AP reached its monthly record max temp of 79F on 3/19 and 3/20.
DeleteCliff, is the "Oregon Gap" the result of federal and/or state neglect? I assume many residents who live is these "Gap" areas have expected that at least some portion of their taxes pay for such technology to their benefit.
ReplyDeleteI suspect it's a little of both. The local and national politicos here only seem to care about whatever "woke" cause is active at the moment, and to hell with the locals who care about catastrophic crime rates and widespread destitution apparent everywhere you look. Take a drive around my neighborhood in Portland, I've talked to visitors from Third World countries who exclaim that it's much worse here than in their own hometowns.
DeleteJuan Browne, a Boeing 777 airliner pilot and polymath extraordinaire who also runs the Blancolirio aviation safety channel on YouTube, has a 25-minute assessment of the current water situation in California:
ReplyDeletehttps://www.youtube.com/watch?v=Ehk6QzKRw3g
The Blancolirio video has lots of interesting information concerning weather forecasting topics as these relate to the series of storms now headed for California. The video also has lots of good information about the operation of California's water storage reservoirs and about how California water management authorities are working the recent storm events.