November 29, 2024

Finally.....the First Freeze in Parts of Western Washington

It is the end of November, and until a few days ago, large areas in western Washington had not yet to experience temperatures of 32F or below.   But that situation is now over....frost has returned to Seattle, Bellingham, and some other locations near Puget Sound.   

It is interesting to plot the average day of first freeze over the region (NOAA map, below).

Over the higher elevations east of the Cascades, the first freeze generally occurs in September. 

 October brings freezing conditions to the lower elevations in eastern Washington and lower elevations away from the water over western Washington.  

Early November beings freezing over much of the lowlands of Western Washington and Oregon, and late November for some Puget Sound locations and coastal Oregon.  

December on the southern Oregon coast. 


Consider recent temperatures at a few local reporting stations during the past few months.

At Seattle, yesterday (Thursday) morning was the first to hit freezing (horizontal blue line).  Same with Bellingham.   Seattle and Bellingham are warmed by the proximity to mild water surfaces.

In contrast, Olympia, which is distant enough from the water to have a more "continental" climate, several days have reached freezing during October.

But if you really like early frosts, head over to eastern Washington, where the warming influence of the Pacific and Puget Sound are greatly attenuated.  

For example, in Yakima, from late September forward, many days this fall have hit the freezing mark and below.

Similar situation in the Tri-Cities (Pasco shown below).

What is the frost forecast for the next week?

High pressure will building over the eastern Pacific and western WA locations like Seattle will progressively warm, so no frost in the forecast and progressive warming (an ensemble of many forecasts is shown below).

In contrast, cold, dense air will remain within the Columbia Basin for a long time, with Yakima enjoying temperatures in the upper 20s for a while.

Good for making ice wine perhaps.😀😋


November 26, 2024

A Pleasant No-Drama Thanksgiving Weekend: But A Big Surprise

After a stormy previous week, we can look forward to a relatively dry and temperate Thanksgiving holiday, without the drama of significant storms.  

Of interest, it will be MUCH warmer in western Washington than in the Columbia Basin, which has moved into the typical mid-winter cloudy/cool pattern.

To illustrate, the weather.com forecast for Seattle predicts consistent temperatures, with highs in the mid to upper forties, no frost, and minimal chances of precipitation.    Lots of opportunities to burn off some of the excessive calories from too much eating.


But consider the forecast for Kennewick in the Columbia Basin (below).  Every day, it will drop well below freezing at night, with highs in the upper 40s on most days.


The best day of the weekend should be Sunday when a big upper ridge of high pressure will develop over the eastern Pacific (see 500 hPa map--about 18,000 ft-- at 7AM Sunday).  Expect plenty of sun on Sunday afternoon.


But it will get even better than this.  A HUGE ridge will develop on Monday and Tuesday (the map on Tuesday at 7 PM shown below).  Even more sun.  Totally dry.


The Big Surprise

La Nina is dying.  Below is a plot of the sea surface temperature anomaly (difference from normal) for the central tropical Pacific.   Last year, there was an El Nino with sea surface temperatures above normal (orange colors).  Then a weak La Nina started in August with temperatures dropping very modestly below normal.

But shockingly, during the past weeks, La Nina collapsed with temperatures near normal.


The recent summary of sea surface temperature forecasts (below) keeps a very weak La Nina for a few months before it collapses.    The real world sea surface temperatures suggest that the models are too slow.

These forecasts suggest a near-normal snowpack this winter and plenty of storminess.


November 24, 2024

The Real Story Behind Tuesday's Windstorm and Massive Power Outage

 If you read media reports, such as in the Seattle Times, one is told that the localized winds on Tuesday evening were the result of an unusually deep "bomb cyclone".   

Some of the more irresponsible outlets stated that this event was the result of climate change.


As described here, the truth is far more complex and nuanced.  

Reality Check

A major issue is that the intense cyclone was well offshore, with only modest local impacts from the storm's strong winds.

 Consider the highly accurate regional forecast of sea level pressure and near-surface winds (color shading) at 7PM, near the height of the wind event over western Washington.  The storm center was about 380 miles offshore!

The powerful winds directly connected to the low center were hundreds of miles out in the Pacific, with a band of strong winds associated with a front over the coastal waters of the region.


You will notice a strong pressure difference (gradient) across the mountains, with higher pressure to the east.  THAT pressure difference is very important since it helped drive the easterly (from the east) winds over the western slopes of the Cascades.

The low pressure offshore contributed to the pressure gradient across the Cascades, but so did unusually high pressure west of the Cascade crest, something shown by the pressure anomaly (difference from normal) map below.


This inland high pressure was associated with COLDER than normal air east of the Cascade crest (see temperature map at around 5000 ft below).

In short, the critical pressure gradient across the Cascades had two contributors:  low pressure offshore and high pressure inland.    Yes, the powerful offshore low contributed, but a much weaker low, closer to the coast, could have done the same thing.

The winds approaching the crest level of the Cascades were strong from the east/southeast, as shown by the weather map at 850 hPa (around 5500 ft).  The wind barb shows 35 kt from the east-southeast.  At this level, you can see the cold air (blue colors) banked up against the eastern slopes of the Cascades. 


Finally, we can view the simulated vertical structure of the air approaching the Cascades that night near Stampede Pass (see model vertical sounding below).  The x-axis is temperature and the y-axis is height.  On the right are the winds.   The red line is temperature and the blue line is dewpoint. 

Strong southeasterly winds were approaching the crest, with a stable layer (temperatures not falling much with height) near crest level.  And there is a reversal of the component of the wind towards the mountains aloft.   These are very favorable conditions to produce a lee side (in this case westside) windstorm.

And that is EXACTLY what happened.  The area east of Puget Sound experienced strong winds not directly associated with the "bomb" cyclone but from something else: a downslope wind event.

Below is an east-west vertical cross-section across the Olympics and Cascades from a very high-resolution model forecast at 7 PM, with winds shown by colors (purple is the strongest, followed by red).  There are strong winds along the coast, but a separate area of high wind speeds is found on the western side of the Cascades.  That is the downslope wind event that caused all the problems.    Look closely and you will notice a waveness in the wind strength associated with atmospheric gravity waves.


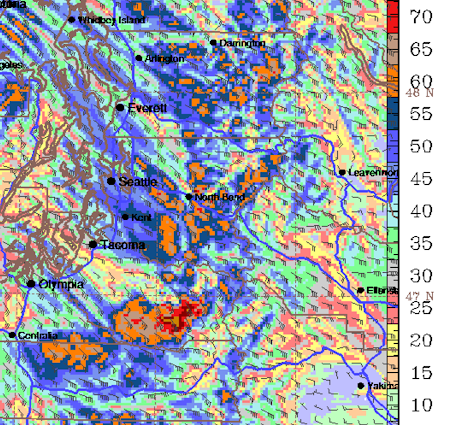
Examining the surface wind speed and direction at the same time for western Washington, you can see the strong winds (kt), indicated by orange and red colors.  Look closely and you can see some waviness and non-uniformity in the winds.

There was a lot of structure in the winds on Tuesday evening, with locations only a few miles away experiencing very different wind strengths.  The winds were also very gusty in nature.  At my home, there were gusts to around 60 mph one second and nearly calm the next.  These are characteristics of downslope wind events.

Below are the maximum wind gusts on Tuesday.  HUGE variation both locally and regionally.  Winds were less over the South Sound since this area was in the wind shadow of Mt. Rainier.   Lesser winds west of Puget Sound.


Yesterday I surveyed the damage around NE Seattle and was stunned by the contrasts.

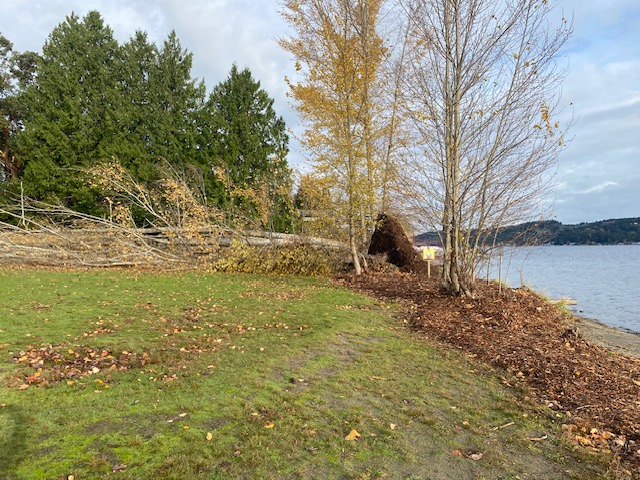
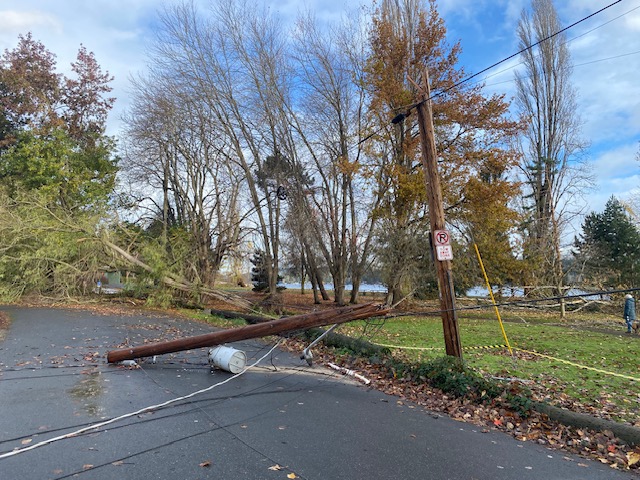
At Mathew Beach Park, lines of huge trees were downed and a power pole was snapped off.


A half mile away, there was little damage.   A mile away at Magnuson Park, some areas were untouched, while nearby areas looked like a clear cut (see below).


This was an extreme local event and a lot of meteorological pieces had to come together to make it happen.  Much more than an intense low center almost 400 miles off our coast.

I worry that the media has not been accurate in describing the origin of this event and its great predictability.  "Bomb" headlines and other hype have replaced careful journalism.  Importantly, saving lives in the future relies on the truth about such events being accurately communicated by the media and other information sources.  


November 22, 2024

Are Eastern Pacific Cyclones Become More Frequent or Stronger?

 During the past three days, I have received several calls from media folks asking the same question: 

Are storms like this week's "bomb" cyclone becoming stronger or more frequent due to global warming? 

If not, will global warming cause such increases in the future?

The answer to these questions is quite clear:  NO.

There is convincing scientific evidence that our region has not seen an increase in such storms and that a warming planet will not bring more meteorological "bombs" into our region.

First Some Terminology

A midlatitude (or extratropical) cyclone is a low-pressure center with winds rotating counterclockwise around it in the northern hemisphere.   The strength of the cyclone is generally quantified by the central pressure, although size is also important.  Generally, the lower the central pressure, the stronger the cyclone and the more powerful the winds.

As shown by the figure below, cyclones generally form in regions of strong horizontal temperature change....in fact, such temperature contrasts are the fuel of such storms.


Regarding central pressures, garden variety storms in our region have pressures around 990-1000 hPa.   Strong storms perhaps 980-990 hPa, and powerful cyclones have pressures of t965-980 hPa, with extreme storms even less.

Tuesday's storm dropped to an astounding 943 hPa, tying the record for the past 70 years.

Cyclones that rev up particularly rapidly are called "bombs".....and the media has certainly fallen in love with this term.   By definition, bomb cyclones deepen by 24 hPa or more in 24 h.  This definition is completely arbitrary.  Really just for fun.

Are Local Cyclones Getting Stronger?

The answer is clearly no.  There has been no increase in the frequency or intensity of landfilling or near-shore cyclones in our region.  

Most of the famous local cyclones occurred during the early to mid-20th century, with the last major landfalling cyclone in 2006 (the Chanukah Eve Storm).

Another way to demonstrate the lack of increase in storms is to plot sea level pressure over time at a point on the Washington Coast (Ocean Shores).   As shown below, there is no evidence for an increase in the lowest pressures (say below 980 hPa).


Will Global Warming Increase Strong Windstorms Over the Region?

A group of us at the UW (in association with the UW Climate Impacts Group) did a formal study of this question, funded by Seattle City Light.  

We made use of a state-of-science regional climate model driven by an ensemble of Global Climate Models.   

This research did not find an increase in extreme winds over the region (we examined several locations).  A graphic from the analysis of the extreme wind trends through the end of the century is shown below.

There are good scientific reasons to expect little change in the intensity of midlatitude cyclones over our region.

For example, global warming preferentially warms the Arctic in the lower atmosphere, thus weakening the north-south temperature difference that drives the storms.   On the other hand, the temperature change is strengthened aloft, with the result being a wash for the storms.

In summary,  natural variability and processes sometimes can come together to produce very intense cyclones like the one we experienced on Tuesday.

We experienced a rare, extreme event and there is no reason to expect that such storms will become more frequent as the planet slowly warms.


November 21, 2024

Tomorrow's Windstorm in Four Acts

 Each atmospheric "play" is different and according to high-resolution forecast models, I can describe the four "acts" that will unfold tomorrow.

The main protagonist of this drama is strong, but small, low pressure center that will move northward up our coast. 

Note to local media:  not a bomb cyclone. 😕

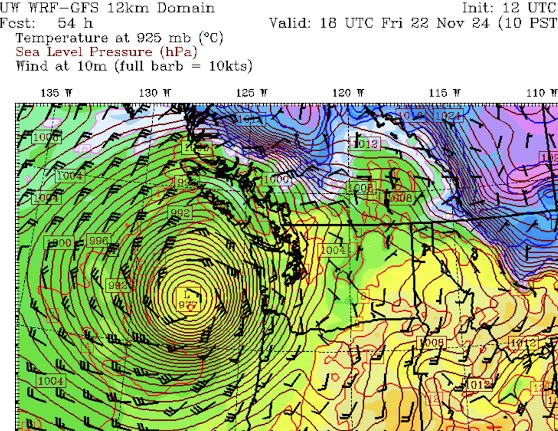
Below is a view of the low at 4 PM Friday (the lines are isobars of sea level pressure, the color shading shows low-level temperature.)

Nice looking low, with a central pressure of 981 hPa.


Act 1:  1 AM Friday Morning

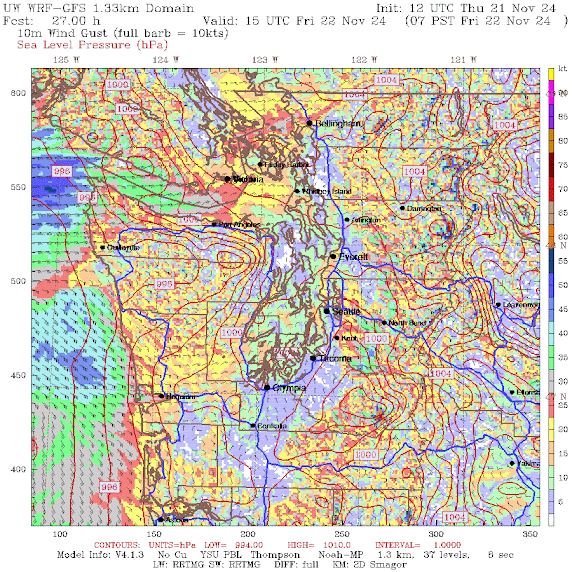
The forecast maps, with sea level pressure and near-surface winds (shading), are shown below.

As the low approaches, the pressure differences across the region will increase, with lower pressure towards the Pacific.  Easterly winds, particularly in east-west gaps, are apparent. The forecast map below predicts strong winds exiting the Fraser River Valley and then heading across Bellingham, and the San Juans, with strong easterly flow over the western portion of the Fraser River Valley.

Downslope easterly winds are developing along the western slopes of the Cascades and pushing towards Kent and south Seattle.  Winds picking up around the western end of State Rt. 2.  

Act 2.    7 AM Friday. The Games Afoot

Southeasterly winds are increasing on the coast and the easterly winds hitting Seattle to Kent are increasing with some gusts to 30-35 mph.  Far weaker than Tuesday evening, but enough to get folks nervous.


Intermission

Act 3.  4 PM Friday. Crescendo 

This is what the audience was waiting for.   With the offshore low making its closest approach, winds along the coast speed up considerably, with gusts reaching 50-75 mph.   Some power outages along the coast.  Over the lowlands of western Washington, winds turn southerly, with gusts to 30-35 mph around Seattle and 30-45 mph over northwest Washington.


Act 4.  10 PM Friday. Denouement  

As the low center pulls away, the wind rapidly weakens along the coast but stays gusty around the Strait of Georgia and NW Washington.


I hope you enjoyed the drama.

November 20, 2024

A Near Perfect Forecast of Yesterday's Event. The Next Windstorm Comes into View

 The next time someone makes a weatherperson joke, remember the nearly perfect forecast for yesterday's wind event over Washington.

No longer appropriate

For days, the models correctly predicted the rapid development of the cyclone offshore and the high pressure inland. The combination resulted in strong easterly winds that descended the western slopes of the Washington Cascades.

You want to see how perfect the forecasts were?   Here is the wind speed forecasts provided to Seattle City Light from the UW's WindWatch website, which uses the best of the regional weather prediction models.

This graph shows the highest observed wind over Seattle (black line) and the forecasts made starting Monday afternoon.  

You don't get much better than that.  Earlier predictions were just as good.


A lot of attention was given to the strong cyclone/low-pressure system that developed offshore.   It was an impressive low that not only rapidly developed, but deepened to 943-943 hPa, slightly beating or equalling the historical record.

The 18-h forecast by the UW weather model, the GFS, was 943 hPa at 10 PM last night.  Very nice.


Not impressed?   The 72-hour forecast was almost identical.


Something has happened that has not been sufficiently understood by society.  

Weather prediction technology has improved immensely in skill and detail.

The above results are not a fluke.... I could show you a dozen more, including the predictions of devasting extreme events, such as the Lahaina wildfires or heavy precipitation from Hurricane Helene.

There is so much talk about extreme events and global warming.  

But the truth is that deaths and injuries from extreme events are declining rapidly because weather predictions are so good.  Such deaths and injuries could be greatly reduced further if governments and other institutions would better use highly skillful weather prediction.

The Upcoming Storm

Another midlatitude cyclone will be moving up the coast on Friday.   

On Friday morning at 10 AM, a 977 hPa low will be directly east of the Columbia River outlet.   Much weaker than yesterday's storm, but much closer.


By 7 PM Friday, the low will be making landfall on Vancouver Island as a 980 hPa low.


Compared to Wednesday, this storm will produce strong winds on the coast, but weaker winds over the western WA interior.

For example, at 1 PM Friday (below_, fearsome winds on the coast, but "only" gusts to around 25 kt  (roughly 30 mph) in the interior.


Here is the latest guidance for our friends at Seattle City Light or Seattle--not so bad.


November 19, 2024

The Storm Reveals Itself. The Eastside Wind Threat

The latest satellite image shows the rapid development of the offshore storm.

The visible satellite image around 9 AM was stunning, with low-level clouds swirling around the low center (the orange arrow points to the low center).

Stunning.

Here is the blow-up of the clouds around the low center.  The circulation is obvious.


Strong, rapidly developing storms not only have rising motion that produces clouds, but intense sinking motion that produces a "slot" dry air coming in from the southeast.   

We can view the "dry slot" using satellite images that reveal water vapor content in the upper and middle troposphere.  Such an image is shown below, with blue indicating very dry air.    This is a strong storm... no doubt about it.


The latest National Weather Service surface map (and I do have some issues with the quality of their analyses) shows the storm at 7 AM, with an analyzed lowest surface pressure of  974 hPa.   The storm is rapidly deepening today, so the pressure will fall considerably more.


As I mentioned in my previous blogs, although strong coastal winds are an issue, my biggest concern is for strong winds east of Puget Sound tonight.  

The models are still going for threatening winds....with the clear threat of substantial tree damage and power outages.

The latest European Center forecast predicts winds exceeding 70 mph on the east side of Puget Sound, particularly towards the western Cascade foothills.  These are all easterly and southeasterly winds....not the usual direction of strong local winds.


The NOAA/NWS HRRR model, run at high resolution, is similar but extends strong winds over Whidbey Island and the San Juans.


The UW Model is also threatening with strong winds on the eastside, gusting to 50 kts (around 57 mph) at 10 PM. 


The maximum wind over Seattle based on dozens of predictions is predicted to hit 45-60 mph...from the east (see below). 


Bottom line:  strong winds from the east, gusting to 40-70 mph, will occur east of Puget Sound and will be stronger towards the Cascades.  Expect substantial vegetation damage and many power outages.    Driving down streets with lots of trees might not be a good idea after 6-7 PM if you living in the vulnerable areas noted above.

_________________________________________

Addendum:

Here is the 1 PM satellite image...the circulation has become very, very obvious.


Some satellites can measure low-level winds by measuring wave action...called scatterometers.  Here are the surface winds from a scatterometer around the storm around 12:30 PM PST.    The intense circulation around the low is obvious.


The Direct Connection Between Northwest Weather and Los Angeles Santa Ana Winds (and Wildfires)

 It is not an accident that while Los Angeles experiences sustained Santa Ana winds, the Northwest enjoys sunny, dry weather. As I will show...