November 12, 2012

Meteorological Triumph with a Warning

The forecast for Sandy was a technological and scientific triumph, one that could not have happened more than roughly a decade ago.

And it was much more than a good weather prediction.  The National Weather Service's water level forecasts were stunningly accurate, as was its effectiveness in communicating the threat to the public and governmental authorities.


The most populated metropolitan area in the U.S, with a population of approximately 20 million people and located on a vulnerable coastline, is hit by a category 1 hurricane at high tide.  Amazingly, the death toll was limited to about 100 people, with most of those aware of the storm and deliberately putting themselves into harm's way.  Just stunning.

Sometimes it takes a while for a profound change to become evident, but the prediction of Hurricane Sandy had finally brought into the public eye a fact that that has become increasingly evident to meteorologists:  current weather forecast models often possess substantial forecasting skill for 5-10 days ahead.   Headlines in many newspapers and media outlets have acknowledged the success and the value of the National Weather Service has been acknowledged by folks of all political preferences.

What has changed?  What have we learned that has enabled this forecasting tour de force? And did this event reveal current or future problems for U.S. weather prediction?

Lets start with the extraordinary forecast of the best global forecasting system:  the European Center For Medium Range Forecasting. 

Here is the verification at 5 PM on October 29th.
8.5 days before landfall, it had a major storm, but it was about12h too slow.

But by 5.5 days before landfall, the prediction was nearly perfect in placement...and it held on to that solution until landfall.

The U.S. model, the GFS, initially took the storm off to the east, but by 3-4 days before landfall it had the correct track.  The National Hurricane Center staff, viewing all sources of guidance, had an excellent forecast available days before landfall.  Here is the verification, compared to their performance of previous hurricanes.  For the last two days before landfall their track error was less than 50 nautical miles, far better than the average track error for 2007-11, and the intensity error was 12 knots or less for entire period shown.  Very impressive.

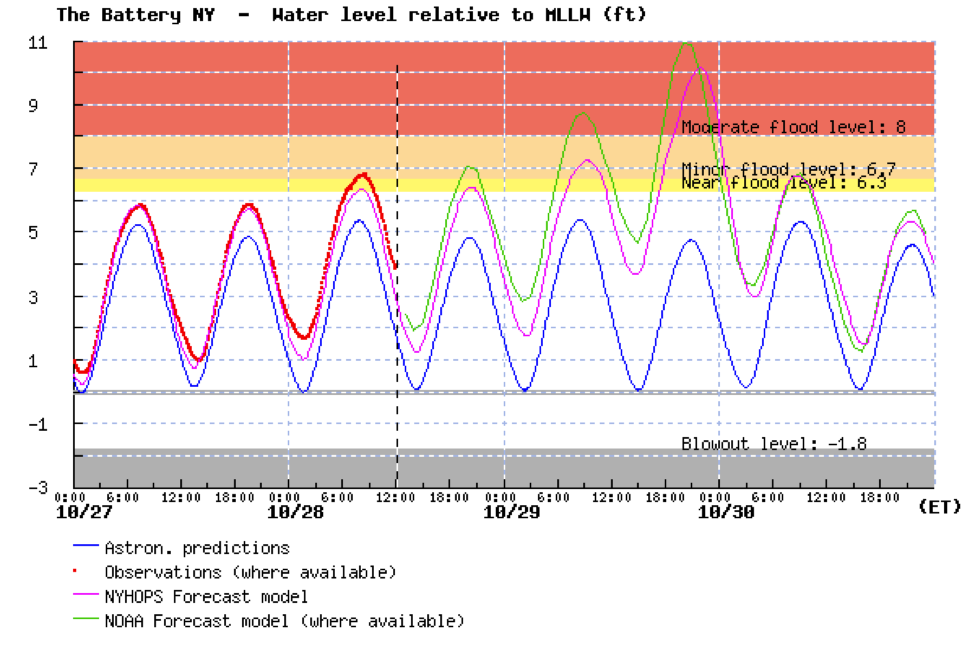
The forecasting process included feeding the projected path and intensity into models of the coastal water level, using tools such as the Sea, Lake and Overland Surges from Hurricanes (SLOSH) model.  This model predicted historic flood levels on the 29th and clearly identified the areas in risk (samples below).  A big question is whether the seriousness of these objective forecasts were properly communicated to the public and local officials.


Now if this was a one-off success, one could brush it off as luck.  But objective verification scores suggest that during the past decade weather prediction has greatly improved...particularly in the medium ranges (4-8 days).

The following graphic, based on the performance of the European Center Model,  says it all.  This shows the skill about halfway up in the atmosphere with higher values (closer to 100%) being better. Shown is the skill for 10 days (yellow), 7 days (green),  5 days (red), and 3 days (blue).  The top line of each color is the Northern Hemisphere and the bottom the Southern Hemisphere.

You notice that forecasts have improved at all projections, with the greatest progress for the 7 day prediction.  But what is perhaps most stunning is that the difference between the northern and southern hemispheric prediction skill has gone from large (NH better) to negligible. There are a lot more surface and upper air reports in the NH.  What is equalizing the skill?   We know the answer:  satellite data.
The vast majority of the data used to initialize (start) our weather forecast models troday is from satellites, and there are about the same about of satellite data in both hemispheres.   Most of these satellites are American.   There are no longer data voids over the oceans (like the Pacific!).  With lots of satellite data, much better forecast models (better resolution and physics), and improved data assimilation (how we use the observations to provide a good starting point for the forecasts), there has been a revolution in prediction.  And this is really evident at 5-10 days where we had very little skill before 2000.
Six-hour coverage of (a) polar orbiter soundings and (b) geostationary satellite water vapor/cloud track winds
 But for all the successes in forecasting Sandy, there were warning signs as well, particularly for the U.S. weather prediction efforts:

1.  The U.S. model was clearly inferior to the European Center's prediction, particularly 4-8 days out.  Why?  Our model has less resolution, uses less data, and has other differences.  We need to figure this out.  Quickly.

2.  The U.S. high-resolution models did not do as well as the global (lower resolution) models.  Specifically, they tended to greatly over-intensity Sandy over the ocean.  The HWRF model, upon which a large amount of money has been spent, was a notable poor performer.  There is an essential flaw in our high-resolution models that must be addressed (some scientist think the problem is in the cumulus parameterizations...how the model deals with unresolved convection).

3.  Clearly, satellite data is very important, and it now appears there will be a significant gap in polar orbiter satellite coverage in a few years.  We need to objectively quantify the impacts of losing this satellite and figure best patches  (e.g., better data assimilation approaches) until a new one can be launched.


Sandy was a meteorological triumph, but let us not forget the custom of the ancient Romans, when a successful general would enter Rome after a great victory.  A slave would accompany him on his chariot, holding a golden wreath above the hero's head, whispering in his ear "Respice te, hominem te memento" ("Look behind you, remember you are only a man"). We have done well, but should not rest on our laurels. The U.S. weather prediction enterprise can do better, much better.

November 10, 2012

Cold and Frost

For many Northwest residents this morning was the coldest by far this fall, with some western lowland locations dropping into the lower 20s.   Frost is widespread and in some places fog is laying down a formidable coating of ice.  "Black ice" season has begun.

Take a look at the temperatures on both sides of the Cascades for the past four weeks at Spokane, Sea-Tac, Olympia and Pasco--today is the coldest for all of them, with cold air aloft, few high clouds , and relatively light winds.. This combination allows the surface to radiate heat to space without a lot of mixing of warmer air down from above.
Here are the 24-h minimum temperatures ending at 7 AM Saturday.  Quite a range...low 40s near the water, lots of 20s in the western Washington interior, with Olympia getting down to 21F (and you though Olympia was full of hot air!).  Some teens and single digits in the mountains, and 20s in eastern Washington.


But the coldest regional temperatures in this kind of situation are usually in the valleys over the uplands of eastern Oregon.  Here is the proof (only showed temps below 20F).  Teens are nothing there and several locations had single digits.


Today will be a cool day (highs in the mid-40s) and many of you will see some sun as the fog and low clouds burn off.  Unfortunately, the next weather system is moving in more quickly than expected a few days ago, with rain hitting the coast early Sunday and reaching the western interior by roughly 1-2 PM that afternoon (see graphic)--so enjoy the outdoors today.  It will be perfect weather for raking leaves (my task this morning!)
Forecast precipitation for the 3-h period ending 1 PM Sunday. Note that "cin" means hundredths of an inch (32 is .32 inches in 3 hour)
 Let me end this blog on a personal note.  Yesterday, Amy Bell of the Technology Alliance reminded me that Friday was Carl Sagan Day (see graphic).   Many of you know about him--he was not only one of the nation's leading astronomers, but perhaps the most effective communicator of the excitement and importance of science of the past fifty years. 

What you might not know is that this blog would surely not have existed without him.  I was an undergraduate at Cornell and was really interested in both astronomy and meteorology.  Sagan took me under his wings and we worked together on a model of the Martian atmosphere (my first publication).   He impressed on me the need and importance for scientists to communicate directly with the public: that this is an essential requirement if science and society are to flourish.  His impact on me was profound and this blog and my work at KPLU are an outgrowth of this influence.  Sagan was not afraid to talk about the societal implications of his research, be it about the sustainability of our planet, the potential for nuclear winter, or the need for a scientifically literate population. When KUOW's Steve Scher gave me an ultimatum that I could only talk about weather on his Weekday program, and never about science/math education and the implications of my science, I thought of Sagan and knew what he would counsel.  Better to be kicked off KUOW than compromise important principles.

Sagan is surely missed, but his influence and importance continue today.

Carl Sagan and me on my graduation day.  I look a bit younger!

A Wet Transition for the Pacific Northwest

This week, a very El Niño-like atmospheric pattern is bringing needed precipitation to central and northern California. Reservoirs are filli...