April 28, 2014

How can we be SURE about the upcoming Northwest heat wave?

It is going to get warm west of the Cascades, and meteorologists are very sure about it.

But why are we certain about the warm-up this week when sometimes our confidence is far less?

The answer:  ensembles of many numerical weather forecasts

For example, the U.S. National Weather Service and the Canadian Meteorological Center both contribute 20 global forecasts, twice a day, to create the North American Ensemble Forecast System (NAEFS).

 If these forecasts are mostly on the same page, one has a lot more confidence in the forecast.  If they are very different, less confidence.


So lets take a look at the latest NAEFS forecast for Seattle.  First, the complete output for several parameters.
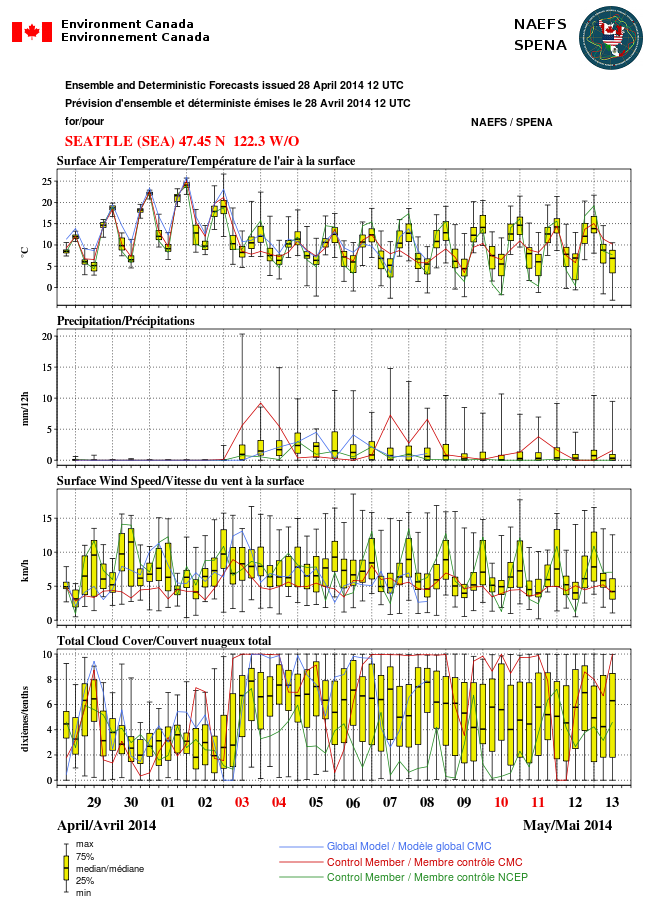
You notice a lot of the data points are shown with what we call a box and whisker plot.   The median of all the forecasts is shown by the horizontal line in the middle (half of the forecasts are above and below).   50% of the forecasts (25% below the median and 25% above the median) are within the yellow box.  The extremes of the ensembles are shown by the "whiskers."

Looking at the second panel above, the models are in great agreement that there will be no rain through May 2.   Temperatures are shown every 6 hours (top plot).  You notice temperatures are warming rapidly the next few days, with the models in substantial agreement on the high temperatures (little spread). So we have confidence in this prediction. You will also see that a cool-down is predicted on May 3, but the agreement is less.

The European Center has a VERY good global ensemble system and  here is the ensemble forecast for temperature at about 5000 ft (850 hPa).  The mean of the ensemble is shown by the blue lines--the mean of the ensemble is often a very good forecast.  Quite warm...16C reaching us at that level.  The shading show a measure of how much the ensembles vary (standard deviation).   VERY LITTLE VARIATION, which mean a very confident forecast.


So buy that bag of ice...you WILL need it.   And lets end by looking at the high resolution (4km)  WRF forecast for surface air temperature and wind...which should be very skillful based on the above. Tomorrow at 5 PM, should get to around 70F over western Washington, warmer in the Willamette Valley.  You see the easterly flow?  That will really rev up the temperatures by removing the marine influence and warming air  by compression as it sinks west of the Cascade crest.


Mid 70s on Wednesday afternoon at the same time.


 And looking at the 12-km forecast for Thursday at 4 PM (May 1), temperatures get up near 80F over the western lowlands and the Columbia Basin  But you notice that the winds have switched directions and have begun to flow from offshore...this will be the last warm day.  In fact, the last warm day of the sequence is frequently the warmest.


With easterly flow, the warmest temperatures on several of the next few nights will be over the western foothills of the Cascades (see example below for 8 AM Thursday).  Why the foothills?  Because that is where the air had been sinking and warming as it descending the slopes.


\

April 26, 2014

April Heat Wave!

Get your shorts out.  Stock up on sun tan lotion.  Make sure you have ice and cold drinks.   Because some of the warmest April/early May weather we have seen in over a decade looks increasingly probable for Wednesday and Thursday of the upcoming week.  Maybe even reaching the big EIGHT-OH!


At this point most of the leading models are going for this warm forecast, so I feel pretty confident telling you about it.

Let me show you the 12-km UW WRF model forecasts for this week.    First, we have to get through a some rain tonight and showers on Sunday...sorry folks.  April showers are required.  But then on Monday and Tuesday, upper level ridging  (high pressure) start building over the eastern Pacific.  Here is the upper level (500 hPa, around 18,000 ft) maps  for 5 PM Monday and 5 PM Wednesday.  The will be  a huge ridge developing over the West Coast with very large north-south extent.


 This ridge will warm us up in two ways, first it is associated with general warming of the atmosphere and lots of sun.  But it will also bring increasing offshore flow, which really revs up the heat, as warm, continental air east of the Cascades sinks and is warmed further by compression as it descends into the western lowlands.

Let's follow the 2-m (surface) air temperature and near surface (10-m) winds  that is forecast by the UW model.   First,  at 5 PM Monday:  56-60F over western Washington and a bit warmer near Portland and the Columbia Basin.


Tuesday afternoon, a notch warmer,with 60s over western WA and 70s to the east.

 Wednesday brings real warming. Widespread 70s in western Washington as easterly flow really cranks up, with some areas in SW Washington and the Willamette Valley hitting 80F.  Portland will be warm.


And then Thursday at 5 PM.  What can I say?  We haven't seen April temperatures like this in a decade.  A number of folks away from the water could get to 80+F that day.  I suspect that a 24-h virus may be rampant that day.

 Friday is the transition day, as onshore flow develops, with temperatures remaining warm from Seattle northward, and eastern Washington really surging in the torrid zone as the ridge moves inland.

At this point in time, the official outlets are going conservative, as they should.  The National Weather Service is predicting 79F for Wednesday and 81F for Thursday. Very reasonable.


The Weather Channel is slightly cooler than the NWS:

For those of you those like weather statistics, my colleagues at the National Weather Service have noted that the average first day getting to 80F in Seattle is May 23rd....we will do much better that that this year!   And let me provide an important warning.  Just because we are going to have a few summer-like days, don't think you can put those tomatoes outside yet:  cool weather will come back next weekend! 


Renewable Energy and the Period of Lowest Electricity Demand of the Year

We are now in the time of year with the lowest electricity demand in the Pacific Northwest, driven by our meteorology (see below). The major...