April 29, 2016

The Unusual: Normal Weather

Weather is like one's children:  for most of the time you think of it as being exceptional.

And to be honest, I give short-shrift to normality in the blog, since I love to talk about the unusual, the extreme, and the interesting weather situations.

But today I am going to break the mold and tell you that for the last week the weather has been excruciatingly normal.  Boring to some, perhaps.

Take temperatures at Seattle Tacoma Airport for the past week (see chart below with normal highs and lows in red and blue, respectively).  Pretty typical stuff.

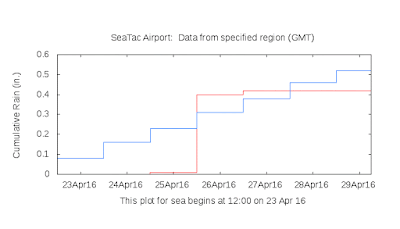
Sea-Tac precipitation?  The actual (red) is within .1 inches of normal during the same period.  You are probably starting to yawn.
Clouds...plenty of them, with a few breaks.   Totally normal in late April.


These normal conditions are found throughout the state.   For example, Pasco's temperatures during the same time are.....completely typical:
The famous U.S. Drought Monitor:  no drought in our State, except for some slight dryness over the far southeast.
The official Climate Prediction Center precipitation forecast for the next 3 months for Washington?  EC (equal chances if above or below normal)....which means a forecast of normal.


This is simply maddening.... normal is not good for the weather business.  


April 27, 2016

Destabilization

The air above us has cooled down substantially compared to a week ago, with temperatures near 5000 ft (850 hPa) on the WA coast at -1.1C this morning, compared to 16C in the middle of the heat wave last week.      But the sun is even stronger being a week later and it has the ability to substantially warm the surface.

So with cool temperatures aloft and strong warming at the surface, a large vertical temperature gradient (or lapse rate) developed, one that allows the lower atmosphere to destabilize and convect.

Yes, just like in your hot cereal, when you rev up the heat, the cereal starts to convect--some cereal moving up, some moving down.  Convection results when temperature in a fluid decreases rapidly in height.  In the case of a dry atmosphere, the temperature must decrease by at least 9.8C per kilometer.


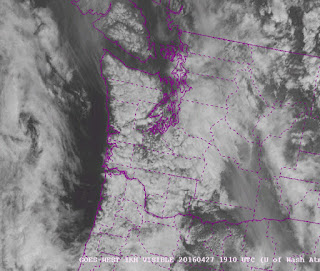
In the atmosphere today, instead of upward and downward convection currents in the oatmeal, we have convecting air parcels, with clouds (cumulus) forming with the upward motion.   Today's satellite picture documented the convecting action. At 7:40 AM, there was a lot of layered (stratiform) low clouds over our region (see satellite picture).  These are generally stable clouds without much vertical development.


The the strong late-April sun did its magic over land during the morning and that warming, coupled with cool temperatures above, caused instability and convection over land.  The satellite image at 12:15 PM shows this clearly in the puff-ball looking clouds.  Over our coastal waters it was virtually clear....same with the Strait of Juan de Fuca.  The water surface did not heat up.


The shallow nature of the convection was evident in local weather cams, such as my favorite SkunkBay Weather cam on the north side of the Kitsap Peninsula (see below)


And for those of you who like to have plenty of water during the summer, there is very good news.  The Yakima River reservoir system, so critical for agriculture in the Yakima Valley, has now reached the typical full level, but nearly two months earlier than normal  (see image)

The same thing is true for the City of Seattle reservoirs (red line below).


 There is still plenty of snow to melt int the mountains, unlike last year, so things look very good regarding water for this summer.

April 25, 2016

The Most Extreme Warm Day in Seattle History: April 18, 2016

On Monday, Seattle experienced a stunning and unparalleled temperature extreme:

the warmest daily temperature relative to normal conditions ever observed for any date since record keeping began at Seattle-Tacoma Airport (1948).  Any date, any season, any year.

Specifically, temperatures on Monday surged to 89F,when the normal maximum temperature for that date was 58F:  a 31F anomaly (difference from the normal high).    Never had the daily maximum been so far from the average maximum.  Just amazing.

The daily records showed this was the largest maximum temperature anomaly on record, with April 1, 1987 coming in at second place (28F anomaly).   Here are the top ten daily maximum temperature anomalies provided by Mark Stoelinga, a research meteorologist at Vaisalla, Inc.   You will notice the most of the top events are in spring, with April being heavily represented.  Why spring?

Average highs are relatively low in April (mid 50s to lower 60sF) and the sun is getting quite strong (the sun's intensity and duration on April 21st is the same as on August 21st).  May and early June is also a good period for extreme maximum temperatures compared to normal highs for the same reason.

But even in the best season (spring), to get the truly extreme high temperature anomalies, the atmospheric circulation on both the large and local scales must be just right.

So why was Monday so amazingly anomalous?

We started with a strong upper-level high pressure ridge in the idea location:  just inland from the coast. (see upper level (500hPa, roughly 18,000 ft)  map at 5 PM Monday) On the western periphery of the ridge there is southwesterly flow which brought very warm air northward.

The 850 hPa map (around 5000ft) shows the warm air (red/orange colors) and southerly winds along the coast, with higher heights (pressures) to the east, lower to the west.  The temperatures that morning over Seattle were very warm--higher that all days but one for the period January 1 through May 1.  The existence of a very strong El Nino, with above normal water temperatures along the West Coast, contributed to the warmth.


At low levels there was a modest offshore pressure gradient, so that weak easterly flow was pushing the cool, marine influence away from Sea-Tac Airport.  To show this, let's look at the winds and temperatures (red lines) above Sea-Tac Airport that day (below is a time-height cross section, time increasing to the left, time is in UTC).  1821 is 2 PM on Monday, the y axis is pressure (850 is about 5000 ft).  Weak easterly flow dominated at low levels.  If the flow had been westerly, cool air would have moved over Sea-Tac.   Stronger easterly flow over the Cascades would have produced low pressure near the Cascade foothills that would have drawn in marine air near the surface.

To quote Goldilocks:  everything was "just right."

Some folks will suggest tjat this as a good example of the impacts of global warming, but they would be wrong.  Of the 31.5F anomaly that day, perhaps 1-2 F could be traced to human impacts, the rest are the result of natural variability.   Thus, without any human intervention it would still have been a record-breaking extreme day.

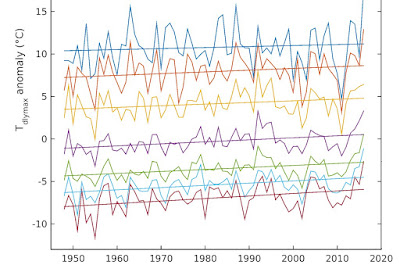
But you want to see this visually?   Here is an analysis done by Mark Stoelinga that shows the trend in yearly maximum extreme temperatures anomalies for the spring season (March, April, May)--blue lines.   We will talk about the other temperatures in another blog.  The biggest anomaly was this year (18C or 31F). And you will note that there is a very slow upward trend during the past 70 years:  about 1 C (1.8F).   Some of that trend is from human-increased greenhouse gases, some from urbanization, some from sensor changes, and some from natural variability.  In any case, the upward trend is small and eclipsed by the natural variability, with its jagged ups and downs.


As I noted in my Golden Rule of Climate Extremes:  the greater the climate anomaly, the larger the percentage of that anomaly due to natural variability.


April 23, 2016

TV Meteorologist Jeff Renner Retires from KING TV

One of the most distinguished members of the Northwest meteorological establishment, Jeff Renner, retired from KING TV on Friday, and his on-air presence will be missed.  Those of us in the Puget Sound weather community have come to depend on Jeff as one of our most visible and effective members, and this blog will tell some stories that may not be generally known about Jeff, including his substantial service to the University of Washington and my department.


Jeff came to KING TV as a general reporter in 1977, but became the weather anchor and science lead in 1980.   When St. Helens exploded in May 1980, his in-depth coverage of the event made him well-known throughout the region.   I started at the UW in late 1981 and quickly got to know Jeff at local weather gatherings.  

He was not satisfied being a TV weathercaster, without a weather background.  Jeff was determined to become a real meteorologist and to secure a degree in atmospheric sciences.  And he was willing to take years of math and physics courses that were the first step before entering a degree program, such as the one we offer at the UW.  

I was really impressed.   And during the next few years, he was good to his word.  He fulfilled all the responsibilities of his KING TV job while taking years of technical prerequisites before entering the UW atmospheric sciences program, which he completed successfully.  I enjoyed having Jeff in the senior forecasting class, where he was one the best students.


Jeff developed a reputation as someone who not only had an excellent delivery (and a voice more appropriate for an Olympian god) but a dedication to bring science and education into his message, frequently evincing the knowledge he had gained at the UW as well as an excellent intuition about the weather.   At regional meetings, like the Northwest Weather Conference, you could always be sure Jeff would be in attendance taking notes.

But then a setback occurred in his career.  A new news director at KING decided that a flashy female presence would be beneficial to ratings and Jeff was let go.   Many of us in the weather community protested to KING management (his replacement had no degree in meteorology was making serious technical errors), but it was the unhappiness of the viewers and their demand for Jeff's return that led to his triumphal reinstatement a year later.

During his year off, Jeff applied his formidable communications skills to enter a new sideline:  forensic meteorological consulting.  Many don't know that meteorologists are often hired to do research and testify in court cases, something I have done as well.  There is no better way to find out how weather is influencing people's lives in a serious way.   Jeff rapidly become well known in this endeavor:  he and I have even on the opposite sides for some lawsuits.


Jeff is an uber outdoorsman:   a frequent hiker, sailor, and pilot, among others.  He combined several of these interests with writing to produce a series of popular books on weather for outdoors enthusiasts.


 And he didn't stop there.   Over the years, Jeff created a number of excellent educational 1-hr specials on meteorological topics.

During the last several years, Jeff understood the importance of the developing technology of high-resolution weather prediction and arranged to secure a real-time feed of the UW's super high-resolution WRF output for KING TV , with this information translated into compelling graphical products known as FutureCast (see below).


Finally, Jeff has been a huge friend to the UW. During the years, a number of atmospheric sciences students interested in TV weather have interned at KING 5, gaining invaluable experiment that led to successful careers for several (such as the redoubtable Shannon O'Donnell and MJ McDermott). When the department had special evening lectures for the community, Jeff often was the MC, skillfully guiding the evening, providing wonderful intros for the speakers, and gentling asking for community support at the end.

Jeff retired this week, along with a number of other veterans of KING TV, a sign of downscaling of stations shrinking as TV newscasts become less popular as web access to information gains ascendance.  

But I suspect we have not heard the last from Jeff.  He has never been better as a communicator and his creative abilities are undiminished.   Improving models and internet capabilities do not mean that people don't require an experienced, knowledgeable voice to help them interpret and act upon the huge amount of environmental information that is flooding them.   It is more important than ever and I expect Jeff has some ideas for the future.


April 20, 2016

The Big Meltdown Followed By A Cool Down

The record breaking temperatures of the past few days and warmer than normal temperatures of this month have resulted in substantial melt of the formidable snowpack we started with on April 1.  And the rivers are responding.

To illustrate the snowmelt, here is the plot of snow water content at Stampede Pass at 4000 ft on the eastern side of the WA Cascades (normal snowpack is the light blue).  We were near normal around April 1, but have lost about 20% since then.

This massive melt of water is causing a number of rivers on the eastern slope of the Cascades  to approach flood stage, with predicted floods on some.  To illustrate, here are the hydrographs, showing the observed and predicted river levels and discharge for the Okanogan, Stehekin, and Naches rivers--all are predicted to flood during the next few days.


Spring flooding from snowmelt is not unusual, but it was generally absent last year because the snowpack was so poor.

During the next day, we are about to transition to a far cooler, wetter pattern as the ridge of high pressure weakens and moves westward.  The upper flow pattern changes substantially.  Here is the 500 hPa (18,000 ft) upper level map for 5 PM today (Wednesday). Big ridge centered over the Rockies, with a weak disturbance (trough) over Oregon--which has brought some thunderstorms to western Oregon and SW Washington.

 72 hours from now (5 PM Saturday), the ridge has weakened and westerly/southwesterly flow has invaded the West Coast.
As a result, over the next 72 h precipitation will return:  light over WA, but substantial to the south over Oregon and CA (see below).  Such precipitation is unusual for CA this late in the season and very welcome.
Want to be impressed?

The forecast total precipitation over the next two weeks by the GFS model is quite wet for the Northwest (see below), with some areas getting 4 inches or more.  Temperatures will return to normal.  I think folks are ready for some normal weather again.


April 18, 2016

The Warmest April Day in Seattle History

We broke major records today.

The warmest April day on record at Seattle (89F).  The previous record was 85F.

The warmest April day in record at Olympia (88F).  Previous record was 87F.

The warmest April day on record at Bellingham (83F).  Previous record was 78F.

We tied the record number of days hitting 80F or more at Seattle (two).  We will beat that record tomorrow.  It was also the warmest day since last August.

A number of local observing sites got to 90F or above.  I mean a LOT of locations--here is the map:


Not impressed yet?   The temperature at 850 hPa (around 5000 ft) at Quillayute, on the WA coast, was an amazing 16.2C.  (see plot, with light red line showing the daily record, and blue dot showing today's temperature).

It was the second warmest temperature at that level ever observed during the first four months of the year.  The warmest?  Earlier this month, April 7th, with 16.6C.


It was so warm that we started getting weird mirage effects because of superheated air over cold water.  Here is a picture sent to me by Tony Nahra, showing a marvelous superior mirage (lofting of objects on the opposite shore). The only other alternative explanation is a new Amazon complex.  I like the mirage better.


Why so warm?  Big ridge over the western U.S. aloft.

At 850 hPa (about 5000 ft), there was southerly flow with enough of an easterly component to give some offshore flow that reduced the marine influence.


And weak pressure variations at the surface (so no cool northerlies like on April 7th).  The meteorological planets were aligned for heat.

April 17, 2016

Super Contrail Day

Today was not only 20F warmer than normal, but was accompanied by one of the most amazing contrail displays I have seen in long time.  Here is the NASA MODIS visible imagery for early this (Sunday) afternoon for off the U.S. West Coast.  You see all the thin lines?

Those are contrails produced by high-flying jet aircraft.


A blow-up of the section off the Oregon/WA border is below:


Why was this such a spectacular contrail day?  Because vast areas in the upper troposphere was at or near saturation (100% relative humidity).

Today there was a ridge of high pressure over the West Coast, as shown by the upper level map at 300 hPa (around 30,000 ft) at 11 AM.  \


This map shows that there was southwesterly flow over the eastern Pacific that was associated with warm advection (approach of warmer air) and lifting, which led to saturation.   To prove this, here is a 6-h forecast for 11 AM on Sunday showing relative humidity at 300 hPa (against around 30,000 ft).  The air is saturated (100% relative humidity) in the region of the contrails.


That is why a vast area was covered with patchy high ice crystal clouds (mainly cirrostratus).  The moisture from the jet engine combustion (plus the particles emitted from the burning fuel) helped thicken the cirrostratus, producing contrails.    Contrails are FAR less evident in dry air.

We can prove the upper troposphere was near saturation by viewing the vertical sounding (using a radiosonde, a balloon-lofted instrument package) this morning at Quillayate on the Washington coast (see below).  The red is temperature, the blue is dew point, and when they approach each other the air is close to saturation.   From 550 hPa to 200 hPa (roughly 17,000 ft to 40,000 ft) the air was saturated or close to it.    A little extra moisture ensures saturation and cloudiness.


Some folks believe that the contrails shown above are chemtrails, toxic chemicals emitted by a secret U.S. government program.  But such ideas have no basis in truth and the fact contrails are more frequent when the air is close to saturation is strong proof of the benign origin of contrails.

Interestingly, contrails WARM the planet.  They reflect some solar radiation to space, but their impact on the infrared radiation balance of the planet is larger (they intercept infrared radiation coming up from below, where it is warmer, and emit infrared radiation at a relatively cool temperature).


April 15, 2016

ANOTHER Heat Wave. Will this Summer be a Repeat of the Last One?

It looks like quite a few of you will experience 80F again during the next few days.

Another major heat event is coming, with temperatures well into the 60s on Saturday, mid to upper 70s on Sunday, and even low 80s on Monday.    As you know, I have a lot of respect for the forecasts from weather.com and here are their numbers:

Considering that the average max temperature this time of the year is around 58F, we are talking about record territory for some days, with highs about 20-25F above normal.

The origin of this warmth?  You can guess it.  A strong ridge of high pressure over the West Coast (see the upper level map, 500 hPa level, at 2 PM Sunday).

I can't tell you how many people have told me they are worried about a repeat of last year:   very warm spring, water issues, low snowpack, wildfires galore, terrifying blobs, and all the other unpleasantness of last spring and summer.  They ask: are we seeing a permanent shift of our climate due to global warming?

What does the data and best science tell us?  This summer should be nothing like the last in terms of those unpleasant impacts.

The first thing to consider is while last winter brought normal precipitation, this year we had the wettest winter in Northwest history.  That makes a difference.
Reservoirs are full, groundwater is in good shape, rivers are running full.

Let's have some fun and do some more detailed comparisons.

The previous winter we had near normal or slightly below normal precipitation over the region.  This winter?  Here is the total from October 1, 2015 to April 14, 2016 precipitation anomaly (difference from normal).  This year, most of the region is above normal, with western Oregon and Washington much above normal.


Last year the snowpack was the worst in history.  This year it is normal, which means our full reservoirs will be topped off with lots of snow melt.   (see current snowpack figure for Washington below).

So, with wet conditions this winter and plenty of snow, river levels will be good into the summer.  Here is the 120 day stream fow forecast for eastern WA from the NWS River Forecast Center (percent of average).  We are talking about mid-August.  The Yakima River will be way above normal and the lowest rivers are near normal (about 80%).


The Yakima River authorities are forecasting plenty of water for farmers:  BOTH senior and junior rights holders.

What about heat?   We can start by looking at the water temperatures offshore.  Below are the weekly sea surface temperature (SST) anomalies from normal for last year and this year in April.   MUCH cooler till year.  Forget the blob.


A contributor to the warm water has been the VERY strong El Nino of the last year (and the moderate one the year before).  However, El Nino is weakening rapidly right now, so much so that the National Weather Service has released a La Nina alert for next winter.    A weakening El Nino should lead to cooling, both over the water and over land.  However, it will take some time (months) for its impacts to start to fade.

What about the persistent high pressure of last winter and spring?   Aren't we seeing some big ridges the last few weeks?   We have.  But the ridging and warmth have not been as steady and persistent as last  year....that is why we have gotten precipitation quite frequently.

Here is the last NMME seasonal  (June, July, August) forecasts provided by NOAA, based on an ensemble of seasonal climate models.

Precipitation is near normal.


Temperatures are moderately (.5 to 1C) above normal.  Last summer was 2-5C above normal.

Bottom line repeated:  we are in much better shape this summer.  Last summer was a fluke, resulting mainly from natural variability.  Global warming may have contributed a small about (perhaps .5C) to the warming, but it can not explain the key feature that caused all the trouble:   the persistent high pressure ridging.

So enjoy some very pleasant weather this weekend with no guilt.
_________________
Announcement:  Jazz and Astronaut Fundraiser for KPLU on May 14th!

How often do you get to meet and hear from an astronaut at a wonderful location (Museum of Flight, Seattle), with great jazz right before?    I am going!

For more information: http://www.brownpapertickets.com/event/2534871


Tomorrow's Windstorm in Four Acts

 Each atmospheric "play" is different and according to high-resolution forecast models, I can describe the four "acts" t...