Meteorologists have no need to purchase artwork.
The reason is that imagery from satellites, radars, and numerical models is often stunning.
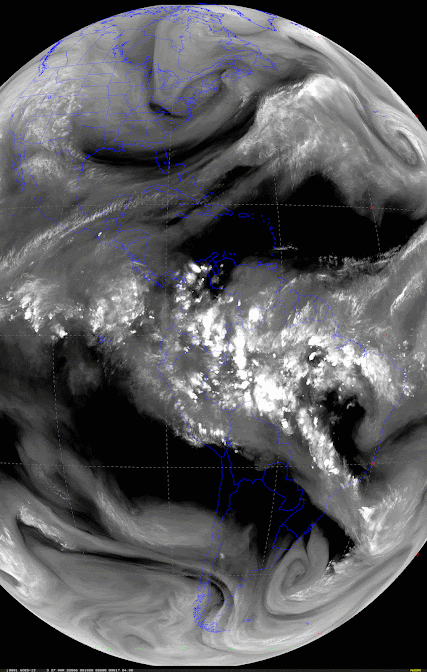
Let me show you an example: water vapor imagery from weather satellites.
Most of the satellite imagery you see on TV and the media uses wavelengths that DON'T show you the atmosphere. Visible satellite imagery shows you how much solar radiation is reflected off clouds and surface. Infrared satellite imagery tells you the temperatures of clouds and surface, based on how much radiation they emit.
But there are exceptions to this situation, and the most important is wave vapor imagery that displays the amount of radiation emitted by water vapor in the atmosphere. Where the imagery is white, that means a great deal of moisture is in the upper troposphere (roughly 20,000-35,000 ft), where temperatures are relatively cool. Dark shades indicate little upper-atmosphere moisture and plenty in the lower atmosphere.
We are ready....let's look at atmospheric art.
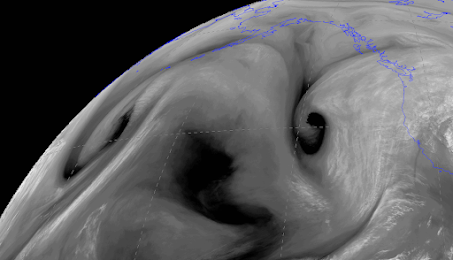
Below is the water vapor image from Friday afternoon over the northeast Pacific. Two beautiful swirls are evident....both associated with mid-latitude cyclones (low centers). The dry dark areas are where dry air is sinking down behind and into the low centers.
Massive white areas to the east of the storms are associated with very moist, rising air.


ReplyDeleteCliff, the artwork I would like to see is a whole year of the 500mB height looking over the north pole. https://a.atmos.washington.edu/~ovens/wxloop.cgi?npole_h500+/-168//
Does that video exist?
I have used some GOES 17 imagery to promote my photography business. It's especially interesting when something is happening that can be seen from above and from below at the same time. Mountain wave clouds from the Olympics are one example I can think of.
ReplyDeleteThank you Cliff. This is very cool
ReplyDeleteThanks Cliff, very interesting!
ReplyDeleteWhat are your thoughts on the latest predictions from the NOAA Climate Center for our upcoming weather? From the 6-10 day thru 3 month outlook NOAA is going for below normal temps and above normal-EC for precip. I know that you have said before to take anything > 10 days with a pinch of salt but usually when I check these predictions they lean toward the Above normal temps and less precip so I am interested to learn why this is the case and if its related to La Nina and/or Pacific ocean surface temps etc.
https://www.cpc.ncep.noaa.gov/products/analysis_monitoring/enso_advisory/ensodisc.shtml